Somebody wants to delete an endpoint. It was replaced two years ago, it carries a bug nobody will fix, and it is the reason a migration cannot finish. The question goes to the team: who still calls this?
And the honest answer is that nobody knows. There are gateway logs with thirty days of retention. There is a dashboard showing total requests per route, which says the endpoint receives some traffic, which tells you nothing about whether that traffic is one important customer or a health check you forgot about. There is no way to go from a route to a list of accounts. So the endpoint stays, the migration stalls, and next quarter somebody asks again.
That is what API analytics is for, and it is a different question from the one monitoring answers. Monitoring asks whether the API is working. Analytics asks who is using it, for what, and what happens to them if it changes. The dimensions are consumer identity, endpoint, version and time, and the outputs are adoption, retention, deprecation risk and, eventually, an invoice.
The invoice is worth being upfront about. Teams arrive at this category asking about deprecation and leave having built usage metering, because once you can attribute every call to a customer you are one step away from charging for it, and the commercial side of the business will notice. That connection shapes what you should buy, because analytics and billing have very different tolerance for lost data.
Key takeaways
- Attribution is the entire problem. A request you cannot tie to an account is a row of noise, and the requests hardest to attribute (rejected at the gateway) are the ones about the customers in the most trouble.
- Per-consumer, per-endpoint, per-status breakdowns are a cardinality disaster for a metrics system. This is an event store problem, which is why analytics lives in a columnar database and not next to your dashboards.
- Deprecation is decided by unique consumers in a window, not by request volume. One integration calling once a month is invisible in volume and will still break loudly.
- Analytics data can be sampled and approximate. Billing data cannot. Decide before you build whether your analytics pipeline is the system of record for revenue, and if it is, build it to a different standard.
Attribution: identity is the hard part
Everything in this category depends on turning a request into an account. That sounds mechanical and it is not, because the identifier on the request and the entity you want to bill or notify are usually several hops apart.
Where the identity comes from. An API key maps to a key record which maps to an account, and the mapping is a join, not a field. OAuth gives you a client identifier, which identifies an application rather than a customer, and one customer may have several. A bearer token’s claims may carry a subject and an organisation, or only a subject, which means a user-to-organisation lookup that changes over time. Mutual TLS gives you a certificate subject. Each of these is resolvable and each needs a deliberate mapping that stays correct when accounts merge, keys rotate and applications are transferred.
Where attribution happens, and what each place cannot see. This is the decision that determines what your analytics can ever answer.
At the gateway, you see every request that arrives, including the ones rejected for a bad key, an expired token, a missing scope or a rate limit. What you usually do not have is business context: the gateway knows a key identifier, not that this account is on the enterprise plan and this call belongs to the feature they are piloting.
In application middleware, you have full business context because you are inside the request with the account loaded. What you cannot see is everything that never got there. A customer whose integration is sending an expired token generates zero application-level events and looks like a customer who stopped using the product, which is precisely backwards.
That asymmetry matters more than it sounds. The single most valuable analytics signal in a developer-facing product is a consumer whose error rate just went to a hundred percent, and if you only instrument the application you will never see it, because their requests are dying at the door. Instrument both, and make sure the gateway’s identifier resolves to the same account identifier your application uses, or you will have two datasets that cannot be joined.
Cardinality will break your metrics system. Consumers multiplied by endpoints multiplied by status codes multiplied by versions is a time series count that grows as the product of four dimensions, and metrics systems price and perform on exactly that number. Teams discover this by putting a customer identifier in a metric label and watching their monitoring bill or their memory usage climb until something falls over.
The correct shape is events, not metrics: one row per request with the dimensions as columns, stored in a columnar database that answers group-by queries over high-cardinality columns efficiently. That is a different system from the one holding your operational dashboards, and it is the same architectural argument made in the analytics database comparison. Every hosted product below is, underneath, doing this for you. If you build it yourself, this is the decision to get right first.
Needs first-hand data: Take one day of gateway logs and one day of application-level events, join them on your account identifier, and count how many gateway requests fail to resolve to an account at all. Break the unattributable set down by status code. Most teams find a surprising share of it is 401s and 429s, which means their analytics is structurally blind to customers who are currently failing, and the count is the argument for fixing attribution at the gateway.
Adoption and deprecation impact
Once attribution works, the questions you can answer change from aggregate to specific, and specificity is what lets you act.
What adoption actually needs. Request volume per endpoint is the least useful metric in this category, because it is dominated by whichever endpoint your busiest customer polls. The dimensions that drive decisions are different:
- Unique consumers in a window. How many distinct accounts called this endpoint in the last ninety days. This is the number that decides whether an endpoint can be removed.
- First seen and last seen, per consumer per endpoint. Tells you who adopted a new endpoint and who quietly stopped using an old one, which is a churn signal well before it is a revenue signal.
- Request share within a consumer. An endpoint that is a rounding error globally may be the only endpoint one important customer uses.
- Version distribution. Which API version, and which client SDK version, derived from the user agent. Without this you cannot plan an upgrade campaign, only announce one.
- Field-level usage, where the protocol allows it. GraphQL makes this possible and it is the only way deprecation ever finishes on a graph, as covered in the GraphQL platforms guide.
The deprecation procedure that works. Announcement first is the common mistake, because it commits you before you know the impact. The order that works is measure, then decide, then announce.
Measure unique consumers over a window long enough to catch monthly and quarterly jobs, which usually means at least ninety days and sometimes a full year for anything financial. Then classify: a handful of consumers is an outreach problem, dozens is a migration campaign, hundreds means the endpoint is not deprecated, it is load-bearing.
Then announce with machine-readable signals as well as an email. The Deprecation and Sunset response headers exist for this and cost nothing to emit, and a well-behaved client can log them. Follow with targeted outreach to the specific accounts you identified, which is only possible because attribution works. Then run a brownout: return errors for the endpoint during announced short windows well before the sunset date, which converts a calendar notice into a paged engineer at the consumer’s end. Brownouts find the integrations that nobody is reading email about, which is most of them. Then remove, and keep the removal reversible for a short period.
The long tail is the whole risk. The integration that breaks loudly is almost never the high-volume one, because high-volume consumers are known, engaged and watching. It is the batch job that runs on the first of the month, from a customer whose original integrator left the company, which appears in no volume-based dashboard at all. Unique-consumer counts over a long window are the only way to see it. This is the measurement side of the API versioning and deprecation discipline, and without it the rest of that process is guesswork.
Needs first-hand data: Pick an endpoint you believe is unused and pull the distinct account identifiers that called it over the last twelve months, not the last thirty days. Then compare that against what your standard dashboard retention window showed. The gap between the two lists is the set of customers your deprecation process would have broken silently, and it is the clearest possible justification for longer analytics retention.
Why all of this ends in usage-based billing
Every team that builds per-consumer API analytics eventually gets asked to bill from it. That is a reasonable request and it is where a lot of this goes wrong, because the two use cases have incompatible requirements and the difference is not obvious until an invoice is disputed.
Analytics tolerates loss. Billing does not. Analytics pipelines sample under load, drop events when a buffer fills, aggregate old data into rollups that discard detail, and apply retention that deletes the raw rows. Every one of those is a correct engineering decision for analytics and a defect for billing. If a customer questions a charge, you need to produce the underlying calls, and “we sampled at ten percent and extrapolated” is not an answer anybody accepts.
What a metering path actually requires, beyond what analytics needs:
- Idempotent ingestion with a stable event identifier, so a retry in the pipeline does not double-charge. This is the same discipline as webhook delivery and for the same reason.
- Handling for late arrival. An event generated at the end of a billing period may arrive after the invoice is computed. You need a defined cutoff and a policy for what happens after it, either a correction or a carry-forward, decided once rather than per incident.
- Immutable raw records retained for at least a dispute window, which is usually longer than your analytics retention and frequently longer than your finance team assumes.
- Deterministic recomputation. Running the invoice calculation again over the same raw data must produce the same number. That rules out any aggregation that is not reproducible from retained inputs.
- A customer-facing usage view that agrees with the invoice. If your dashboard and your bill disagree by any amount, every conversation becomes about the discrepancy rather than the price.
The structural recommendation is to separate the paths. Let the analytics pipeline be fast, sampled, richly dimensioned and lossy. Let the metering path be narrow, complete, idempotent and boring, emitting only the dimensions you actually bill on. Then reconcile them on a schedule and alert when they diverge beyond a tolerance, because divergence is the earliest signal that one of them is broken.
Choose the billing dimension before you build. Requests are the easiest to meter and the easiest for customers to understand, and they correlate weakly with your cost. Compute time or data volume track cost better and are harder to explain and harder to predict, which customers hate. Whatever you pick, the constraint is the same: you must be able to show the customer the underlying units on demand. A meter the customer cannot inspect will be disputed, and you will lose, because you cannot prove it.
There is one more reason this section matters for tool selection. Several products below sit in the request path as a gateway, which means they can meter and enforce in the same place, and enforcement is the other half of monetisation: a plan limit is only real if something rejects the call, which is the rate limiting layer wearing a commercial hat.
Moesif
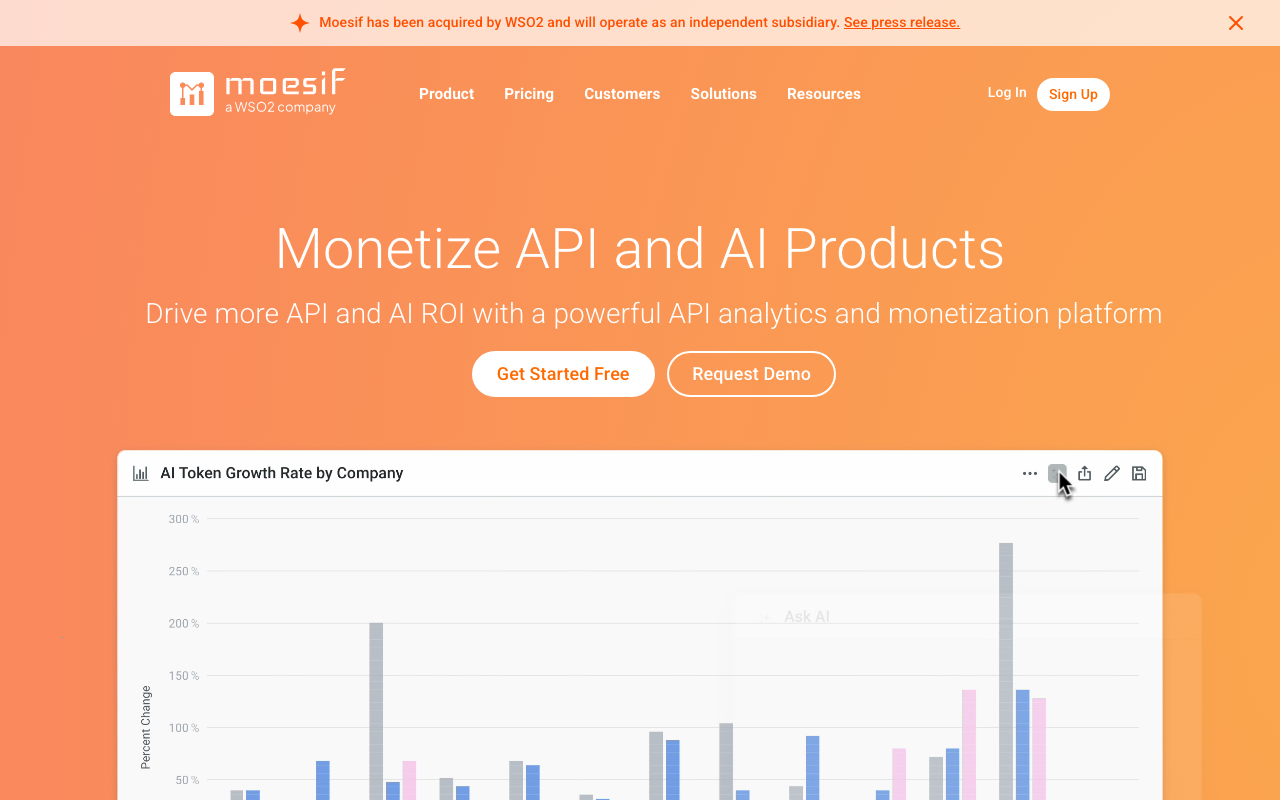
Moesif is the most analytics-native product in this list. It ingests API events, attributes them to users and companies, and exposes the result as funnels, cohorts, retention curves and segment comparisons, which is a product-analytics vocabulary applied to API traffic. It also includes billing meters that push usage into payment platforms, which makes the path from attribution to invoice a configuration rather than a project.
Pros
- Company-level and user-level attribution is the core data model rather than a tag, so “which accounts use this endpoint” is a first-class query instead of a log search
- Behavioural analysis including funnels, cohorts and retention answers adoption and churn questions that no gateway dashboard can
- Billing meters that feed payment platforms turn usage into invoices without building a metering pipeline
- Governance rules acting on live traffic can enforce plan limits and surface in-product messaging, so the commercial side is not purely observational
Cons
- Event-based pricing makes high-volume, low-value traffic expensive to observe, which pushes teams toward sampling exactly where billing accuracy requires completeness
- It is a platform rather than a feature, and the setup work to get past basic dashboards, particularly the identity mapping, is substantial
- Sending full API events including identity to a third party is a data-flow decision that will need a security review
- Operational monitoring is not its strength, so it complements rather than replaces your API monitoring stack
Best for: Product and platform teams who need per-customer usage analysis and intend to drive usage-based billing from the same data.
Pricing: Usage-based metering on API events ingested with tiered plans by retention and features, and enterprise agreements above that.
Treblle
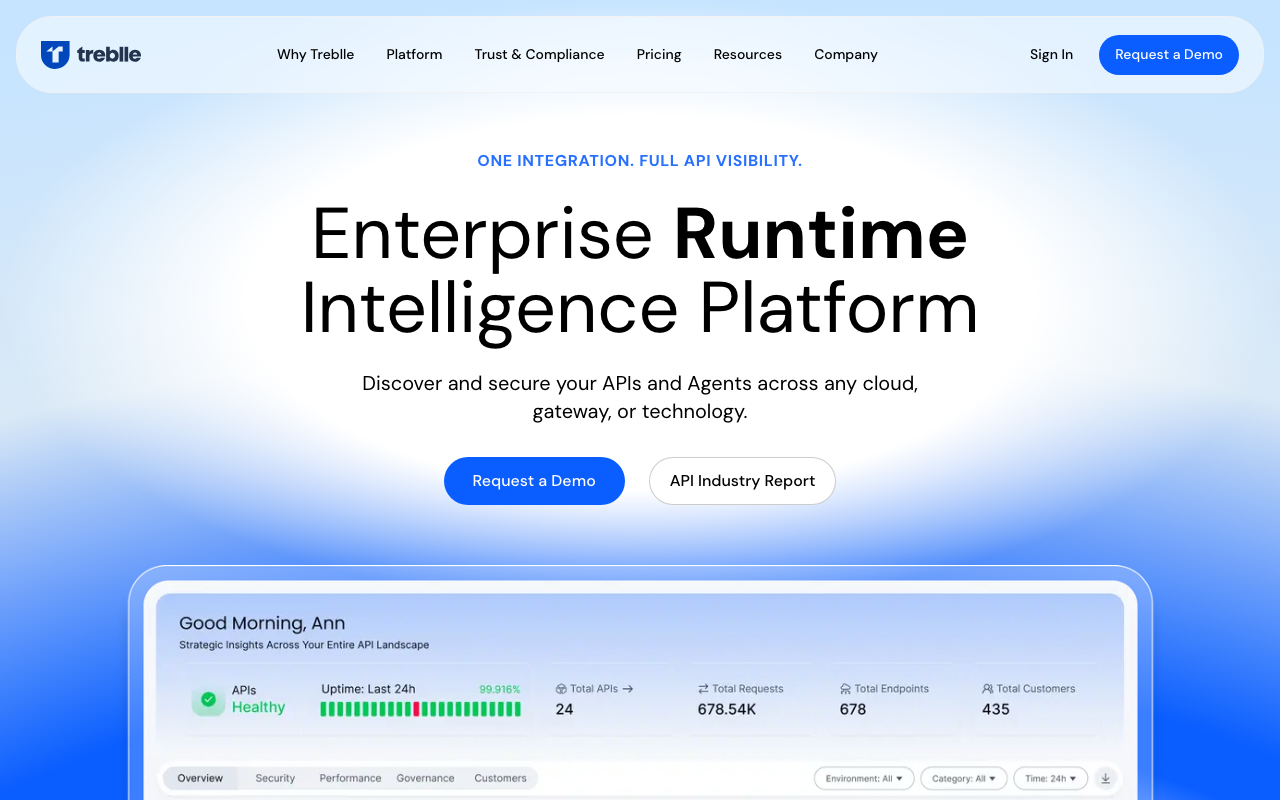
Treblle observes API traffic from inside the application through middleware and presents per-endpoint analytics alongside quality and security scoring and traffic-derived documentation. Its orientation is the engineering team that owns the API rather than the commercial team monetising it, and the install effort is genuinely small, which is the main argument for it.
Pros
- Middleware install means real per-endpoint data within an afternoon, with no gateway configuration or traffic mirroring project
- In-process capture carries full business context, so attributing a request to an account is a field you populate rather than a join you engineer
- Endpoint-level views, error breakdowns and traffic-derived documentation give engineering teams adoption data in the same place they debug
- Quality scoring gives a concrete target for cleanup work that non-specialists can follow
Cons
- Requests rejected before reaching your application are invisible, so consumers failing authentication or hitting rate limits do not appear at all
- Analytics depth is shallower than the dedicated platforms: no cohorts, no retention curves, no billing meters
- Coverage depends on an SDK for each language and framework you run, which is a gap in polyglot estates
- Payloads leaving the process makes redaction configuration load-bearing, and the default is not a security decision anyone made deliberately
Best for: Engineering teams who want per-endpoint usage visibility quickly, without a gateway project or a commercial analytics programme.
Pricing: Usage-based metering on requests observed with tiered plans adding retention and team features.
Apigee
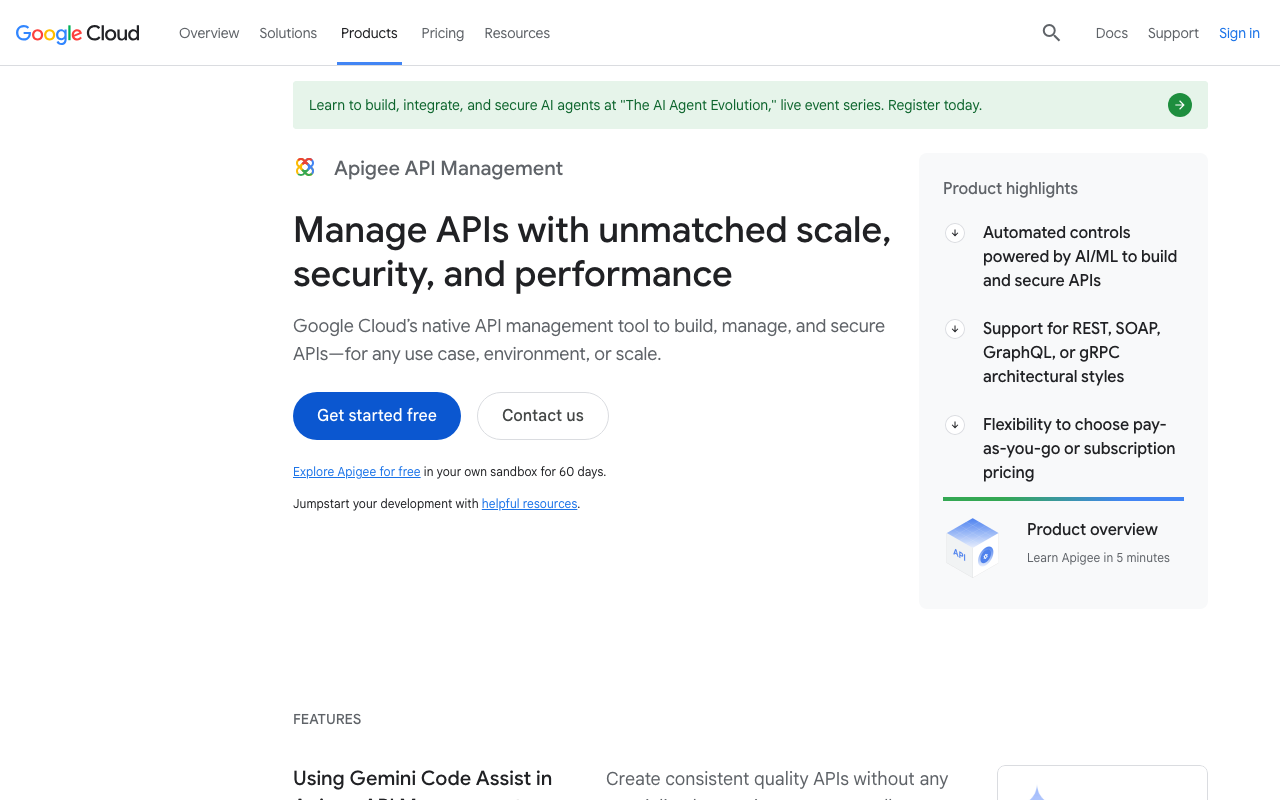
Apigee’s analytics are the mature end of this category, built around the dimensions an API programme actually manages: developers, applications, API products and environments. Because it is a full management platform, a request arrives already associated with a registered developer and an app subscribed to a product, so attribution is structural rather than reconstructed. The monetisation module builds rate plans on top of the same dimensions.
Pros
- Developer, app and product are first-class entities, so attribution requires no mapping work and reporting aligns with how the programme is governed
- Monetisation with rate plans, quotas and billing built on the same model means metering and enforcement share one source of truth
- Long-horizon reporting suited to the ninety-day and annual windows that deprecation decisions actually need
- Enterprise governance, access control and residency controls are mature, which matters when the data identifies customers
Cons
- The analytics are inseparable from adopting Apigee as your management platform, which is a very large decision to make for reporting
- Heavyweight to operate and configure, with a learning curve that is a genuine project rather than an onboarding
- Costs scale with the platform rather than with the analytics you use, so the reporting is expensive if that is all you wanted
- Less suited to the exploratory, product-analytics style of questioning that a dedicated analytics tool supports
Best for: Organisations already running or seriously evaluating Apigee as their API management platform, where analytics and monetisation come with the programme.
Pricing: Enterprise subscription tiering on API call volume and environments, with monetisation available as part of higher tiers rather than metered separately.
Kong

Kong’s analytics sit in the control plane above its gateway, aggregating traffic across services, routes and consumers from the data plane you already run. The consumer concept is native to the gateway, which means per-consumer attribution is available for every request the gateway handled, including the ones it rejected. That last detail is exactly the blind spot that in-application tools have.
Pros
- Consumer is a native gateway entity, so per-customer attribution covers rejected requests, rate-limited calls and authentication failures that never reach your services
- No application changes at all, which means coverage is uniform across every language and framework behind the gateway
- Analytics share the control plane with routing, authentication and rate limiting policy, so enforcing what you measure is one configuration surface
- Aggregates across a distributed data plane, giving one view over gateways in multiple regions and clusters
Cons
- The gateway sees keys and consumers, not plans and accounts, so business context still requires mapping gateway consumers to your billing entities
- Meaningful analytics sit in the commercial control plane rather than the open-source gateway, so this is a tier upgrade and not a free capability
- Retention windows are tied to plan level, and deprecation analysis needs longer windows than operational dashboards do
- Product-analytics style questions like retention and funnels are outside its scope entirely
Best for: Teams already running Kong who want per-consumer analytics covering every request the gateway sees, without instrumenting applications.
Pricing: Included at tiered levels within the commercial control plane subscription, with retention and volume as the scaling dimensions.
Zuplo
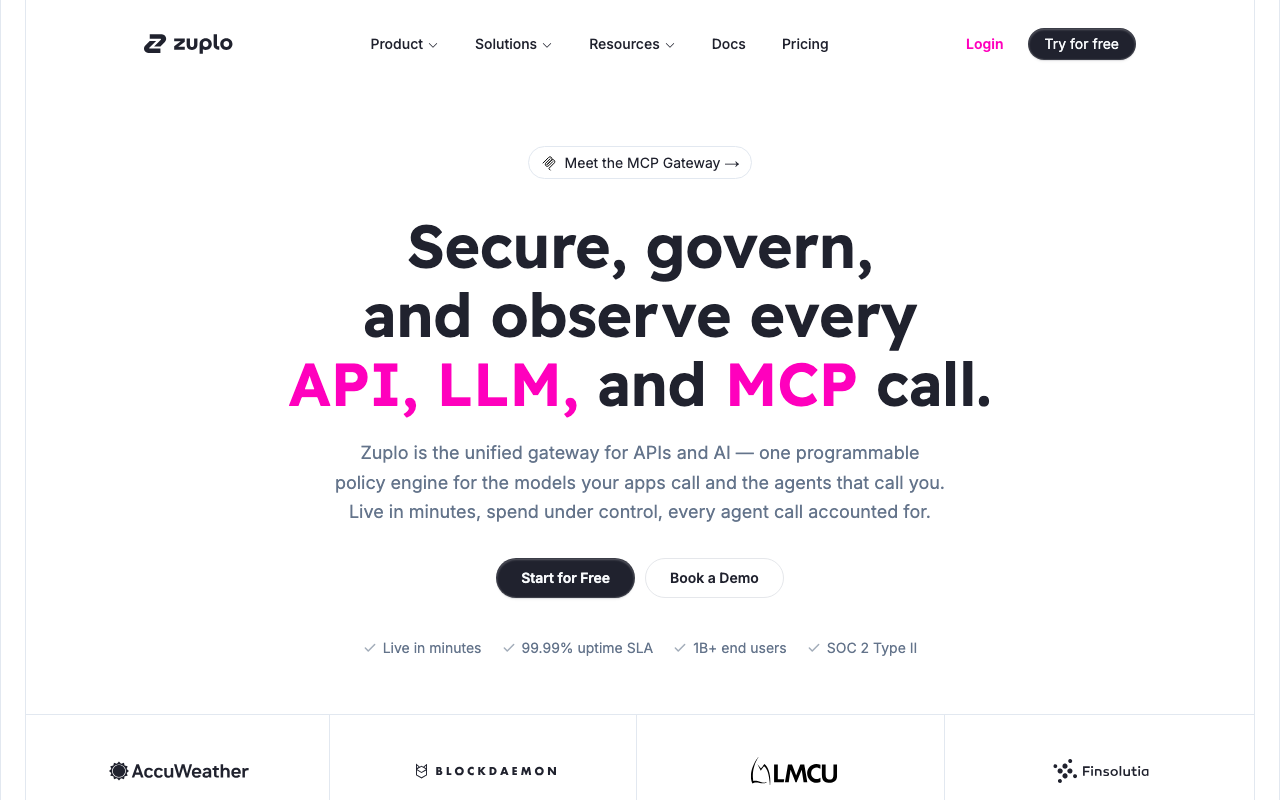
Zuplo is a programmable gateway deployed at the edge where policies are code in your repository, with analytics, a developer portal and monetisation built around the same model. The relevant property here is that it combines the gateway’s complete view of traffic with the ability to write attribution logic directly, so mapping a request to whatever account identity your business uses is a function rather than a configuration limit.
Pros
- Policies as code mean attribution logic, including any custom identity resolution, lives in your repository and is reviewed and versioned like anything else
- Gateway position gives complete traffic visibility including rejected requests, with the developer portal giving consumers their own usage view
- Monetisation and quota enforcement are built into the same layer that measures, so a plan limit and its meter cannot drift apart
- Edge deployment keeps the measurement point close to consumers rather than concentrated in one region
Cons
- Adopting it for analytics means adopting it as your gateway, which is a much larger architectural decision than adding an analytics tool
- A younger platform than the incumbents, so ecosystem depth and third-party operational knowledge are thinner
- Analytics depth is oriented to API programme management rather than exploratory behavioural analysis
- Programmable policies are powerful and mean your gateway now contains code with a deployment lifecycle and a failure mode
Best for: Teams building a developer-facing API product who want the gateway, developer portal, usage metering and billing enforcement as one code-defined layer.
Pricing: Usage-based metering on requests handled with tiered plans adding portal, monetisation and enterprise features.
APIToolkit
APIToolkit observes live traffic and derives per-endpoint analytics alongside schema inference and anomaly detection. Its distinctive contribution to the analytics question is that it models each endpoint’s actual shape from traffic, which means adoption data extends to fields and parameters rather than stopping at the route, and undocumented endpoints appear in the inventory without anybody declaring them.
Pros
- Schema inference gives field-level and parameter-level usage, which is the granularity deprecation decisions need and route-level counts cannot provide
- Discovers undocumented endpoints automatically, so the adoption inventory includes routes nobody declared
- Combines analytics with anomaly and drift detection, so one dataset answers both “who uses this” and “did it change”
- A self-hosting option exists, which keeps traffic and identity data inside your network
Cons
- Traffic-based, so requests rejected upstream at a gateway are outside its view unless it is deployed there
- Smaller vendor and ecosystem than the established platforms, which affects integration breadth and available operational knowledge
- No billing meters or monetisation layer, so the path from usage to invoice is yours to build
- Payload observation raises the same redaction and retention questions as any capturing tool, and they need answering before enabling it
Best for: Teams who need field-level adoption data and endpoint discovery from real traffic, without a commercial monetisation programme attached.
Pricing: Usage-based metering on requests observed with tiered plans, plus a self-hosted option priced separately.
How to choose
What is the question that brought you here? If it is “who uses this endpoint so I can delete it”, you need long retention and unique-consumer counts, and almost anything here works provided you extend retention past the operational default. If it is “which customers are expanding and which are quietly churning”, you need behavioural analytics and the answer is Moesif. If it is “we need to bill for this”, the shortlist is whatever also gives you a metering path you can defend in a dispute.
Where can you measure? If you run a gateway, measure there first, because it is the only place that sees rejected requests and it needs no application changes. If you do not run one, application middleware is the pragmatic answer and you should know what it cannot see. If you already run Kong or Apigee, the analytics are a tier decision rather than a new vendor.
Is this data going to become revenue? If yes, separate the metering path from the analytics path now rather than discovering the difference during a dispute. Analytics can sample; billing cannot. Building one pipeline for both means either an expensive analytics store or an indefensible invoice, and usually both.
How long do you need to keep it? This is the question nobody asks and it eliminates options. Deprecation analysis needs at least a year. Billing disputes need at least a contract term. Operational dashboards need a month. Check the retention on the tier you would actually buy, not the one on the pricing page.
| Tool | Measurement point | Sees rejected requests | Billing meters | Picks itself when |
|---|---|---|---|---|
| Moesif | SDK or gateway plugin | Depends on integration | Yes | Per-customer behaviour drives both product and pricing |
| Treblle | Application middleware | No | No | You want endpoint adoption data this afternoon |
| Apigee | Management platform | Yes | Yes, via monetisation | The API is a governed programme with registered developers |
| Kong | Gateway control plane | Yes | Quota enforcement, not invoicing | You already run Kong and want zero app changes |
| Zuplo | Programmable edge gateway | Yes | Yes | The gateway, portal and metering should be one code-defined layer |
| APIToolkit | Traffic observation | Only if deployed at the gateway | No | You need field-level usage and endpoint discovery |
Frequently asked questions
Why can I not just use my metrics system for per-customer API analytics?
Cardinality. A customer identifier as a metric label multiplies your time series count by the number of customers, then by endpoints, then by status codes, and metrics systems both price and perform on that number. This is an event store problem: one row per request, columns for the dimensions, queried by a columnar database designed for high-cardinality group-bys. That is a different system from the one holding your dashboards, and putting customer identifiers in metric labels is how teams discover it the expensive way.
How long do I actually need to retain API analytics?
Longer than operational monitoring, and the driver is deprecation rather than debugging. To safely remove an endpoint you need unique consumers over a window that catches monthly, quarterly and annual jobs, which means a year is a sensible floor. If the same data supports billing, retention must also cover your dispute window, which is typically set by your contracts rather than by engineering.
Can I bill customers from my analytics pipeline?
You can, and you should think hard before doing it. Analytics pipelines sample, drop under load and roll up detail, all of which are correct for analytics and fatal for billing. If a customer disputes a charge you must produce the underlying calls. The safer shape is a separate narrow metering path that is idempotent, complete and retained, reconciled against analytics on a schedule so divergence is detected rather than discovered.
How do I find the customers who will break when I deprecate an endpoint?
Unique account identifiers over at least ninety days, and preferably a year, rather than request volume. Volume dashboards are dominated by your busiest consumer and hide the monthly batch job that is the actual risk. Then confirm with a brownout: return errors during short announced windows before the sunset date. That converts a notice nobody read into a page somebody answers, and it surfaces the integrations that no email would ever have reached.
Should analytics live at the gateway or in the application?
Both, if you can. The gateway sees every request including the ones it rejects, which is how you detect a customer whose integration is failing authentication. The application has the business context that makes the data meaningful. The important part is that both emit the same account identifier so the two datasets can be joined, because two views that cannot be joined is the most common way this ends up half-built.
Related reading
- Best API management platforms — the layer where consumers, products and plans are defined, which is what attribution resolves against.
- Best API monitoring tools — the same traffic read for failure rather than adoption.
- Best tools for API versioning and deprecation — the process this measurement exists to make safe.
- Best rate limiting solutions — enforcing the plan limits that usage metering defines.
- Postgres vs ClickHouse vs Tinybird — the storage decision underneath any analytics pipeline you build yourself.
- Best API gateways — the measurement point that sees rejected requests, which application instrumentation never will.