Two of the three options in this comparison are the same database. That is the most useful thing to know before you start, because it splits what looks like one decision into two, and the two are not decided the same way.
Postgres computes the answer when the tenant loads the page. The rows that serve the dashboard are the same rows that serve checkout, stored the same way, in a format built for reading and writing whole records rather than for scanning one column across millions of them.
ClickHouse computes the answer long before anyone asks. Rows land in sorted, compressed, columnar parts, and a materialized view rolls them into a pre-aggregated table as they arrive. By the time a tenant opens the chart, most of the arithmetic already happened during a background merge.
Tinybird is ClickHouse with the path from a query to a customer-facing endpoint already built: managed ingest, SQL held in version control, each query published as an HTTP API, and per-request tokens that constrain a query to one tenant’s rows.
So the first choice — Postgres or ClickHouse — is a storage architecture decision with consequences you can derive from the physical layout. The second choice — ClickHouse or Tinybird — is not a storage decision at all. It is a decision about how much of the plumbing between a column store and a customer’s browser you want to own. Most comparisons flatten those into one three-way feature table, which is why they are useless: they invite you to compare a row store, a column store, and a hosting model along the same axis.
Key takeaways
- Postgres stretches much further than people admit, but not by making analytics queries fast. It stretches by pre-aggregating into rollup tables, at which point you have built a small column store with none of the compression and all of the vacuum.
- The Postgres failure is not slowness. It is a dashboard query and a checkout write sharing a connection pool, and a long-running analytics transaction holding back autovacuum on your busiest OLTP table.
- ClickHouse is built for a few large queries, not for two thousand tenants refreshing a chart at 09:00. Concurrency, not scan speed, is the constraint that actually decides whether it works for in-product dashboards.
- Tenant isolation in ClickHouse is a sort key prefix, not a permission. Put
tenant_idfirst inORDER BYor nothing else you do will matter.- ClickHouse versus Tinybird is build-versus-buy for ingest, query versioning, endpoint publishing, and token scoping. Tinybird also inverts the cost feedback loop: a careless query costs latency on your own cluster and money on someone else’s.
What “per-tenant analytics” actually demands
The workload has a shape, and the shape is what disqualifies most defaults.
The queries are aggregate, the results are small. A tenant asks for daily active users over ninety days and gets ninety numbers back. The work is in the scan, not the response.
The queries are shaped in advance. You wrote the dashboard. There are perhaps forty distinct query shapes in the whole product, each parameterized by tenant, date range, and a couple of filters. This is the single most exploitable fact about the workload, and it is the fact that a data warehouse is designed to ignore, because a warehouse exists to serve questions nobody predicted.
Concurrency is customer-shaped, not analyst-shaped. Your internal BI tool has maybe twelve simultaneous users. An in-product dashboard has as many as you have tenants awake, and they arrive in a spike at the start of the business day in each timezone.
Latency is a product surface. A warehouse query taking eight seconds is a mild annoyance to an analyst. The same eight seconds on a customer-facing chart is a support ticket, and if it happens on the page that justifies your invoice, it is a churn risk.
Isolation is a correctness requirement, not a preference. Every query must be constrained to one tenant, and the constraint has to survive a junior engineer adding a new endpoint on a Friday.
Freshness is a product decision you get to make. This one is a gift. Almost nobody needs their usage chart accurate to the second, and the cost difference between one-minute freshness and one-second freshness is large. Decide it deliberately, because half the architectures people build are paying for a real-time guarantee they never advertised.
Those six together explain why the answer is not “use your warehouse.” Snowflake and BigQuery are excellent at arbitrary questions from few users at high per-query cost and unbounded latency. Every one of those traits is backwards for this workload.
Postgres: computing the answer at read time
Start here, and stay here longer than the internet will tell you to. The interesting question is not whether Postgres can serve dashboards — it can, for a long time — but what specifically runs out, so you can see it coming.
Why aggregation is structurally expensive
Postgres stores rows as heap tuples in 8KB pages. A row’s columns sit adjacent to each other, which is exactly right when you need one whole record and exactly wrong when you need one column from ten million records. Summing a single amount column means reading every page that contains those rows, including every other column of every row, through the buffer cache. You pay I/O and cache pressure proportional to the width of the table rather than the width of the query.
Compression does not rescue this. Postgres compresses oversized values through TOAST, not columns in general, so a narrow integer column inside a wide table is read at the table’s density, not its own.
Indexes change the access path without changing that fact. A B-tree on (tenant_id, created_at) finds the right rows quickly, then the heap fetch reads full pages. An index-only scan can avoid the heap entirely, but only if the index covers every column the query touches and the visibility map says the pages are all-visible — which, on a table taking constant writes, is frequently not true. BRIN indexes are the exception worth knowing: on an append-only table where physical order tracks time, a BRIN index on the timestamp is tiny and prunes enormous ranges. It does nothing for a column whose values are scattered through the heap.
How far it stretches, honestly
Three techniques, in the order you will actually reach for them.
Partitioning by time. Declarative partitioning on created_at, monthly or weekly, so the planner prunes to the partitions in range and old data can be detached instead of deleted. This is the cheapest real win available and it also converts your retention policy from a DELETE that generates millions of dead tuples into a DETACH that generates none.
Rollup tables. The honest name for the thing that keeps Postgres viable. You maintain a table of pre-aggregated counters, keyed by tenant and time bucket, and the dashboard reads from that instead of raw events.
create table usage_daily (
  tenant_id   bigint      not null,
  day         date        not null,
  event_type  text        not null,
  events      bigint      not null default 0,
  primary key (tenant_id, day, event_type)
);

-- run per batch of ingested events
insert into usage_daily (tenant_id, day, event_type, events)
select tenant_id, created_at::date, event_type, count(*)
from   events_raw
where  created_at >= $1 and created_at < $2
group  by 1, 2, 3
on conflict (tenant_id, day, event_type)
do update set events = usage_daily.events + excluded.events;
That works, and it is a real architecture, not a hack. But notice what you have built: a narrow, sorted, pre-aggregated store queried by a prefix of its key. That is a column store’s data layout, implemented in a row store, maintained by code you own, with none of the compression and all of the MVCC overhead. The on conflict do update pattern in particular rewrites a tuple on every batch, and every rewrite leaves a dead tuple behind.
Materialized views, with a caveat that matters. REFRESH MATERIALIZED VIEW recomputes the entire view. There is no incremental refresh in core Postgres. CONCURRENTLY avoids taking an exclusive lock, requires a unique index, and is slower than the blocking version. For a view over ninety days of events, a refresh cycle is a full recomputation of ninety days to reflect the last five minutes. Materialized views are excellent for slow-changing dimensions and a poor fit for a growing event stream.
TimescaleDB changes this specific limitation, and it is the strongest argument for staying on Postgres. Continuous aggregates are incrementally maintained: the extension tracks which time regions have been invalidated by new writes and refreshes only those, and a real-time aggregate can union the materialized buckets with raw rows newer than the last refresh so the chart is current without recomputing anything. Combined with hypertable chunking and native compression on older chunks, it is a genuinely different Postgres, and for a large fraction of SaaS products it is where this decision should stop. Its ceiling is the one below, arriving later.
Tenant isolation
Isolation is a composite key discipline: tenant_id first in the primary key and first in every index that serves the dashboard, so a per-tenant query is a range scan rather than a filter applied after the fact. Row-level security can enforce the predicate at the database rather than trusting every query, which is worth real money in reduced blast radius from an application bug — at the cost of a policy that the planner must incorporate, occasionally in ways that change plan choice.
Schema-per-tenant is the other pattern, and it does not scale in the direction people expect. A thousand schemas means a thousand copies of every table’s metadata in the system catalogs, autovacuum work proportional to table count rather than data volume, and migrations that are now a thousand-step job with partial-failure states.
What actually runs out
Not query time. Two other things, and both of them arrive as an incident somewhere else in your product.
The connection pool is shared and analytics queries are greedy. A dashboard query holds a connection for its duration and can allocate work_mem per sort or hash node — several times over within a single plan. Twenty tenants opening a heavy chart at once is twenty connections you cannot use for transactional work and a memory multiple you did not budget. The symptom is not a slow dashboard. It is checkout latency rising, unrelated pages timing out, and a pool exhaustion alert that points at the wrong service. Read replicas are the standard mitigation and they are a good one: analytics goes to a replica, writes stay on the primary, and the two workloads stop competing for connections and cache. Just be clear that a replica fixes contention, not the underlying cost of scanning a row store.
Long analytics transactions hold back vacuum. This is the mechanism worth carrying away from this section. A long-running query holds a snapshot, the snapshot pins the transaction horizon, and autovacuum cannot reclaim dead tuples newer than that horizon — on any table, including the OLTP tables your product depends on. A ten-minute report generation query is, for those ten minutes, blocking cleanup of the dead tuples your checkout path is generating. Tables bloat, index scans slow down as they traverse pages full of dead rows, and the cause is a reporting query on a different table entirely. On a hot-standby replica the same effect reaches back to the primary through hot_standby_feedback, which is exactly the setting you turn on to stop replica queries being cancelled.
Where the 3am failure lands: the pager fires for transactional latency, not analytics. Someone loaded a two-year date range on a tenant with an outlier volume of events, the query planner switched from an index scan to a sequential scan, the plan took minutes instead of milliseconds, the pool filled, and the transaction horizon stalled behind it. Everything you look at first — the checkout service, the API gateway, the connection pool metrics — is a symptom.
ClickHouse: computing the answer at merge time
ClickHouse answers the same question by moving nearly all of the work off the read path.
The mechanism
A MergeTree table stores data in parts. Each part holds the rows sorted by the table’s ORDER BY key, with each column written as its own file, compressed. Because a column file contains many similar values in sorted order, compression ratios are large in a way row storage cannot match, and reading one column touches only that column’s bytes.
There is no per-row index. ClickHouse keeps a sparse primary index: one entry per granule, a granule being a fixed number of rows. To answer a query it uses the index to identify which granules could possibly contain matching rows, then reads only those. Partition pruning eliminates whole partitions first; data skipping indexes — min/max, set, bloom filter — eliminate granules within a part.
The consequence is that the ORDER BY key is not a tuning parameter. It is the design. A query whose predicate matches a prefix of the sort key reads a handful of granules. A query whose predicate does not reads everything the partition pruning failed to eliminate. Two queries that look almost identical in SQL can differ by three orders of magnitude in bytes read, and the difference is entirely which columns lead the sort key.
For per-tenant dashboards this yields one rule that outranks everything else:
create table events
(
    tenant_id   UInt64,
    ts          DateTime,
    event_type  LowCardinality(String),
    user_id     UInt64,
    value       Float64
)
engine = MergeTree
partition by toYYYYMM(ts)
order by (tenant_id, event_type, ts);
tenant_id leads the sort key, so every tenant’s rows are physically contiguous and a per-tenant query reads a narrow slice of granules. Partitioning is by month, not by tenant — partitioning by tenant would create a part directory per tenant per insert and walk you directly into the failure mode described below.
Pre-aggregation is a first-class feature
The rollup table you hand-rolled in Postgres is built in. A materialized view in ClickHouse is a trigger on insert: rows arriving in the source table are transformed and written into a target table, incrementally, without recomputation.
create table usage_daily
(
    tenant_id  UInt64,
    day        Date,
    event_type LowCardinality(String),
    events     AggregateFunction(count),
    users      AggregateFunction(uniq, UInt64)
)
engine = AggregatingMergeTree
order by (tenant_id, event_type, day);

create materialized view usage_daily_mv to usage_daily as
select tenant_id,
       toDate(ts) as day,
       event_type,
       countState()      as events,
       uniqState(user_id) as users
from events
group by tenant_id, day, event_type;
The State suffix stores partial aggregation states rather than finished numbers, background merges combine states for the same key, and the dashboard reads with countMerge() and uniqMerge() to finish the job. Approximate distinct counts, quantiles, and top-K all work this way. The dashboard query becomes a read of a few thousand pre-aggregated rows.
This is the whole argument for ClickHouse in this workload, and it is a strong one. Your forty known query shapes each get a materialized view sized to them, and the cost of a page load stops being a function of the tenant’s event volume.
The constraint nobody leads with: concurrency
ClickHouse is designed to make one query use an entire machine. By default a single query parallelizes across available cores, reading granules in parallel and merging partial results. That is why a billion-row aggregate returns quickly. It is also why the system’s natural concurrency is low: a handful of heavy queries saturate the CPU, and the server enforces a limit on concurrently running queries beyond which new ones are rejected rather than queued indefinitely.
An internal analytics team never notices. Fifteen analysts, a few queries each, and the machine is never oversubscribed. A per-tenant dashboard is the opposite shape: hundreds or thousands of small, cheap, simultaneous queries arriving in a burst. Each one is individually trivial; collectively they contend for threads and memory, and the ones at the back of the queue see latency that has nothing to do with how much data they read.
This is the single most under-reported fact about using ClickHouse for in-product analytics, and it is entirely manageable once you know it exists:
- Pre-aggregate hard enough that each dashboard query is small. A query over pre-aggregated daily rows does not need sixteen threads. Cap
max_threadsfor the dashboard user profile so a small query takes one or two threads and a hundred of them coexist. - Separate the workloads. Put customer-facing queries on their own replicas, or their own cluster, so an internal analyst exploring raw events cannot degrade a customer’s page.
- Set per-user quotas and memory limits. ClickHouse will let a query consume memory until it hits a limit and then fail it. Choose where that limit is per profile rather than discovering the machine’s answer.
- Cache the shapes that repeat. Many tenants request the same trailing-thirty-days window. The query result cache and a short application-level cache both apply, and the freshness decision you made earlier is what tells you how long you may hold them.
The other sharp edges
Updates and deletes are not free. ClickHouse parts are immutable. An ALTER TABLE ... UPDATE or DELETE is a mutation that asynchronously rewrites affected parts. Lightweight deletes mark rows as removed via a mask and defer the rewrite, which is much better for the common case, but the physical work still happens eventually. Design so that correcting data means inserting a newer version — ReplacingMergeTree with a version column — rather than updating in place. Plan the “delete everything for tenant X” requirement explicitly, because it will arrive as a contractual obligation with a deadline, and the answer you want by then is a partition drop or a well-tested mutation, not an improvisation.
Joins are the weak spot. The engine has improved substantially here, with several join algorithms available, but the instinct that serves you well is still to avoid large joins on the read path. Denormalize at ingest, and use dictionaries for dimension lookups — a dictionary is an in-memory key-value structure refreshed from a source, and dictGet() in a query is a hash lookup rather than a join.
Cardinality is the sort key’s problem. Putting a high-cardinality column early in the ORDER BY — a request_id, a raw URL, a UUID — destroys compression, because sorted adjacency stops producing similar neighbouring values, and it wastes the primary index on a column no dashboard filters by. LowCardinality(String) for enumerable values like event type is close to free and should be the default for that shape of column.
Where the 3am failure lands: Too many parts. Every insert creates a part; background merges combine them; if inserts arrive faster than merges can keep up, the part count climbs and the server begins delaying and then rejecting inserts outright to protect itself. The usual cause is many small inserts — a service writing one row per event rather than batching, or a partition key that fragments every insert across many partitions. Ingest stops, and because ingest stopped rather than queries, the dashboards keep working while quietly going stale, which is a worse failure than an outage because nobody notices for an hour. Batch your inserts or use asynchronous inserts, keep partitions coarse, and alert on part count per table before it becomes the incident.
Tinybird: the same engine with the path built
Tinybird is managed ClickHouse plus the specific set of components you would otherwise write yourself to get from a column store to a customer-facing chart. Understanding which components those are is how you evaluate it, because they are the entire product.
Ingest. An HTTP endpoint that accepts JSON events and handles the batching, retry, and part-count discipline described above. This is the piece teams most often get wrong on self-hosted ClickHouse, and it is the direct cause of the failure mode in the previous section.
Queries as versioned files. SQL lives in files in your repository — data source definitions and pipes, chained SQL nodes — deployed through a CLI. Your analytics schema goes through code review and lands in git history, which is a meaningful change from “someone ran a DDL statement in production nine months ago and left.”
Queries published as APIs. A pipe becomes an HTTP endpoint with typed, named parameters. Your frontend calls a URL rather than your backend proxying a SQL string, which removes a service you would otherwise build, operate, and secure.
Tokens that carry the tenant filter. A token can be scoped so that a query is constrained to one tenant’s rows, with the filter values fixed in a signed token rather than supplied by the caller. This is the part worth pausing on, because it is the isolation requirement from the top of this article, solved structurally. On self-hosted ClickHouse you build the equivalent — an API layer that never accepts a tenant identifier from the client and always injects it from the session — and you build it correctly on the first day and every day after.
What you give up
Operational surface. You are working through a managed abstraction rather than a server you administer. That is the point of buying it, and it means the escape hatches are narrower than raw ClickHouse when you need something unusual.
Cost feedback inverts. This deserves more attention than the pricing page gets. On your own cluster, a badly written query costs you latency and CPU on hardware you already paid for; the feedback is immediate, visible in a dashboard, and free. On usage-based pricing tied to processed data, a badly written query costs money, in proportion to how much data it reads, every single time a customer loads the page. An endpoint that scans a month instead of a day because someone dropped a filter does not get slower in a way anyone notices. It gets more expensive, silently, and you find out on the invoice. The mitigation is not complicated — read the processed-bytes figure for every endpoint before publishing it, and alert on the per-endpoint trend — but it is a discipline that self-hosting does not require of you.
Vendor dependency on a live product surface. Not the generic lock-in argument. The specific one: this vendor is now in the request path of a page your customers look at. The mitigating fact, and it is a real one, is that the underlying engine is ClickHouse and the queries are ClickHouse SQL in your repository, so migrating means rebuilding ingest, publishing, and auth rather than rewriting your analytics logic. That is a substantially smaller trap than a proprietary query language.
Where the 3am failure lands: a limit you did not know applied. Rate limits on an endpoint during a traffic spike, a plan quota reached mid-month, or a deploy that changed a pipe’s query so that processed data per request multiplied. The response to all three is a support conversation rather than a configuration change, and how you feel about that is most of the build-versus-buy answer.
The second decision is not a database decision
By this point the shape should be clear.
Postgres versus ClickHouse is a genuine architecture choice, and it is decided by workload physics: how many raw rows, how wide the scans, whether pre-aggregation in the row store is holding, and whether analytics is starting to damage the transactional side. Both answers are respectable and one of them is much cheaper to get to.
ClickHouse versus Tinybird is the same database twice. The decision is who builds and operates ingest batching, materialized view maintenance, query versioning, API publishing, token-scoped tenant isolation, and the cluster underneath — and it is decided by headcount and attention, not by benchmarks. Roughly:
- Nobody on the team owns data infrastructure as part of their job description → buy the path. The self-hosted version will work for three months and then drift into the part-count failure during an incident, because keeping it healthy was nobody’s stated responsibility.
- You already run ClickHouse for something else and someone competent owns it → run it yourself. You have already paid the expensive part of this bill.
- Your query volume is large and predictable, and processed-data pricing projects to more than a dedicated cluster and the fraction of an engineer to run it → run it yourself, with the cost model in the decision doc so the next person understands why.
- You need to ship customer-facing analytics this quarter and the alternative is a two-month infrastructure project → buy the path, and keep the SQL in your repository so the exit stays cheap.
How to decide, in order
- Write down the freshness requirement, in seconds, per chart. Most teams discover that everything except one live counter is fine at one to five minutes. That single answer removes more architecture than any other decision on this list.
- Count the query shapes. If the dashboard has fewer than about fifty distinct shapes, pre-aggregation covers you and you do not need a general-purpose analytics engine. If tenants can compose arbitrary filters, you need one, and you should say so explicitly rather than discovering it after building forty views.
- Measure the widest tenant, not the average. Your p99 tenant is where the architecture breaks first, because per-tenant event volume in SaaS is typically distributed so that the largest customer sits a hundred to a thousand times above the median. As orders of magnitude rather than benchmarks: a partitioned Postgres table serving dashboards from rollups stays comfortable into the low hundreds of millions of raw rows, and starts to hurt when a single chart has to touch tens of millions of rows for one tenant. Timescale continuous aggregates with compression push that into the low billions. ClickHouse is not interesting for scan speed until you are near that range and is not uncomfortable until well past it. Growth rate decides more than the absolute number: somewhere around a hundred million new rows a month, maintaining your own rollups stops being a table and becomes a project with an owner.
- Measure the current pain precisely. A customer-facing chart wants p95 under roughly half a second, generates support tickets somewhere past two seconds, and at eight seconds on the page that justifies your invoice is a churn risk rather than a performance bug. But the number that forces the decision is not on the dashboard at all. It is whether analytics load is already visible in transactional latency: pool saturation that coincides with dashboard traffic, autovacuum falling behind on tables the reports never read, checkout p95 that moves with report volume. One clear instance of that outranks every row count in the previous step.
- Try the rollup table before the migration. A day spent on a pre-aggregated table and a partitioned events table is the cheapest possible test of whether you have a storage problem or a query problem. If rollups fix it, you are done, and you have kept one database.
- If Postgres is genuinely out of room, try Timescale continuous aggregates before leaving. Incremental refresh plus compression is the last stop that keeps your data in one system, with one backup story and one set of credentials.
- Then choose the column store, and separately choose who operates it. In that order, because reversing them is how teams end up evaluating hosting models against storage engines.
Migrating without a rewrite
If the answer is ClickHouse, the migration is boring in a good way, and running both is the normal steady state rather than a transitional embarrassment. Postgres remains the system of record for entities that get updated; the column store holds the append-only event stream that feeds the dashboards.
Two paths in, and the choice matters less than picking one deliberately:
- Change data capture from Postgres, streaming the replication log into ClickHouse. Reuses the writes you already do, and inherits an ordering and deduplication problem you must solve — usually with
ReplacingMergeTreeand a version column, and the understanding that deduplication happens at merge time, so a query that must not see duplicates needsFINALor an aggregation that tolerates them. - Dual write from the application, publishing events to both stores. Simpler to reason about, and it is now your responsibility that a failure to write to one store does not silently diverge the two.
Backfill historical data first, run both stores in parallel with the dashboard still reading Postgres, and compare outputs for a week. The bugs you will find are almost all timezone boundaries in date bucketing and disagreements about how late-arriving events are counted — cheap to fix while nobody is depending on the answer, expensive after.
Six entries follow rather than three. Postgres, ClickHouse and Tinybird are the shortlist this article argues about; Tiger Data is included because it is where the Postgres answer stops being a compromise, and Druid and Pinot because they are the direct answer to the one thing ClickHouse is genuinely weak at here. Leaving them out would mean raising the concurrency problem and then declining to say who solved it.
Needs first-hand data: Before you commit, trigger each candidate’s characteristic failure in staging and write down the recovery procedure. Insert in single rows until ClickHouse reports too many parts. Run a deliberately unbounded report against Postgres while watching dead tuple counts on an unrelated OLTP table. Drop a filter from a Tinybird endpoint and read the processed-bytes figure. You learn each of these cheaply exactly once, and it should not be during an incident.
PostgreSQL
The default, and the right answer for longer than the genre of article this one belongs to usually admits. Everything the dashboard needs is already here: partitioning, expression indexes, FILTER clauses on aggregates, window functions, and read replicas to keep reporting load away from the transactional path. What it lacks is columnar storage, so the cost of an aggregate scales with the width of the table rather than the width of the query, and the fix for that is pre-aggregation you build and maintain yourself. It is released under the PostgreSQL License, which is permissive enough that nobody has ever had to ask their legal team about it.
Pros
- Already in your stack, already backed up, already understood, already covered by your on-call rotation
- Transactional and analytical data in one place means no sync pipeline, no dual-write divergence, and no separate set of credentials
- Rollup tables plus time partitioning carry per-tenant dashboards a long way at zero additional infrastructure
- Row-level security enforces tenant isolation at the database rather than trusting every query someone writes
Cons
- Row storage means an aggregate reads whole rows, so scan cost tracks table width rather than the two columns you selected
- No incremental materialized views in core, so
REFRESHis a full recomputation of the whole view - Analytics queries and transactional traffic contend for the same connection pool and the same buffer cache
- A long-running report holds back autovacuum across the database, which turns a reporting query into transactional latency somewhere else
Best for: Every SaaS product until proven otherwise, and specifically any team that would rather spend the next quarter on product than on a data pipeline.
Pricing: No licence cost. You are paying for instance size, storage, and the replica you should add before you need it.
Tiger Data (TimescaleDB)
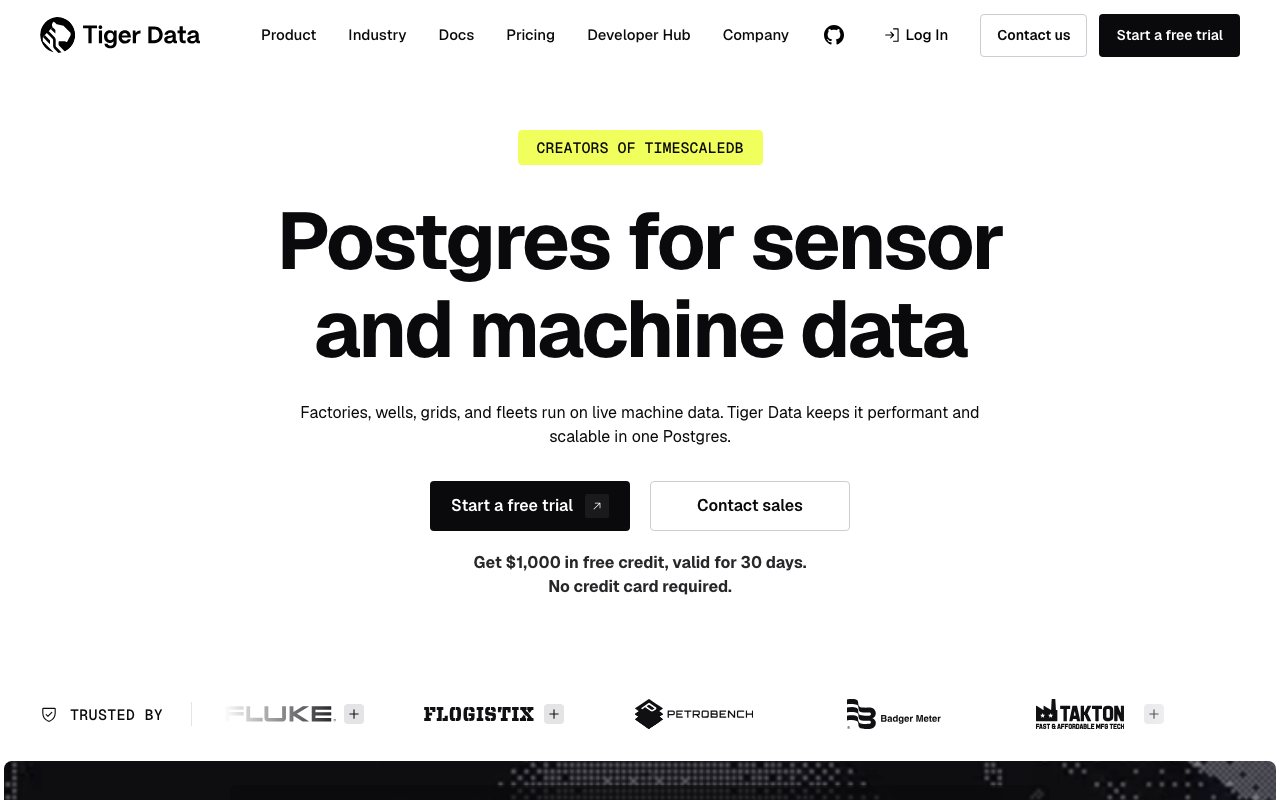
TimescaleDB is a Postgres extension that fixes the specific limitation above: continuous aggregates are incrementally maintained, refreshing only the time regions new writes invalidated rather than recomputing the view. Add hypertable chunking, native columnar compression on older chunks, and real-time aggregates that union materialized buckets with the newest raw rows, and a large share of teams who think they need a column store discover they needed this instead. Worth knowing before you plan around it: the company now trades as Tiger Data and its homepage sells Postgres for sensor and machine data, so the marketing centre of gravity has moved toward industrial and IoT workloads even though the extension serves SaaS analytics just as well. Licensing is split between an Apache 2.0 core and a source-available licence covering the advanced features, so confirm the current terms for the specific capabilities you intend to depend on.
Pros
- Incremental continuous aggregates, which is the one thing core Postgres cannot do and the reason most teams start looking at ClickHouse
- Columnar compression on older chunks cuts storage substantially while keeping the data queryable in place
- Real-time aggregates keep charts current without recomputing, so freshness stops being an argument against pre-aggregation
- It is still Postgres: same drivers, same tooling, same backups, same people
Cons
- Another extension to version and upgrade in step with your Postgres major version
- Advanced features sit under a source-available licence rather than the permissive one Postgres itself uses
- Compression and chunk sizing are real tuning decisions, not defaults you can ignore
- Vendor focus has shifted toward machine data, which is a roadmap signal worth watching if SaaS analytics is your only use case
Best for: Teams whose Postgres is straining under dashboard load but whose data volume does not yet justify a second database and the pipeline that comes with it.
Pricing: Self-hosted extension has no licence cost. The managed cloud is priced per compute and storage, with trial credit to size a workload before committing.
ClickHouse
The column store this comparison is really about. Sorted, compressed columnar parts with a sparse primary index, and materialized views that pre-aggregate at insert rather than on read. Aggregating billions of rows is quick and cheap, compression is the best of anything here, and the schema decisions — sort key first among them — carry almost all of the design cost. Apache 2.0, with a managed cloud from the company that develops it and several other vendors offering hosted versions.
Pros
- Columnar storage and aggregate function states make pre-aggregation a first-class feature rather than a rollup table you maintain
- Compression ratios that change the storage conversation entirely at long retention
tenant_idas the sort key prefix makes per-tenant queries a narrow granule scan, which is exactly the access pattern this workload has- A single node handles far more than people expect, so the cluster you are told to plan for is often unnecessary
Cons
- Built for a few large queries rather than thousands of small concurrent ones, which is the opposite of an in-product dashboard’s traffic shape
- The sort key is chosen once and effectively forever; getting it wrong means rewriting a large table
- Mutations rewrite parts, so updates and per-tenant deletion need designing in advance rather than improvising when the request arrives
- Small frequent inserts walk into the too many parts failure, and when it fires ingest stops while dashboards keep serving stale data
Best for: Teams with real event volume, known query shapes, and somebody whose job includes owning the schema.
Pricing: No licence cost self-hosted; you pay for nodes, storage, and the engineering attention the schema needs. Managed clouds price on compute and storage.
Tinybird
ClickHouse with the path to a customer-facing endpoint already built, which is close to how the product describes itself. Events arrive over an HTTP ingest endpoint that handles batching, SQL lives as files in your repository and deploys through a CLI, each pipe publishes as a parameterized HTTP API, and tokens can carry a fixed tenant filter so a query cannot escape its tenant. Those four pieces are precisely the ones a team building on raw ClickHouse has to write, secure, and operate themselves, and SaaS dashboards are the first use case the product lists.
Pros
- Removes the API layer you would otherwise build between the column store and your frontend
- Token-scoped tenant filters make isolation structural rather than a convention every new endpoint has to remember
- Analytics SQL in version control and deployed through CI, which is a real improvement over DDL applied by hand months ago
- Ingest that batches correctly out of the box, avoiding the single most common self-hosted ClickHouse failure
Cons
- Usage-based pricing on processed data inverts the feedback loop: a careless query costs money silently instead of latency you can see
- Less operational surface than raw ClickHouse, so unusual requirements have narrower escape hatches
- A vendor is now in the request path of a page your customers look at
- Cost scales with dashboard traffic, which is the metric you are otherwise trying to grow
Best for: Teams shipping customer-facing analytics who do not have anyone whose job is data infrastructure, and who would rather pay a bill than staff a cluster.
Pricing: Usage-based on processed data and storage, with a free tier large enough to build against. Model your busiest endpoint’s processed bytes per request before committing, because that number multiplied by dashboard traffic is the bill.
Apache Druid
The answer to the concurrency problem this article raises about ClickHouse. Druid is built for user-facing analytics applications specifically, and advertises consistent performance from hundreds to hundreds of thousands of queries per second — a claim shaped around exactly the traffic pattern a multi-tenant dashboard produces. Data is segmented, indexed, and pre-aggregated at ingestion, streaming and batch sources are both first-class, and the cost is a genuinely multi-component architecture. Apache 2.0.
Pros
- Designed for high query concurrency rather than tolerating it, which is the single most relevant difference from ClickHouse here
- Sub-second aggregate queries on high-cardinality data without pre-defining every query
- Native streaming ingestion from Kafka and Kinesis with exactly-once semantics
- Rollup at ingestion time reduces stored volume before it becomes a retention cost
Cons
- Several distinct node types to deploy, size and monitor, each with its own scaling signal
- Operationally the heaviest option in this comparison by a wide margin
- Joins and non-timeseries workloads are weaker than the columnar alternatives
- Overkill for a product whose dashboard is forty known queries over a few billion rows
Best for: Products where the analytics surface is the product, with concurrency high enough that ClickHouse’s thread model becomes the constraint.
Pricing: No licence cost; you pay in infrastructure and, more significantly, in the operational attention a multi-component cluster requires.
Apache Pinot
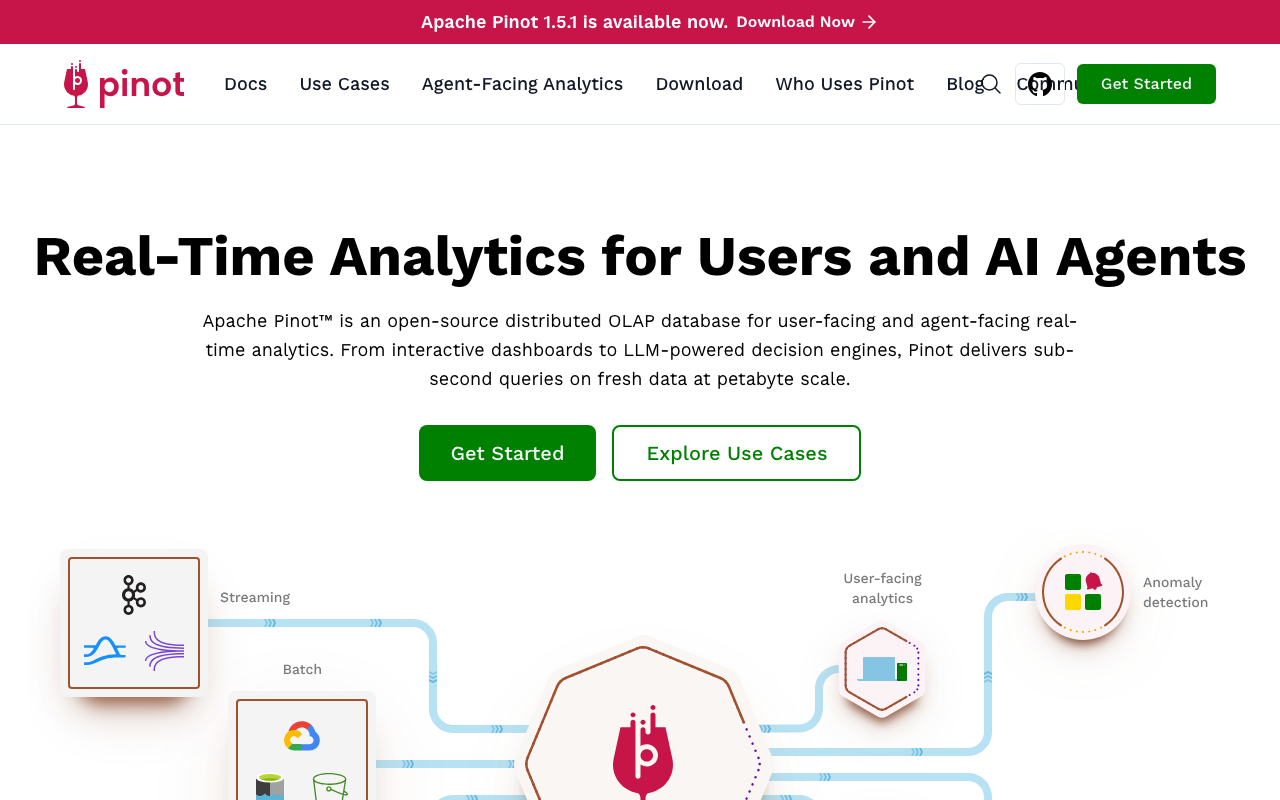
Pinot occupies the same niche as Druid and states the target audience even more directly: user-facing and agent-facing real-time analytics, sub-second queries on fresh data. Star-tree indexes let it pre-materialize aggregations across dimension combinations, which is the mechanism behind its concurrency numbers, and upserts on streaming tables handle the mutable-event case that ClickHouse makes awkward. Apache 2.0, and the choice between it and Druid usually comes down to which operational model your team finds more legible rather than to a benchmark.
Pros
- Explicitly built for many concurrent user-facing queries, with indexing designed around that goal
- Star-tree indexes trade storage for pre-computed aggregations across dimension combinations
- Upsert support on real-time tables, which handles correction and late-arriving events cleanly
- Strong streaming ingestion story with low ingest-to-query latency
Cons
- Cluster architecture with several component types, so the operational burden resembles Druid’s
- Smaller community and ecosystem than ClickHouse, and fewer managed options
- Index selection is a real design exercise with meaningful storage consequences
- Ad-hoc exploratory querying is not what it optimizes for
Best for: High-concurrency customer-facing analytics where per-tenant dashboards are a core product surface rather than a feature.
Pricing: No licence cost; infrastructure plus operational time, with managed offerings available from vendors in the ecosystem.
Frequently asked questions
Can I just use Postgres?
For longer than most comparison articles suggest, yes. With time partitioning, tenant_id leading every dashboard index, rollup tables maintained incrementally, and analytics served from a read replica, Postgres handles per-tenant dashboards for a large share of SaaS products. Add TimescaleDB continuous aggregates and the ceiling rises again. What eventually forces the move is not a query being slow in isolation; it is that keeping the rollups correct has become a real engineering project, and that analytics load is now visible in your transactional latency. When you are writing your own incremental aggregation framework, you have chosen to build a column store. Buy one instead.
Is Tinybird just ClickHouse with a markup?
The engine is the same, so the comparison worth making is not “column store versus column store” but “your operational time versus their bill.” What you are buying is ingest that batches correctly, SQL in version control, endpoints published from queries, and token-scoped tenant isolation. If your team would build all four well and keep them healthy, self-hosting is cheaper. If those four would be somebody’s fifth priority, the managed version is cheaper than it looks, because the alternative is not self-hosted ClickHouse working well — it is self-hosted ClickHouse working until the first traffic spike.
Why is my ClickHouse dashboard slow when the same query is fast in isolation?
Almost certainly concurrency rather than scan cost. ClickHouse defaults to letting one query use many cores, which is optimal for a few heavy queries and counterproductive for hundreds of small simultaneous ones. Cap max_threads in the profile your dashboard user runs under, make sure the queries hit pre-aggregated tables rather than raw events, and isolate customer-facing traffic from internal analytics on separate replicas. If it is not concurrency, check whether the query filters on a prefix of the sort key — if it does not, it is reading far more granules than you think.
What is the “too many parts” error and how do I prevent it?
Each insert creates a new part, and background merges combine parts into larger ones. When inserts outpace merges, the part count grows until the server throttles and then rejects inserts to protect itself. The usual causes are inserting one row at a time instead of in batches, and a partition key granular enough that each insert touches many partitions at once. Batch inserts in the application or enable asynchronous inserts so the server does the batching, partition by month rather than by day or by tenant, and alert on parts per table well before the threshold.
How do I guarantee a tenant never sees another tenant’s data?
Two layers, and use both. Structurally, tenant_id leads the sort key or primary key so per-tenant access is the natural access path rather than a filter someone might forget. Procedurally, the tenant identifier must never travel from the client to the query — it comes from the authenticated session on the server, or from a signed token that carries the filter, so that an endpoint added in a hurry cannot accept it as a parameter. Row-level security in Postgres and token-scoped queries in Tinybird are both ways of making the safe path the default one rather than a convention.
Do I need real-time, or is a one-minute delay fine?
Ask what the chart is for. Usage counters, trend lines, and monthly summaries are fine at minutes, and nearly all in-product analytics is one of those three. Live operational views — an active-calls counter, a session monitor, anything a customer watches during an incident — genuinely need seconds. The distinction is worth making per chart rather than per product, because a single real-time requirement will otherwise set the freshness budget for everything and you will pay for it in every part of the pipeline.
Should I run one analytics store for both customer dashboards and internal BI?
One store, two access paths. The data can live once; the workloads should not share compute. Internal exploration is unbounded by nature and customer-facing queries have a latency budget, so an analyst’s accidental cross join must not be able to slow the page a customer is paying for. Separate replicas, separate user profiles with their own memory and thread limits, and separate quotas.
Related reading
- Elasticsearch vs Loki vs ClickHouse for logs — the same ClickHouse storage model, evaluated for a workload where its lack of an inverted index is the deciding factor.
- Best vector databases — the other “do I need a second store” decision most SaaS teams face, with the same build-versus-buy shape.
- Best self-hosted observability stacks — what running your own data infrastructure actually costs in attention, which is the deciding input for ClickHouse versus a managed path.
- Best open source log management tools — collection, pipeline, and store treated as three separate decisions rather than one product choice.