Almost every “what should I use for open source log management” question is really three questions wearing one coat, and the reason the answers people get are unsatisfying is that they answer the wrong one.
There is a collection layer: an agent that runs where the logs are, tails files, reads the container runtime’s output, handles rotation and multiline stack traces, and checkpoints its position so a restart does not lose or duplicate lines. There is a pipeline layer: routing, parsing, redaction, sampling, enrichment, buffering and fan-out — the place where you decide what goes to the expensive index and what goes to cheap archive. And there is a store and query layer, which is where the architecture argument lives and which is what most people actually mean when they say “log stack.”
Conflating them produces bad advice in both directions. “Just use Loki” is not an answer to a collection question. “Use Fluent Bit” is not an answer to a storage question. And every tool on this page solves one or two of the three, so if you pick one and stop, the thing you did not pick is the gap you discover during your first incident.
The other reason these projects disappoint is more uncomfortable: the store is easy to install and hard to run. A single-node Elasticsearch or ClickHouse is up in ten minutes and looks like a solved problem. What you signed up for is retention policy, shard or partition management, upgrades of a stateful cluster, capacity planning that fails suddenly rather than gradually, and a person who answers the page when a disk fills at 3am. That person is the real price, and it is not on any pricing page because there isn’t one.
Key takeaways
- Collection, pipeline and store are three separate choices. Most “open source log stack” questions are store questions, and the store follows from your query pattern.
- Elasticsearch moved off Apache 2.0 to a dual SSPL and Elastic Licence model and has since added AGPL v3 as an option; OpenSearch is the Apache 2.0 fork that exists because of that change, now governed under the Linux Foundation. If you are writing a policy or shipping a product on top, that distinction is the whole decision.
- The licence bill goes away and the operations bill arrives. Disk-full behaviour, retention enforcement, rolling upgrades and on-call are what you actually bought.
- Quickwit joined Datadog, which is a real risk signal for anyone adopting it fresh today.
Layer one: collection is a correctness problem, not a throughput problem
The agent’s job sounds trivial and is not. It runs on every node, usually as a DaemonSet, and it has to get five things right before performance is even interesting.
File rotation and truncation. Logs get rotated under the agent’s feet. A collector that follows a path rather than an inode misses lines written between rotation and reopen; one that follows an inode and never notices the rename leaks file handles. Truncation — a file rewritten to zero length rather than rotated — has to be detected by a shrinking size, not by an event.
Checkpointing. The agent stores a per-file offset so that a restart resumes rather than replaying from the top or skipping ahead. Where that checkpoint lives matters: in a container, on an emptyDir that vanishes with the pod, you will re-send everything after every restart and wonder why volume spiked.
Multiline events. A Java stack trace is forty lines that are one event. Joined at collection, it is a single searchable record with the exception at the top. Not joined, it is forty records, your grep returns line nineteen with no context, and your error rate metric is inflated forty times. Multiline rules are configured per source and are the single most common thing teams get wrong.
Backpressure. The destination will be down. When it is, the agent’s in-memory buffer fills, and then one of two things happens: it drops, or it blocks. Blocking sounds correct until you realise that on some container runtimes a blocked log pipeline applies backpressure to the writing application, and your logging outage becomes a service outage. Disk buffering is the only honest answer, and it needs an actual disk budget on every node, sized against how long you expect the store to be unavailable.
Footprint. This thing runs on every node, competing with your workloads. A collector using a few hundred megabytes of RSS per node across a thousand nodes is a meaningful capacity decision, not a rounding error.
Needs first-hand data: Run each candidate collector on one node at your real peak line rate and record RSS and CPU at steady state. Then stop the destination for thirty minutes and record where data buffered, how much disk it consumed, and whether any lines were lost on recovery. Those two numbers decide the collector; feature lists do not.
Layer two: the pipeline is where cost and compliance get decided
The pipeline is optional in the sense that you can put all of this in the agent’s config. It stops being optional at the point where changing a routing rule means rolling a DaemonSet across a thousand nodes to fix a problem that started ten minutes ago.
What lives here:
Parsing. Turning a line into fields. If your services emit structured JSON this is nearly free; if they emit prose, somebody maintains regex that silently stops matching when a developer rewords a message. Parsing at the pipeline rather than the agent means one place to fix it and no fleet rollout.
Redaction. Card numbers, tokens, emails, anything with a regulatory footprint. This has to happen before the data crosses your trust boundary, which means before a managed destination and often before it leaves the node. Doing it vendor-side is convenient and defeats the purpose.
Sampling and dropping. Health checks, access logs for static assets, debug output from a chatty dependency. This is where most of the volume reduction actually comes from, and it is the difference between a store you can afford and one you cannot.
Enrichment. Adding Kubernetes metadata, geo lookups, service ownership, environment. Doing it once here beats doing it in every query.
Fan-out. One stream, several destinations: the reduced copy to the search index, the full-fidelity copy to object storage, a metric derived from the stream to Prometheus. This is also how you evaluate a new store without touching applications — point a second output at it and compare for a month.
Buffering. An aggregator tier gives you one place to absorb store downtime, with real disk, instead of relying on every node having spare capacity.
Three places the pipeline can live, and the choice is about who pays:
- In the agent. Simplest, fewest moving parts, and every change is a fleet rollout. Fine below a few dozen nodes.
- In an aggregator tier. A deployment of Vector, Fluentd or an OpenTelemetry Collector that agents forward to. Central config, real buffering, one place to change routing. Costs you a stateful tier to run and a network hop.
- Vendor-side. The destination parses and processes for you. Convenient, and the least portable thing in your stack — those rules do not come with you when you leave.
Layer three: the store, and why the query pattern picks it
The store is where the three architectures live, and the short version is that they differ in how much they index at write time.
An inverted index — Elasticsearch, OpenSearch, and Graylog on top of either — builds posting lists per term, so arbitrary full-text search across a month is fast and you pay for that at ingest in CPU and at rest in index size that regularly exceeds the raw data.
A label index with brute-force scan — Loki — indexes a handful of labels and keeps compressed bodies in object storage, so ingest and storage are cheap and query cost is proportional to the bytes scanned after the label selector narrows things down.
A columnar store — ClickHouse, VictoriaLogs, and the products built on ClickHouse — compresses columns and answers aggregations over huge spans quickly, at the cost of schema design up front and text search that is a scan or a bloom filter rather than an index lookup.
Pick by naming the query you run under pressure: unpredictable full-text search points at the inverted index, narrow Kubernetes label selection points at Loki, and aggregation across long retention points at columnar. The detailed version, including what each one does when a single query goes wrong, is in Elasticsearch vs Loki vs ClickHouse.
The licence question, stated accurately
This matters more than it looks, because the answer changes what you are allowed to build.
Elasticsearch and Kibana were Apache 2.0 and are not any more. Elastic moved them to a dual model of the Server Side Public License and the Elastic License, neither of which is approved by the Open Source Initiative. Elastic has since added AGPL v3 as an additional option for Elasticsearch, which is OSI-approved. AWS forked the last Apache-licensed release into OpenSearch, which remains Apache 2.0 and is now governed by a foundation under the Linux Foundation rather than by a single vendor. That fork is the entire reason OpenSearch exists, and pretending the two are interchangeable misses the point of the split.
Why the distinction has teeth:
- If your policy defines “open source” as OSI-approved, SSPL and the Elastic Licence do not qualify. That is a procurement and legal fact, not a philosophical one.
- If you offer the software as a service to third parties, SSPL’s condition is specifically aimed at you. Read it with a lawyer rather than a blog post.
- If you embed the store in a product you distribute, AGPL’s network-use clause and SSPL’s service clause both create obligations that Apache 2.0 does not.
- If you just run it internally for your own logs, in practice none of this constrains you, and the argument is louder than the consequence.
Grafana Labs made a comparable move: Loki, Grafana, Mimir and Tempo are AGPL v3 rather than Apache 2.0. AGPL is OSI-approved so it clears the “is it open source” bar, and it still triggers review if you plan to offer a modified version as a service. ClickHouse, Fluent Bit, Vector, VictoriaLogs, SigNoz and OpenObserve each sit somewhere on the Apache/AGPL spectrum, and the honest advice is to check the licence of the specific component you are deploying rather than the project’s general reputation — several of these projects have an open core with commercial components layered on top, and the boundary is where the features you actually want tend to live.
The store is easy to install and hard to run at 3am
Installing any of these is a container and a config file. Running one is a different job, and these are the parts that bite.
A full disk behaves differently in each, and none of them behave well. Elasticsearch has disk watermarks: cross the high one and shards stop being allocated, cross the flood-stage one and indices flip to read-only. Freeing disk does not automatically clear that block — you have to clear it yourself, which is exactly the kind of thing nobody knows at 3am. ClickHouse needs free space to merge parts, so a nearly full disk stops merges, and stopped merges make query performance and space usage worse, which is a feedback loop rather than a plateau. Loki puts bulk data in object storage, which does not fill, but the ingester’s write-ahead log disk very much does, and losing it loses whatever had not been flushed.
Retention is a job you own. Index lifecycle policies, a compactor, table TTLs — whatever the mechanism, it has to actually run, and it has to be verified. The failure mode is silent: retention quietly not enforcing, disk climbing for six weeks, and the discovery happening on the day it runs out.
Upgrades are rolling restarts of a stateful cluster. Index format compatibility, plugin compatibility, a coordinated version bump across ingesters and queriers, and a maintenance window during which query performance is degraded. Multiply by every component in the stack — for a full self-hosted setup that is a collector, an aggregator, a store, and a UI.
Backups exist, restores mostly do not. Ask what your actual recovery plan is for the log store. For most teams the honest answer is that you accept the gap, because restoring a large log cluster takes longer than the data stays relevant. That is a defensible decision. It is not defensible to discover it during the incident.
Capacity failures are sudden. Query latency on an under-provisioned store is fine, fine, fine, and then one expensive query pushes it over and everything queues. Unlike a web service, there is no gentle degradation curve to warn you.
Sum: budget an engineer’s meaningful fraction of time, permanently, for a self-hosted log stack at real volume. Below some volume that is obviously cheaper than a managed bill; above some volume it is obviously cheaper still. The trap is the middle, where you are paying a person to save less than the licence would have cost. Self-hosted observability stacks covers the same calculation across all three signals.
Needs first-hand data: In a staging cluster, fill the store’s disk to the point of failure and write down the exact recovery procedure, including any manual step needed to clear a read-only or blocked state. Time it. That runbook is worth more than any feature comparison, and you can only get it by breaking something on purpose.
syslog, RFC 5424 and the OpenTelemetry log data model: specifications, not products
None of these is something you install, and none of them stores or searches anything. They define the shape of a log record and how it travels, which is why every product below either speaks them or converts to them.
Syslog and RFC 5424. Syslog is the oldest common denominator in logging: a facility, a severity, a timestamp, a hostname and a message, sent over UDP or TCP. RFC 5424 is the modern specification that added a proper timestamp with timezone and offset, longer messages, and structured data elements. In practice you will meet both it and the older BSD-style format, because network gear, appliances and operating systems emit whatever they emit and no specification changes that.
The OpenTelemetry log data model. A richer record — body, severity number and text, timestamp, resource attributes, and trace and span IDs — shipped over OTLP alongside metrics and traces. The trace ID field is the part that earns its keep: it is what turns “show me the logs for this slow span” into a join rather than a text search.
What they give you
- A defined interchange format, so a device, an agent and a store built by three different vendors can agree on what a log record is
- Severity as a field rather than a string somebody parses out of the message, which is what makes level-based routing and alerting possible
- For OTLP specifically, one agent and one protocol for logs, metrics and traces, so changing store is a collector config change rather than a fleet rollout
- For OTLP specifically, a standard place for trace and span IDs, which is the mechanism behind log-to-trace correlation
What they do not do
- Store, index or search anything. You still choose, run and operate a backend
- Say anything about the message body’s structure. RFC 5424’s structured data element is rarely used, so in practice the body is still an unparsed string
- Migrate your existing formats. Ten years of custom log lines and grok patterns are converted by you, not by a specification
- Guarantee anything about delivery. Syslog over UDP drops silently under load, which is a design choice you inherit whenever a device is the source
Fluent Bit
Layer: collection, and light pipeline work. Fluent Bit is a small C-based collector built for running on every node: it tails files, reads container runtime logs and journald, handles rotation and multiline, applies filters and Kubernetes metadata enrichment, and forwards to a long list of destinations. It is a CNCF project and the most widely deployed log agent in Kubernetes, which means when something odd happens there is usually already an issue thread about it. You still need a store — this is the layer that gets logs off the node.
Pros
- Very low memory and CPU footprint, which is what matters for something running on every node in a large fleet
- Kubernetes metadata enrichment, multiline parsing and file-rotation handling are first-class rather than bolted on
- Wide output plugin list, so it feeds nearly any store on this page without a translation layer
- Disk buffering is available, which is the only correct answer to a destination being down
Cons
- It is a collector, not a store — on its own it manages nothing and searches nothing
- Complex parsing and routing logic in its config format gets unwieldy fast, and the config is not a programming language
- Plugins vary in maturity, and a less-used output can behave differently under backpressure than the popular ones
Best for: Kubernetes clusters that need a low-footprint per-node agent feeding any store, with enrichment and multiline handled at the edge.
Pricing: Open source under Apache 2.0 with no licence cost; commercial support and a managed control plane are available separately from the project’s sponsor.
Vector
Layer: collection and pipeline, with a genuine bias toward pipeline. Vector is Rust-based and can run as a per-node agent or as an aggregator tier, with a transform language for parsing, redacting, sampling, reshaping and routing, plus fan-out to multiple destinations from one stream. It is Vector by Datadog, which is worth naming plainly: it is Apache 2.0 and widely used with non-Datadog destinations, and its direction is nonetheless set by a vendor whose commercial interest is a destination you might not be sending to.
Pros
- A real transformation language rather than a plugin config, so parsing, redaction and conditional routing are expressible without a plugin for each case
- Runs as agent and as aggregator from the same binary, so you can start on the node and add a tier without changing tools
- Fan-out to multiple sinks makes evaluating a new store a config change rather than a project
- End-to-end acknowledgements and disk buffering give you a defensible answer on delivery guarantees
Cons
- Owned by Datadog, so the roadmap is set by a company selling a competing destination — a governance risk if you are betting a platform on it
- More resource-hungry than Fluent Bit at the agent position, which matters across a large node count
- The transform language is another thing to learn and another place to introduce a bug that silently drops data
Best for: Teams that want a real pipeline tier — redaction, sampling, fan-out to several stores — expressed in one place rather than scattered across agent configs.
Pricing: Open source under Apache 2.0 with no licence cost; the entire cost is the infrastructure and the engineers running the aggregator tier.
Elasticsearch
Layer: store and query. Elasticsearch is the reference inverted-index log store: an index per field, so arbitrary full-text search across a month of data is fast without you knowing the query in advance. That capability is the reason it remains the default answer when the search you need is the one you did not plan for, and its costs — index size, mapping design, shard sizing, JVM heap — are the reason people look for alternatives.
Pros
- Fast arbitrary full-text search with no schema-shaped restrictions on what you can ask
- The largest ecosystem in this category: Kibana, ingest pipelines, alerting, anomaly detection, and integrations for almost any source
- Enormous body of operational knowledge available, so most production problems have a documented answer
Cons
- Index plus document routinely exceeds the size of the raw logs, making it the most expensive of the three architectures at long retention
- Mapping explosions from dynamic JSON fields are a genuine production incident, not a theoretical concern
- Shard sizing and JVM heap pressure are permanent operational subjects, and getting them wrong degrades the whole cluster rather than one query
- Dual SSPL and Elastic Licence — with AGPL v3 added as an option — rather than Apache 2.0, which is a blocker for some policies
Best for: Teams whose defining query is unpredictable full-text search and who have or can hire real cluster operations expertise.
Pricing: No licence cost for the freely available distribution under its own licences; self-hosting costs infrastructure and operator time, with paid tiers gating some security and machine-learning features.
OpenSearch
Layer: store and query. OpenSearch is the Apache 2.0 fork of Elasticsearch created after the licence change, with OpenSearch Dashboards in place of Kibana and its own security, alerting and anomaly-detection plugins included rather than tiered. Governance now sits with a foundation under the Linux Foundation rather than with one company. For anyone whose blocker is the licence, this is the same architecture without the argument.
Pros
- Apache 2.0 throughout, which resolves the policy question and the embed-in-a-product question at once
- Security, alerting and anomaly detection are in the box rather than behind a commercial tier
- Foundation governance reduces single-vendor risk relative to any open-core project here
- Available as a managed service from major cloud providers, so the operations can be outsourced without changing the architecture
Cons
- Every operational burden of Elasticsearch is unchanged: shards, mappings, heap, disk watermarks
- Storage economics are the inverted-index ones, so it does not solve a cost-at-volume problem
- Feature drift from Elasticsearch is real and growing; newer Elastic capabilities do not arrive here, and porting knowledge between them gets less reliable over time
Best for: Teams that need the Elasticsearch architecture with an OSI-approved licence and foundation governance.
Pricing: No licence cost; self-hosted you pay infrastructure and operator time, and cloud-provider managed versions bill by instance and storage.
Grafana Loki
Layer: store and query. Loki indexes labels and nothing else, batching compressed log bodies into chunks in object storage and scanning them at query time. In Kubernetes the labels you would select on already exist and are already consistent, which is why the design fits so naturally there. Ingest and storage cost drop sharply against an indexed store; query cost becomes a function of how narrow your label selector is.
Pros
- Cheapest ingest and storage here, because there is almost no index to build and bulk data lives in object storage
- Object storage as the durability layer removes most of the disk-full failure mode that defines the other stores
- LogQL shares syntax with PromQL, and Grafana puts logs beside metrics and traces without an integration project
- Horizontal scaling of read and write paths is independent, so a heavy query load does not have to be sized alongside ingest
Cons
- A broad filter across a wide label selector is a distributed grep, and it will cost you either wall-clock time or a lot of query workers
- Label cardinality is a hard constraint — a request ID or user ID in a label takes the cluster down rather than merely slowing it
- The microservices deployment mode is genuinely complex: ingesters, distributors, queriers, query frontend and compactor each with their own scaling behaviour
- Weak at aggregation over long windows compared with any columnar store
Best for: Kubernetes teams already running Prometheus and Grafana whose queries reliably start with a narrow label selector.
Pricing: AGPL v3 with no licence cost; the running cost is object storage plus compute, which is the lowest of the stores here at equivalent retention.
ClickHouse
Layer: store and query. ClickHouse is a columnar analytical database rather than a log product, and a growing share of log tools are ClickHouse with a UI on top. Used directly it gives you the best compression and the best aggregation performance in this article, plus SQL that your data people already write. What you take on is schema design and the fact that free-text search over message bodies is a scan or a token bloom filter, not an inverted index.
Pros
- Column compression on repetitive log fields makes long retention genuinely affordable, which is the single biggest cost lever available
- Aggregations across a month of data run fast enough to be interactive, which is where inverted indexes and label stores both struggle
- Plain SQL removes the query-language bottleneck and lets logs be joined against business tables
- Your data in an open format on your storage, with several independent products able to read it
Cons
- You design the schema, sort key and TTLs, and a bad sort key is expensive to fix once the table is large
- No UI, no alerting, no parsing and no access model out of the box — those are the products built on top, not the database
- A full disk stops merges, and stopped merges degrade both query speed and space usage, so the failure compounds
- Heavy free-text grep workloads are the wrong shape for it, however good the aggregation story is
Best for: Teams with SQL fluency and long retention requirements whose dominant queries are aggregation and filtered lookup rather than open-ended text search.
Pricing: Apache 2.0 with no licence cost self-hosted; the cost is infrastructure plus the engineering time to design and maintain the schema.
Graylog
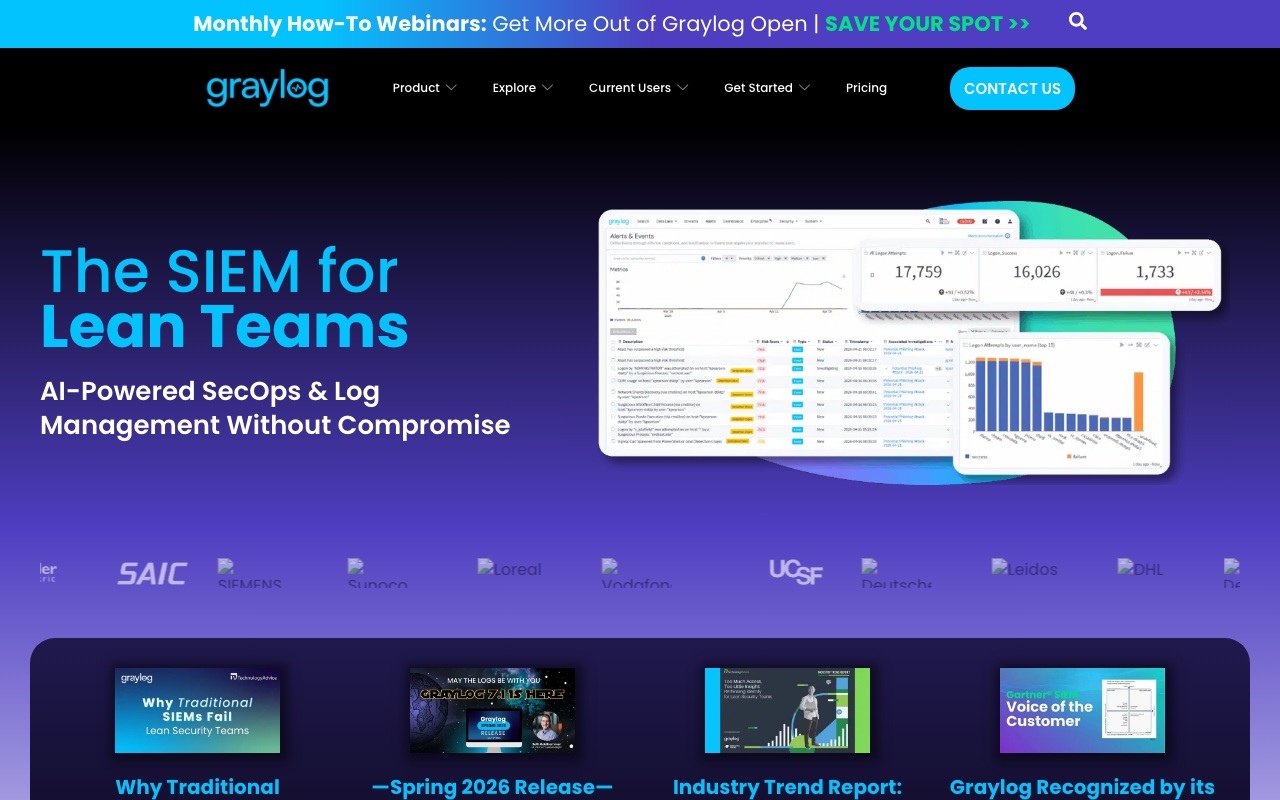
Layer: store, query and pipeline, on top of someone else’s search engine. Graylog runs on Elasticsearch or OpenSearch and adds what raw search engines lack: stream routing, parsing rules, dashboards, alerting, user management and access control, all managed through a UI. That combination makes it the most complete out-of-the-box open source log product here, and it is a common destination for teams leaving Splunk who need SIEM-adjacent capability on their own hardware.
Pros
- The most product-like option on this page: parsing, routing, RBAC and alerting exist without you assembling them
- Pipeline rules are configured in a UI, so log processing is manageable by people who do not maintain collector configs
- Inverted-index search quality, because the search engine underneath is Elasticsearch or OpenSearch
- A security edition exists, so the SIEM use case is not abandoned when you move off a commercial tool
Cons
- You still own the underlying search cluster, so every shard, mapping and heap problem is still yours plus a second system to operate
- Archiving, correlation and audit features sit in the paid editions, so the free version is not what you should compare against a commercial product
- Paid editions are licensed by daily ingest volume, the same meter shape people usually come here to escape
- Storage economics are inverted-index economics, so this is not the answer to a volume-cost problem
Best for: Teams that want indexed search plus real parsing, RBAC and alerting on their own infrastructure without building the product themselves.
Pricing: Free open source edition, with paid operations and security editions licensed by daily ingest volume.
VictoriaLogs
Layer: store and query. VictoriaLogs comes from the VictoriaMetrics project and applies the same design philosophy to logs: a single binary, low resource use, no external dependencies, and a query language built for filtering and aggregating rather than for full-text search across everything. It sits architecturally between Loki and a columnar store — it indexes more than Loki does, without paying inverted-index costs — and it is the easiest thing here to actually operate.
Pros
- Single binary with no external dependencies, which is a genuine reduction in operational surface against every clustered option here
- Low memory and disk usage relative to the inverted-index stores at comparable retention
- Handles high-cardinality fields far better than Loki’s label model, removing the most common self-inflicted outage in that architecture
- Natural fit if you already run VictoriaMetrics, since operations and mental model carry over
Cons
- Smaller ecosystem and community than Loki or Elasticsearch, so fewer integrations and fewer people who have hit your problem
- Its query language is another one to learn, and it is neither SQL nor PromQL-shaped
- Younger as a log product than the alternatives, so long-retention and large-scale operational experience in public is thinner
- No SIEM or compliance features, and no ambition to have them
Best for: Teams that want a low-effort, low-resource self-hosted log store, especially those already running VictoriaMetrics for metrics.
Pricing: Open source with no licence cost, plus a paid enterprise build; the running cost is a small amount of infrastructure relative to the clustered alternatives.
OpenObserve
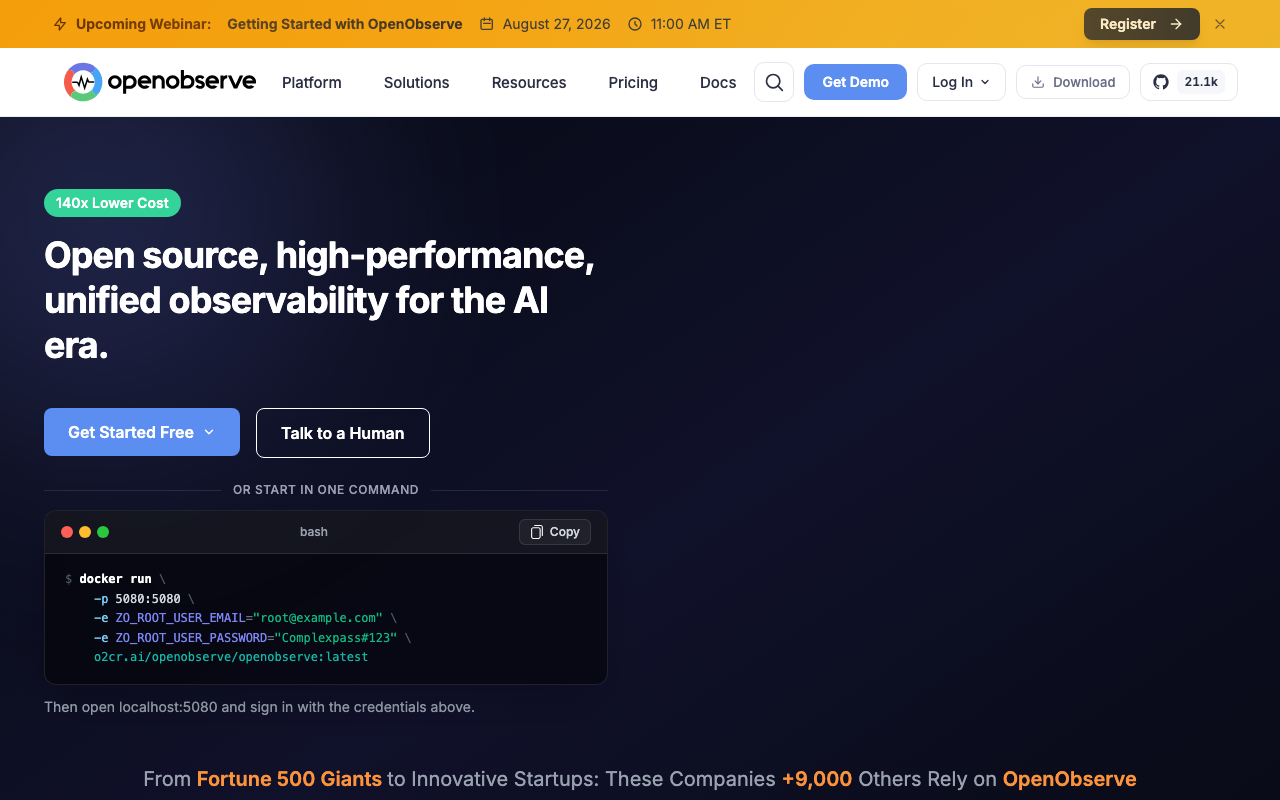
Layer: store, query and UI, across all three signals. OpenObserve is a Rust-based observability platform that stores logs, metrics and traces in a columnar format on object storage, with its own UI, dashboards and alerting. The pitch is a single lightweight component replacing an assembled stack, with storage cost pushed onto S3-compatible object storage rather than local disks.
Pros
- Object storage as the primary tier, which decouples retention cost from cluster sizing
- Logs, metrics and traces plus a UI and alerting in one deployment, rather than four components to integrate
- Accepts OTLP, so instrumentation stays portable and switching later is a collector change
- Substantially simpler to deploy than an Elasticsearch or Loki microservices setup
Cons
- Younger project with a smaller community, so unusual problems are yours to solve
- Doing all three signals in one product means none of them is as deep as the specialist in that category
- Query performance over object storage is a different profile from local disk, and heavy interactive querying feels it
- Some capabilities sit in a commercial edition, so check the boundary against the features you need
Best for: Small platform teams that want logs, metrics and traces self-hosted with the fewest moving parts and object-storage economics.
Pricing: Open source with no licence cost self-hosted plus a commercial edition and a managed cloud; self-hosted cost is object storage plus modest compute.
SigNoz
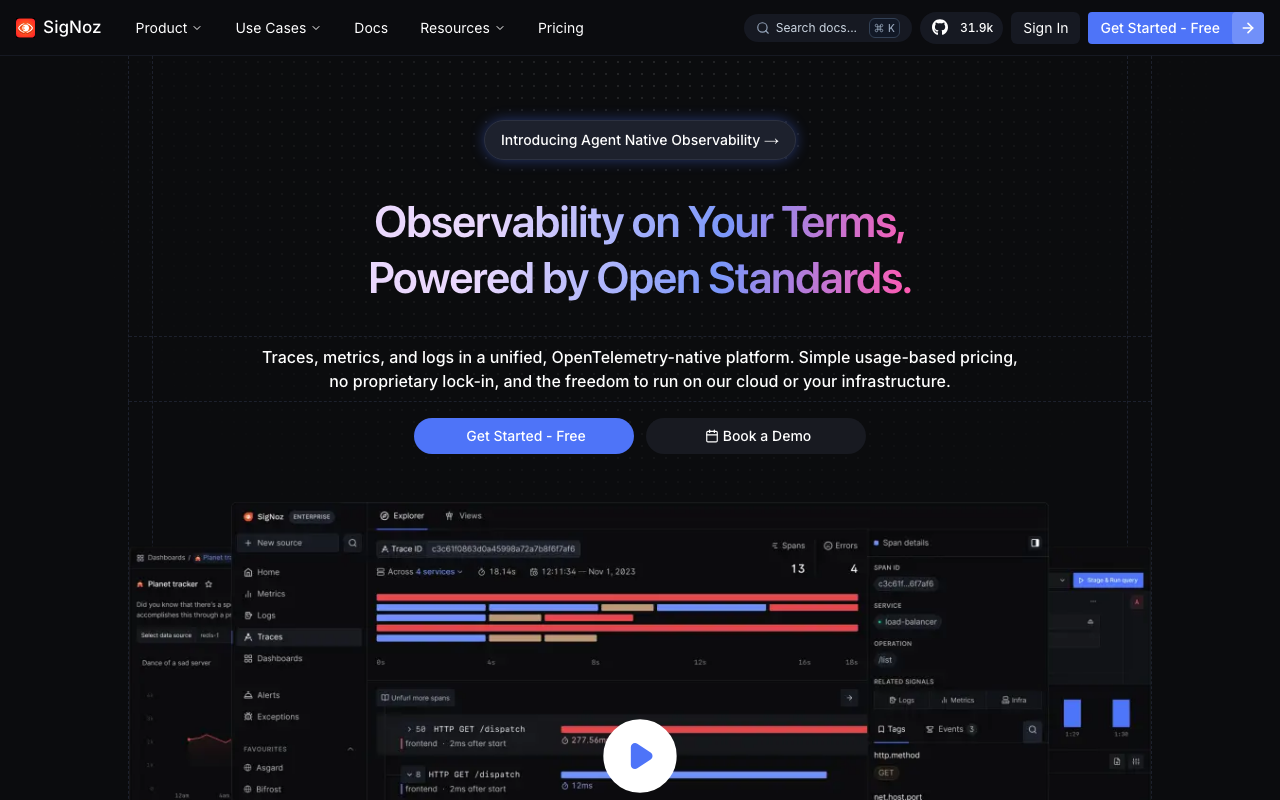
Layer: store, query and UI, OpenTelemetry-native. SigNoz takes OTLP directly into ClickHouse and presents logs, metrics and traces in one interface, so trace-to-log correlation is a join on trace ID rather than an integration you build. For a team that has already committed to OpenTelemetry instrumentation, it is the shortest route from “we emit OTLP” to “we can query all three signals” without adopting a vendor agent.
Pros
- Single ClickHouse-backed store for all three signals makes correlation structural rather than bolted on
- Nothing proprietary in your instrumentation, so moving to another OTLP backend later costs nothing in application code
- ClickHouse underneath means high-cardinality attributes stay affordable, which is where label-based stores fail
- Self-hostable in full, so there is no ingest meter and no data-egress conversation
Cons
- You are operating ClickHouse, and at volume that is real work regardless of how the UI presents it
- Log-specific features — parsing rules, archive tiering, compliance reporting — are thinner than the dedicated log products
- Smaller ecosystem, so non-OTLP sources need collector configuration you write
- Some features are reserved for the commercial edition, so verify the split before planning around them
Best for: Teams already emitting OTLP who want one self-hostable store for logs, metrics and traces without a vendor agent.
Pricing: Open source and free to self-host at infrastructure cost, with a managed cloud metered on ingested data and retention.
Quickwit
Layer: store and query. Quickwit is a search engine built for logs and traces on object storage: a full-text index that lives in S3-compatible storage rather than on local disks, which was a genuinely interesting answer to the “inverted indexes are too expensive at retention” problem. Quickwit joined Datadog, and that is the most important thing to know before adopting it now — the project continues to exist, but a search company being absorbed by a commercial observability vendor is exactly the pattern that ends in a component you are running with a roadmap nobody is driving toward your use case.
Pros
- Full-text search with the index itself on object storage, which is a materially cheaper shape than a local-disk inverted index
- Decoupled compute and storage, so search capacity scales independently of retained volume
- Designed specifically for append-only log and trace workloads rather than adapted from a general search engine
Cons
- Joining Datadog is a real adoption risk for a project you would be putting in a critical path today
- Search over object storage has higher latency floors than a local index, which shows up in interactive querying
- Smaller ecosystem and fewer integrations than the established stores, with less operational experience published
Best for: Teams that specifically want full-text search economics on object storage and are willing to take the ownership risk knowingly.
Pricing: Open source with no licence cost; the running cost is object storage plus search compute, which is its main structural argument.
How to choose
Work through the three layers in order rather than shopping for one tool.
Collection. Fluent Bit if footprint per node is the constraint, which it usually is in Kubernetes. Vector if you want the pipeline logic and the agent to be the same tool. The OpenTelemetry Collector if you are already standardising on OTLP for traces and metrics and want one agent for everything.
Pipeline. Skip the dedicated tier below a few dozen nodes and put the logic in the agent. Add an aggregator when routing changes start requiring fleet rollouts, when redaction has to happen in one auditable place, or when you need somewhere with real disk to buffer store downtime.
Store. Follow the query you run under pressure, not the one in the demo. Then apply two filters: your licence policy, and whether you can staff the operations. If the answer to the second is no, a managed version of the same architecture is not a defeat — it is the same architecture without the pager.
| Tool | Layer | Architecture | Picks itself when |
|---|---|---|---|
| Fluent Bit | Collection | — | Per-node footprint is the constraint |
| Vector | Collection + pipeline | — | You want routing, redaction and fan-out in one place |
| Elasticsearch | Store | Inverted index | Arbitrary full-text search is the defining query |
| OpenSearch | Store | Inverted index | Same, but Apache 2.0 is required |
| Graylog | Store + pipeline + UI | Inverted index | You want a finished product, self-hosted |
| Grafana Loki | Store | Label index + scan | Kubernetes, narrow selectors, lowest storage cost |
| ClickHouse | Store | Columnar SQL | Long retention, aggregation-heavy, SQL skills exist |
| VictoriaLogs | Store | Columnar-leaning | You want the least operational surface |
| OpenObserve | Store + UI | Columnar on object storage | All three signals, fewest components |
| SigNoz | Store + UI | Columnar SQL, OTLP-native | Already committed to OpenTelemetry |
| Quickwit | Store | Inverted index on object storage | Full-text search economics matter and you accept the ownership risk |
| syslog / RFC 5424 (spec, not a product) | Interchange format | — | Never a choice; it is what devices emit |
| OpenTelemetry logs (spec, not a product) | Interchange format | — | Never a choice; it is what your agents should speak |
Needs first-hand data: Load one week of your real production logs into two candidate stores at the same retention and record on-disk bytes after compression in each, then run a request-ID lookup, a 30-day aggregation and a free-text search across everything, and record wall-clock time for all three. Those six numbers make the decision; nothing on a project homepage does.
Frequently asked questions
Is open source log management actually cheaper than a managed tool?
Cheaper in licence, not automatically cheaper in total. You remove the ingest meter and take on capacity planning, upgrades, retention enforcement and someone answering a page when a disk fills. That trade is clearly worth it at high volume and clearly not worth it at low volume; the losing case is the middle, where an engineer’s time costs more than the licence you avoided. Work out your volume and your engineer cost before assuming the answer.
Do I need both Fluent Bit and Vector?
Not usually. Both can collect and both can transform, so running both means running two agents to do one job. The pattern that does make sense is Fluent Bit as the per-node agent, chosen for its small footprint, forwarding to a Vector aggregator tier where the parsing, redaction, sampling and fan-out live. That splits the two on their actual strengths rather than duplicating them.
What is the difference between Elasticsearch and OpenSearch in practice?
Architecturally they are the same design, forked from the same code, so search behaviour, shard management and operational failure modes are nearly identical. The differences that matter are licence — Apache 2.0 for OpenSearch versus SSPL, the Elastic Licence and now AGPL for Elasticsearch — governance, and growing feature drift, since newer Elastic capabilities do not appear in OpenSearch and vice versa. If your blocker is licence policy, that alone decides it.
Can I run an open source log stack without Kubernetes?
Yes, and it is easier. Most of the operational complexity in these stacks — Loki’s microservices mode, DaemonSet collectors, per-pod metadata enrichment — is Kubernetes-shaped. On virtual machines, a single-binary store like VictoriaLogs, or ClickHouse with a straightforward schema, plus an agent per host, is a genuinely small system to run. The Kubernetes-specific version of this problem is where the complexity comes from.
Which open source store handles high cardinality best?
ClickHouse and the products built on it, because columnar storage does not care how many distinct values a column has — it compresses them and scans them. Loki is the worst at it by design, since each unique label combination is a separate stream with its own lifecycle. Elasticsearch sits in between: high-cardinality fields are searchable but drive index size, and dynamic mapping on unbounded field names is its own failure mode. VictoriaLogs was built specifically to handle high-cardinality fields better than Loki’s label model.
Related reading
- Best log management tools — the full category including managed options and what the ingest meter buys you.
- Elasticsearch vs Loki vs ClickHouse — the three storage architectures compared in depth.
- Splunk alternatives — the migration path most teams arrive here from, and what it actually costs.
- Best self-hosted observability stacks — the same operational calculation across metrics, logs and traces.
- Best log management for Kubernetes — per-node collection, pod metadata and ephemeral containers.
- Best OpenTelemetry-native observability platforms — where to send OTLP once your collectors speak it.