The first time Kubernetes eats your logs, it does it quietly. A pod crashlooped through the night, you open the log search at 9am, and the window you need has forty lines where there should be four thousand. Nothing errored. No agent alerted. The lines were written, and then they were gone.
That is not a bug in your log tool. It is the mechanism. In Kubernetes the log file is a buffer on a node with a fixed size, owned by the kubelet, and it gets truncated on a schedule that has nothing to do with whether anyone has read it yet. There is no queue, no acknowledgement, and no replay. If your agent was behind during the burst, those lines do not exist anywhere.
Everything else that makes Kubernetes logging hard follows from the same place. A crashlooping container’s logs are the ones you need most and the ones most likely to be deleted, because the container is deleted. A Java stack trace arrives as forty separate log entries because the runtime splits on newlines. And a log line saying connection refused is worthless until something attaches the pod’s labels to it, which means every agent on every node is asking the API server questions all day.
So the choice here is two choices, and teams routinely make only one of them. You pick an agent — the thing that reads files off the node, parses them, buffers them and enriches them — and you pick a destination — the thing that stores and queries them. Installing only one of those gets you half a system.
Key takeaways
- The container runtime writes stdout to a file on the node and the kubelet rotates that file on size. An agent that falls behind during a burst loses lines permanently — there is no replay.
- A crashlooping pod is the worst case:
kubectl logs --previousreaches back exactly one container instance, and when the pod object is deleted the node’s log files go with it.- Multi-line stack traces arrive as one log entry per newline unless the agent is configured to reassemble them, and that configuration is per language and per format.
- Pod labels are what make a log line meaningful, so every agent talks to the API server — and every label you promote to an index is cardinality somewhere downstream.
How a log line actually leaves a pod
Follow one line and every design decision downstream makes sense.
Your process writes to stdout. The container runtime — containerd or CRI-O — captures that stream and appends it to a file on the node, under /var/log/pods/<namespace>_<pod>_<uid>/<container>/0.log. The CRI log format is one line per entry: an RFC 3339 nanosecond timestamp, the stream name (stdout or stderr), a F or P tag, then your message. /var/log/containers/ holds symlinks into that tree, which is what most agent configs actually tail.
That F/P tag is the first thing that bites. F means full line, P means partial: the runtime splits any single log line above roughly 16KB into several entries. If your agent does not understand the CRI format and rejoin the P fragments, one large JSON log becomes several broken pieces, none of which parse.
The kubelet rotates that file by size — --container-log-max-size and --container-log-max-files control it, and the defaults are small enough that a chatty pod cycles through them in minutes. Rotation is unconditional. It does not check whether an agent has read to the end. This is the loss mechanism: during a burst, the write rate into the file exceeds the agent’s read-and-ship rate, the kubelet rotates past the agent’s read position, and the lines in between are unrecoverable. The agent will not report an error, because from its perspective the file simply moved.
The docker json-file driver era had pluggable logging drivers, so you could hand the stream straight to a collector and skip the file. Under containerd that option is effectively gone — the file on the node is the interface. Design for it rather than around it.
Then the pod dies. kubectl logs --previous reads the one prior container instance the kubelet kept, which is why it works for a single crash and not for a pod that has restarted nine times. When the pod object is deleted, the kubelet garbage-collects the directory. Everything not already shipped is gone.
Needs first-hand data: Run a pod that writes a known, numbered sequence at increasing rates — 1k, 10k, 50k lines per second — and count how many of those sequence numbers reach your backend at each rate. The rate at which the count first goes short is your real ingest ceiling on that node, and it is usually far below what the agent’s docs imply.
DaemonSet, sidecar, or neither
A DaemonSet agent is the default and the right default. One pod per node tails every container’s log files, so a new workload is collected the moment it schedules and nobody has to remember anything. It needs a hostPath mount of /var/log, a ServiceAccount that can read pods, and a resource limit you will end up tuning. Its weakness is that one agent shares its buffer across every noisy neighbour on the node — one pod logging a stack trace loop can starve the others.
A sidecar per pod gives that pod its own agent, its own buffer, and its own parser config, which is genuinely useful for one workload with an unusual format or a compliance requirement to route its logs somewhere separate. The cost is one extra container’s memory and CPU multiplied by your replica count, plus a second copy of the log data inside the pod. Use it as an exception, not a strategy.
Writing to a file inside the container instead of stdout shows up in older apps and is worth naming as a trap: nothing collects it, the file fills the container’s writable layer, and the pod eventually gets evicted for ephemeral storage pressure. Either symlink it to stdout or accept a sidecar. Do not leave it.
Buffering and backpressure: where the data actually goes missing
The interesting failure is not “the backend was down.” It is what your agent did while the backend was down.
Every agent has a buffer between the tail and the output. When the output stalls — the backend is throttling, a network partition, an expired token — that buffer fills. What happens next is a configuration choice you made, probably by accepting a default:
- Memory buffering with a size limit. When the limit is hit, the agent pauses the input. It stops reading files. The kubelet keeps rotating. You lose data on the node, silently, and the agent logs a “paused” warning nobody has an alert on.
- Filesystem buffering. Chunks spill to disk on the node, so the agent keeps reading during an outage. Now the constraint is node disk: the buffer directory grows, and if it grows past the eviction threshold the kubelet starts evicting pods for disk pressure. You have converted a logging outage into a workload outage. Cap the total buffer size explicitly and put the buffer on a volume with known headroom.
- Retry with backoff, and a limit on retries. After the limit, chunks are dropped. Whether that drop is counted and exported as a metric is the difference between knowing and not knowing.
The single most useful thing you can do here is alert on the agent’s own metrics — retry counts, dropped-record counts, buffer bytes, and the tail plugin’s file position lag — rather than on whether logs “look normal” in the UI. Gaps in a log store are invisible by construction.
Needs first-hand data: Block egress to your backend for fifteen minutes at your normal log volume and record three things: how long node-local buffering lasted before the first drop, the peak buffer size on disk, and whether any dropped-record counter moved. Do this before you need it.
Multi-line, parsing, and the metadata problem
Multi-line reassembly is per format and there is no universal setting. Because the runtime writes one entry per newline, a 40-frame Java stack trace becomes 40 log entries with 40 timestamps, and the one carrying the exception class is separated from the one carrying your request ID. Agents solve this with a concat step: match a start pattern, append following lines that match a continuation pattern, flush on timeout. Two details ruin this in practice — the CRI parse has to run before the multi-line concat, because the concat needs the message field and not the raw CRI line; and the flush timeout means a trace written slowly gets split anyway. A pod running Java, Python and Go behind one DaemonSet needs three rule sets, keyed off a namespace or a pod annotation.
The cheapest escape is structured logging. If the application emits one JSON object per line with the stack trace as a string field, the whole problem disappears. That is an application change, and it is worth more than any agent tuning.
Metadata enrichment is what makes a log line mean anything, and it is not free. The raw line has a filename. The Kubernetes filter turns that into namespace, pod, container, image, labels and annotations by asking the API server. Every agent, on every node, for every new pod. On a large cluster that is real API server load, which is why agents offer a local-kubelet lookup mode instead — same data, no central hot spot — and a cache TTL you should raise rather than lower.
Then comes the part that shows up on the invoice. Every label you attach becomes a dimension downstream. In a label-indexed store like Loki, each distinct combination of labels is a separate stream, so promoting pod to a label on a Deployment that churns pods creates a new stream per pod and the index grows without bound. In a document store like Elasticsearch or OpenSearch, arbitrary annotation keys become new mapping fields and you get mapping explosion instead. The rule that holds in both: index the small, stable set you filter on — namespace, app, container, level — and keep everything else in the log body where it costs nothing until you search it.
Control-plane and audit logs are a different product
Application logs and cluster logs answer different questions, are read by different people, and should usually not share a retention policy.
The kube-apiserver audit log records every API request: who, what verb, which resource, what the response was. It is governed by an audit policy file that you control on a self-managed control plane, and that you mostly do not control on EKS, GKE or AKS — there, the control-plane and audit streams are turned on as a cloud provider feature and delivered into that provider’s own log service, which means they land in a different place from your application logs by default.
Three things follow. Audit volume is enormous if the policy is set to RequestResponse at the Metadata level for everything, so the policy is a cost control as much as a security control. Retention is usually driven by a compliance requirement measured in months or years, while application log retention is driven by debugging and measured in days — paying the audit retention rate for application logs is a common and avoidable mistake. And the consumer is security, not the on-call engineer, so routing audit events to the same hot search index as payments-api buys nothing.
Route them separately from the start. Cheap object storage with a long retention for audit; short, hot, expensive retention for application logs.
Cost control happens at the agent, not the backend
Every managed log backend prices on data in, data stored, or both. That means the only place a dropped line saves you money is before it leaves the node. Filtering in the backend’s UI is filtering after you paid.
The list of things worth dropping at the agent is remarkably consistent across clusters: kubelet health probe and readiness check lines, access-log entries for /healthz, sidecar proxy connection chatter, DEBUG from a service somebody left turned up, and duplicated request logs where both the ingress and the application log the same request. Sampling helps for high-volume success paths — keep one in a hundred 200 OK lines and all of the non-2xx ones — and it is safe precisely because the interesting lines are the rare ones.
Two guardrails. Keep the drop rules in version control next to the agent config, because an undocumented drop rule is a future incident where the log you need was never collected. And route rather than delete where you can: send the full stream to cheap object storage and only the filtered stream to the expensive index, so a dropped line is still recoverable slowly.
Fluent Bit
Fluent Bit is the collection agent, not a destination — it tails the node’s log files, parses CRI format, reassembles multi-line traces, enriches with Kubernetes metadata and forwards to something else. Written in C with a small memory footprint, it is what most managed vendors ship inside their own Helm chart under a different name. If you run it yourself, you own the buffering configuration, which is the part that decides whether you lose data.
Pros
- Small enough to run as a DaemonSet on every node without arguing about resource requests
- Built-in
criparser and named multi-line parsers for common runtimes, so Java and Go traces reassemble without hand-written regex - Kubernetes filter can read pod metadata from the local kubelet instead of the API server, removing a central hot spot on large clusters
- Filesystem buffering with explicit chunk and total-size limits, so backpressure behaviour is a decision rather than an accident
Cons
- Stores and queries nothing — pairing it with a backend is the other half of the project
- Configuration is a pipeline of parsers, filters and ordering rules, and getting the CRI parse before the multi-line concat wrong produces silently broken traces
- Defaults are memory-buffered, which means the default behaviour under backpressure is to pause the input and let the kubelet rotate your data away
Best for: Teams who want one lightweight agent on every node feeding a backend they chose separately, and who will actually tune the buffer settings.
Pricing: Open source with no licence cost; the cost is node resources plus the engineering time in the pipeline configuration.
Vector
Vector is “Vector by Datadog” — an agent and aggregator written in Rust with a transform language, VRL, that lets you reshape, redact and drop events in the pipeline. It runs as a node agent like Fluent Bit, and also as a central aggregator tier that several agents feed, which is where the routing and cost work usually happens. Being owned by an observability vendor while remaining genuinely useful for sending data anywhere is a tension worth knowing about, not a disqualification.
Pros
- VRL makes drop, sample and redact rules explicit, testable code rather than a stack of regex filters
- Fan-out to several destinations from one pipeline, so cheap archive plus expensive index is a config change
- Disk buffering per sink, so a slow backend does not stall the others
- Aggregator mode gives you one place to enforce cost rules instead of editing every node’s config
Cons
- Owned by Datadog, so the long-term incentive to make shipping data elsewhere pleasant is not aligned with yours
- The aggregator tier is another stateful service to size, scale and page someone about
- Kubernetes metadata enrichment and multi-line handling need more explicit configuration than Fluent Bit’s named parsers
Best for: Teams doing real work in the pipeline — redaction, routing to multiple destinations, or cutting ingest volume before it is billed.
Pricing: Open source with no licence cost; infrastructure and operator time for the aggregator tier are the real bill.
Grafana Loki
Loki is a destination that indexes labels and not log content. Log lines are compressed into chunks in object storage, and queries find the right chunks by label selector then brute-force scan them. That makes ingest cheap and storage cheap, and it makes the label set the single most important design decision you will make — a well-chosen one gives fast queries, a high-cardinality one gives an unusable index. It pairs naturally with Prometheus because the label model is the same, so a metric alert and a log query use the same selector.
Pros
- Storage cost is object storage cost, which is the cheapest economics in this list at high volume
- Same label model as Prometheus, so
{namespace="payments", app="api"}works identically in both - No mapping explosion risk from arbitrary annotation keys, because content is not indexed
- Self-hostable end to end, with a managed cloud option if you do not want to run it
Cons
- A high-cardinality label — pod name, request ID, user ID — creates a stream per value and degrades the index badly, and it is easy to do by accident with a Kubernetes metadata filter
- Full-text search across a wide time range is a scan, so unselective queries are slow in a way an inverted index is not
- Running it properly means running several components plus object storage, not a single binary
Best for: Prometheus-native teams who query logs by pod and namespace far more often than by free-text search, and who care most about storage cost.
Pricing: Open source at infrastructure cost; the managed cloud meters ingested volume and retention separately from metrics.
Elastic
Elasticsearch is the opposite bet from Loki: index everything, and get fast arbitrary search over log content in return. For Kubernetes it ships an integrated agent and a well-defined schema, so the pod metadata lands in consistent field names across every source. That schema discipline is genuinely valuable at scale and it is also the constraint — arbitrary annotation keys turned into fields cause mapping growth, and index lifecycle management becomes a thing you administer.
Pros
- Real full-text search with fast aggregations over arbitrary fields, which no label-indexed store matches
- A consistent field schema means a query written against one service’s logs works against another’s
- Index lifecycle management moves old indices to cheaper tiers on a policy rather than by hand
- Mature ecosystem: this is the log store most engineers have already used
Cons
- Indexing everything costs storage and CPU, and log volume grows faster than anyone plans for
- Mapping explosion from unbounded Kubernetes annotation keys is a real operational incident, not a theoretical one
- Self-hosting a cluster at log scale is a specialist job — shard sizing, hot-warm tiers, JVM heap
- Licensing changes over the years are why an OpenSearch column exists in every comparison
Best for: Teams whose primary log workflow is free-text search and aggregation across fields, with someone who can own the cluster.
Pricing: Managed cloud priced on provisioned resources and storage tiers rather than raw ingest; the self-managed distribution is free of licence cost under its source-available terms.
OpenSearch
OpenSearch is the Apache 2.0 fork of Elasticsearch, governed outside a single vendor, and it is the answer for teams whose objection to Elastic was the licence rather than the architecture. The query behaviour, the sharding model and the operational demands are close enough that everything in the Elastic section applies; the differences are in the ecosystem around it — dashboards, plugins, and which cloud provider offers a managed version you can buy.
Pros
- Apache 2.0 with multi-vendor governance, which removes the licence question from procurement entirely
- Managed offerings from major cloud providers, so you can buy it without a new vendor relationship
- Architecturally close enough to Elasticsearch that existing query and dashboard knowledge transfers
- Same index lifecycle tiering for moving old log indices to cheap storage
Cons
- Inherits the same operational weight: shard sizing, JVM tuning and mapping discipline are still your job
- Feature parity with Elastic’s commercial tiers drifts, particularly in machine learning and newer search features
- Ecosystem tooling and vendor integrations still assume Elasticsearch first
Best for: Teams who want document-indexed log search on a permissive licence, or who are already buying it as a managed cloud service.
Pricing: Free of licence cost when self-managed; managed cloud versions are priced on provisioned node hours and storage.
ClickHouse
ClickHouse is a columnar analytical database that has become a serious log store because column compression on repetitive log fields is extraordinary and scans across billions of rows are fast without a per-document index. It is a destination with no opinion about Kubernetes — you point Vector or Fluent Bit at it and design the table yourself. That freedom is the trade: you get the best storage economics for structured logs on this list, and you get to own the schema, the partitioning and the TTLs.
Pros
- Column compression on repetitive Kubernetes fields — namespace, container, level — is dramatic, so retention gets cheap
- SQL over logs means joins and aggregations that are awkward or impossible in a log-specific query language
- Materialised views can pre-aggregate a log stream into metrics without a separate pipeline
- Increasingly the storage engine underneath other log products, so the bet is not exotic
Cons
- No log UI of its own — you bring a frontend or use a product built on top of it
- Schema, partitioning and TTL design are yours, and a bad partition key on log data is painful to fix later
- Unstructured free-text search is weaker than an inverted index unless you build for it deliberately
- Operating a cluster with replication and merges is real database work
Best for: Teams with structured JSON logs and high volume who want SQL and the cheapest retention, and have the appetite to own a database.
Pricing: Open source at infrastructure cost, plus a managed cloud metered on compute and storage separately.
Datadog

Datadog is the complete-system answer: its DaemonSet agent handles collection, parsing, Kubernetes enrichment and buffering, and its backend handles search, dashboards and alerting, with logs correlated to APM traces and infrastructure metrics out of the box. The correlation is the genuine product — clicking from a slow span to that pod’s logs at that second is worth a lot at 3am. The pricing model is where teams get hurt: ingest and indexed retention are metered separately, so a chatty cluster is expensive in two dimensions at once.
Pros
- Agent and backend from one vendor, so CRI parsing, multi-line rules and metadata enrichment work without a pipeline project
- Logs, traces and infrastructure metrics correlated by pod and trace ID, which is the fastest path from symptom to line
- Log pipelines and exclusion filters run server-side, so ingest-once-index-selectively is a supported pattern
- Kubernetes integration covers control-plane and audit sources as well as workload logs
Cons
- Separate meters for ingest and indexed retention mean cost can rise for two reasons at once, and log volume is the least predictable input you have
- Reducing spend depends on exclusion filters that run after ingest is billed, so the cheapest lever is still dropping at the agent
- Strong lock-in through correlation: the value comes from everything being in Datadog, which is exactly what makes leaving expensive
Best for: Teams who want logs, traces and metrics correlated in one place and can budget an ingest meter that tracks cluster chattiness.
Pricing: Separate meters for ingested volume and indexed events with retention tiers, on top of per-host infrastructure pricing.
Coralogix
Coralogix is built around the observation that most log data is never queried, and prices accordingly: you assign streams to tiers where the expensive tier is fully indexed and the cheap tier is stored for compliance and slower search, with analytics computed on the way through rather than at query time. For a Kubernetes cluster where the debug chatter dwarfs the interesting lines, that tiering maps neatly onto namespaces and log levels.
Pros
- Tiered pipelines let you keep everything while paying index prices only for what you search
- Metrics generated from log streams during ingest, so you get rate and error series without a second pipeline
- Routing decisions are expressed centrally rather than duplicated across every node’s agent config
- Supports OpenTelemetry and common agents, so collection is not locked to a proprietary shipper
Cons
- Getting the value requires actually classifying your streams, which is ongoing work nobody owns by default
- Cheaper tiers trade away query speed, so a stream tiered wrong is discovered during an incident
- Smaller ecosystem and community than the dominant vendors, so fewer worked examples to copy
Best for: Teams whose log bill is dominated by high-volume, rarely-queried streams they cannot legally delete.
Pricing: Priced by data volume with tiers that differ on indexing and query performance rather than one flat ingest rate.
SigNoz
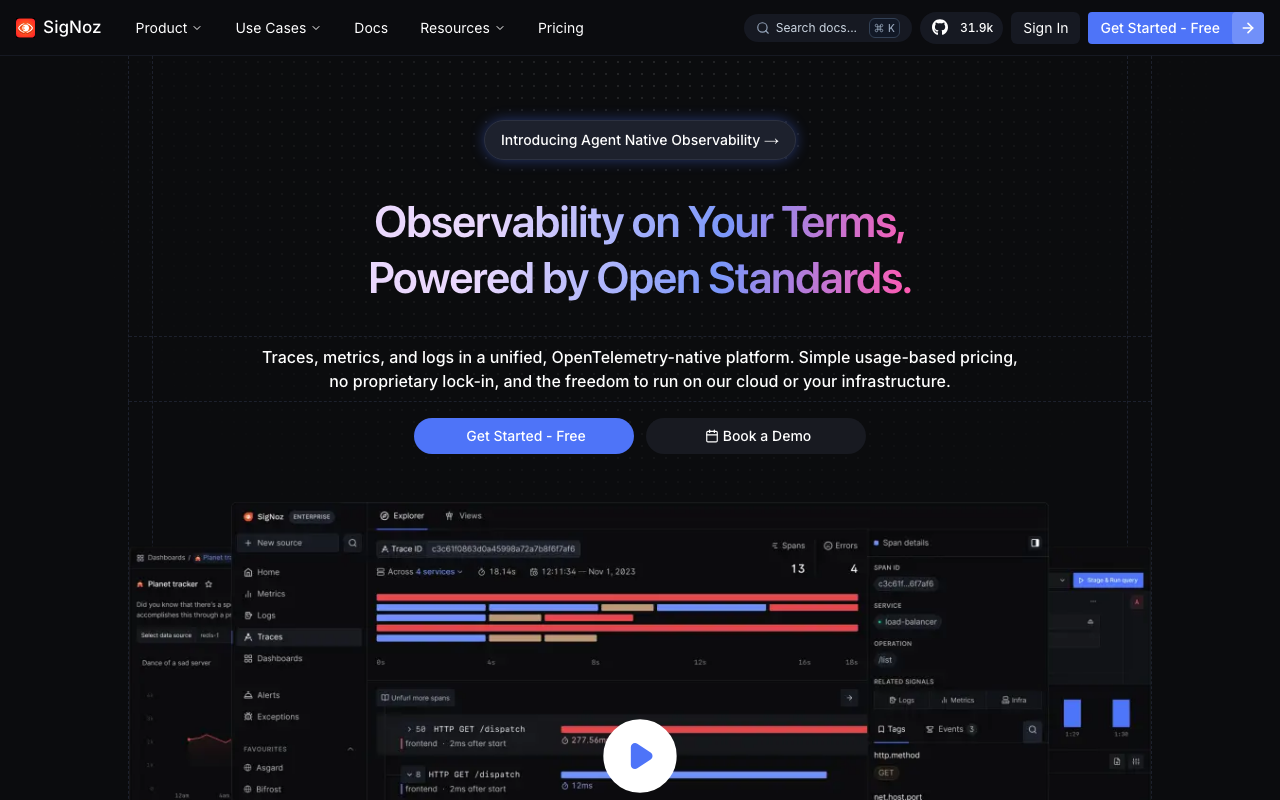
SigNoz is an OpenTelemetry-native platform storing logs, traces and metrics in ClickHouse, self-hosted or managed. For Kubernetes it means one OTLP endpoint and one store for all three signals, with the trace-to-log correlation that usually requires a commercial vendor. Because collection is the OpenTelemetry Collector rather than a proprietary agent, the shipping side of your setup stays portable if you leave.
Pros
- One self-hostable store for logs, traces and metrics, which removes a whole class of correlation plumbing
- ClickHouse underneath, so high-cardinality attributes and long retention stay affordable
- OpenTelemetry Collector for collection, so nothing vendor-specific runs in your cluster
- Correlation from a slow span to the pod’s logs at that moment without a commercial contract
Cons
- Self-hosted ClickHouse at log volume becomes genuine database operations as the cluster grows
- Smaller than the incumbent log stores, so unusual parsing and enrichment cases have fewer worked answers
- The OpenTelemetry Collector’s Kubernetes log receiver needs the same multi-line and CRI configuration care as any other agent
Best for: Teams already committed to OpenTelemetry who want one self-hostable backend for all three signals instead of three products.
Pricing: Open source and self-hostable at infrastructure cost, plus a managed cloud metered on ingested data and retention.
OpenObserve
OpenObserve stores logs, metrics and traces directly in object storage with its own columnar format, which sidesteps the usual expensive middle tier between the agent and cheap storage. The pitch is a dramatically simpler operational footprint than an Elasticsearch cluster for the same job, with a built-in UI so you are not assembling a frontend. It is younger than everything above it here, which is the honest caveat.
Pros
- Object storage as the primary tier keeps retention cost close to the floor without a separate archive pipeline
- Single-binary deployment mode makes a proof of concept genuinely quick
- Built-in search UI and dashboards, so it is a destination rather than a component
- Ingests from common agents and OTLP, so collection is not a rewrite
Cons
- Younger project with a smaller operational track record than Elasticsearch, Loki or ClickHouse at large scale
- Object-storage-first design means query latency depends heavily on your object store and partitioning
- Fewer integrations and community examples when something unusual breaks
Best for: Small platform teams who want a self-hosted logs-and-traces backend without operating a search cluster.
Pricing: Open source and self-hostable at object-storage and compute cost, with a managed cloud metered on ingested volume.
How to choose
Answer these in order and the shortlist collapses fast.
Do you need an agent, a backend, or both? If you have no collection story, start with Fluent Bit or Vector and get buffering configured before you shop for a destination. If your problem is that queries are slow or the bill is high, the agent is fine and the destination is the decision.
How do you actually search? If nearly every investigation starts with “show me this pod’s logs around this time,” a label-indexed store is cheaper and enough. If investigations start with a free-text string that could appear anywhere, you need an inverted index and should budget for it. If your logs are structured JSON and your questions are analytical, SQL over a columnar store beats both.
What is your data-residency and self-host position? That single answer removes either the managed column or the self-hosted column entirely, which is faster than any feature comparison.
Can you tolerate the failure mode? Anything you self-host, you also operate during the incident that is filling it with logs. That is an argument for a managed destination even in an otherwise self-hosted cluster — the same argument as running your pager somewhere else.
| Option | Layer | Picks itself when |
|---|---|---|
| Fluent Bit | Agent | You want the smallest reliable collector on every node |
| Vector | Agent + aggregator | Redaction, routing or ingest cost reduction is real work |
| Grafana Loki | Destination | You query by pod and namespace and want the cheapest storage |
| Elastic / OpenSearch | Destination | Free-text search and aggregation drive your investigations |
| ClickHouse | Destination | Logs are structured JSON and you want SQL plus long retention |
| Datadog | Agent + destination | Trace-to-log correlation matters more than the ingest meter |
| Coralogix | Destination | High-volume streams you must keep and rarely query |
| SigNoz | Destination | OpenTelemetry-native, self-hosted, all three signals in one store |
| OpenObserve | Destination | Small team, object-storage economics, no search cluster to run |
Two products deserve a mention outside the table. Better Stack pairs log search with uptime monitoring and on-call in one product, which is a reasonable consolidation for a small team that does not want three vendors — it is covered properly in the alerting tools guide. And groundcover takes the opposite approach to everything above: an eBPF agent that captures traffic and keeps the data in your own infrastructure with node-based pricing, which changes the cost curve for a large fleet — see APM for Kubernetes for how that architecture behaves.
Whatever you pick, get structured logging into the applications. It removes multi-line reassembly, makes agent-side dropping precise, and makes every backend on this list work better. It is the highest-return change available and it does not involve buying anything.
Frequently asked questions
Why did my crashlooping pod’s logs disappear?
Because the log files live on the node and belong to the pod. kubectl logs --previous reaches back exactly one container instance, so a pod that has restarted nine times has eight instances you cannot read. When the pod object is deleted, the kubelet garbage-collects its log directory and anything the agent had not already shipped is gone. The only fix is shipping fast enough, which is why agent buffer and lag metrics deserve an alert.
Do I need log management if I already have APM?
Yes, and for a specific reason. APM tells you a request was slow or failed and where in the call graph it happened; the log line tells you which record, which tenant and which branch of your code. Most vendors sell both because the correlation between them is where the value is. The related question — whether you need both from the same vendor — is a cost decision, and the answer is usually no. See the APM tools guide for how the two categories overlap.
How do I cut a Kubernetes log bill without losing anything important?
Drop at the agent, not in the backend, because backends bill on ingest. Start with health probe and readiness check lines, sidecar proxy chatter and duplicated request logs where both ingress and application log the same request. Then sample successful requests aggressively while keeping all non-2xx. Keep the drop rules in version control, and if you can, route the full stream to cheap object storage in parallel so a mistake is recoverable.
Should audit logs go in the same place as application logs?
Usually not. Audit logs are read by security, retained for months or years to satisfy a compliance requirement, and enormous if the audit policy is permissive. Application logs are read by on-call, retained for days, and searched constantly. Paying hot-index prices for audit retention is the expensive version of this mistake. Route audit and control-plane streams to cheap long-term storage and keep the hot index for workload logs.
Related reading
- Best log management tools — the wider category and how the pricing models differ.
- Elasticsearch vs Loki vs ClickHouse — the three storage architectures compared directly.
- Best APM for Kubernetes — the DaemonSet and eBPF story for traces and metrics.
- Best open source log management — self-run options and what each really costs to operate.
- Best alerting tools — turning log-derived signals into pages that a human should act on.
- Best self-hosted observability stacks — assembling collection, storage and query yourself.