The first Kubernetes observability bill that shocks a team is almost never caused by traffic. It is caused by a HorizontalPodAutoscaler doing its job. You scaled from 40 pods to 400 during a sale, each pod carried a unique pod_name label into every metric, and now your backend stores hundreds of thousands of time series describing pods that no longer exist. Traffic went up 3x, the bill went up more, and it does not come back down when the pods do, because the series are already written.
That is the defining property of Kubernetes monitoring. On a VM fleet the cost driver is hosts and it changes when you provision. Here the drivers are pod count, pod churn, and label cardinality, and all three move on their own.
The second difference: you have three genuinely different places to put collection, and the choice is architectural rather than cosmetic.
Key takeaways
- DaemonSet, sidecar, and eBPF have different blast radii and cost curves. DaemonSet is the sane default; sidecars are for isolation you can justify; eBPF covers workloads you cannot instrument but cannot see inside TLS or your business logic.
- Per-node and per-pod pricing multiplies your bill on a dimension unrelated to request volume. Model peak pod count, not average.
- Pod churn plus a
pod_namelabel is how teams create millions of dead time series. Drop high-cardinality Kubernetes labels at the collector, not at query time.- Evicted and OOMKilled pods take unflushed logs with them. If you only read logs through
kubectl logs, you are missing exactly the pods you most need.
The three collection architectures, honestly compared
DaemonSet. One collector pod per node, reading container logs from /var/log/pods, scraping kubelet metrics, and receiving OTLP from pods on the node. Default for good reasons: cost scales per node, upgrades are one rollout, application teams change nothing. Weaknesses are real — the collector is shared, so one noisy namespace starves the node, a crash takes out telemetry for every pod there, and node-local buffering loses whatever has not shipped on an aggressive drain.
Sidecar. A collector container in every pod. You get isolation and per-workload resource limits, and native sidecars (init containers with restartPolicy: Always) fixed the old problem where the sidecar died before the app finished flushing. The cost is multiplicative: 100Mi requested across 500 pods is 50Gi of cluster memory doing nothing but shipping telemetry, plus an image pull per pod and a rollout touching every deployment. Use them for a hard isolation or compliance requirement, not by default.
eBPF. A privileged agent attaching to kernel hooks — syscalls, socket operations, uprobes — to observe network traffic and process behavior with no application instrumentation. Zero code changes, no language-specific agents, coverage of workloads you do not control. The honest limits: eBPF sees bytes on sockets, so encrypted traffic needs uprobes on the TLS library, which is version-sensitive and breaks on statically linked runtimes. It has no idea what a “checkout transaction” is, and it wants a recent kernel and privileges some security teams will not grant.
| DaemonSet | Sidecar | eBPF | |
|---|---|---|---|
| Cost scales with | Nodes | Pods | Nodes |
| App manifest changes | None | Every deployment | None |
| Blast radius | All pods on node | One pod | All pods on node |
| Sees business logic | Only if instrumented | Only if instrumented | No |
| Covers uninstrumented images | Logs and metrics | Logs and metrics | Yes, network level |
| Privilege needs | Standard | Standard | Recent kernel, privileged |
Most mature setups end up hybrid: a DaemonSet for logs and metrics, application SDKs for spans where business logic lives, eBPF where instrumentation is impossible.
Needs first-hand data: Deploy the same workload three ways — DaemonSet, sidecar, eBPF — on an identical node pool and record cluster CPU and memory attributable to telemetry, plus the p99 latency delta. Do it at your real pod density; the sidecar penalty only appears when pods per node is high.
Per-node and per-pod pricing has nothing to do with your traffic
Most vendors price infrastructure monitoring per host, and in Kubernetes “host” means node, often with a container surcharge above a per-node allowance. Three things make that behave badly.
Autoscaling is a billing event. An autoscaler adding nodes during a spike adds monitored hosts. If billing samples hourly and charges on a high percentile, a few spiky hours set your rate for the month.
Small nodes cost more than big ones. Twenty 4-core nodes and five 16-core nodes run the same workload; per-node pricing charges four times as much for the first. That is an incentive to change node topology for billing reasons, which is a bad reason to change node topology.
Spot instances churn, inflating host counts depending on how the vendor deduplicates.
Pricing on data ingested decouples cost from cluster shape but couples it to how chatty you are — at least a dial you control. Whatever the model, price your peak, not your average. If you are early and cost-sensitive, the startup-focused comparison covers where free tiers break in exactly this scenario.
Cardinality is the failure mode nobody warns you about
Every metric series is defined by its label set. Add one label with a thousand distinct values and you multiply series count by a thousand.
Kubernetes hands you those labels by default. pod_name contains a random suffix, so every restart, deploy, and scale event creates a value that never repeats. container_id is worse. node_name churns on spot fleets. Add a version label per deploy and that is a fourth multiplier.
Two things break, in order. Query performance degrades before cost does — a dashboard querying two million series scans two million indexes to return one aggregate, so dashboards get slow, then time out, and on-call stops opening them. Then storage cost compounds, because databases charge on active series and a series stays active for its full retention window after the pod dies.
The fix is dropping cardinality at the collector, before anything is written. In the OpenTelemetry Collector, k8sattributes enriches with useful metadata while transform or attributes processors delete pod.name and container.id from metrics — keeping them on traces and logs, where you need per-pod identity. Aggregate metrics to deployment, namespace, and service level. That one decision is usually the biggest cost lever available.
Needs first-hand data: Run a series count by metric name against your own backend, list the top twenty, then check which are referenced by any dashboard or alert rule and publish the ratio.
The OTel Operator makes instrumentation a cluster concern
The most useful piece of Kubernetes-specific observability plumbing right now is the OpenTelemetry Operator.
It manages OpenTelemetryCollector custom resources so your collector deployment is declarative rather than a Helm values file nobody remembers editing. More interesting is the Instrumentation CRD plus a mutating admission webhook. Annotate a namespace with instrumentation.opentelemetry.io/inject-java: "true" and at admission the webhook injects an init container that copies the language agent into a shared volume and sets the environment variables — JAVA_TOOL_OPTIONS, DOTNET_STARTUP_HOOKS, NODE_OPTIONS, PYTHONPATH — that make the runtime load it.
The application image is unchanged. A platform team instruments every service in a namespace by editing one annotation — a completely different model from asking forty teams to add an SDK. Two caveats: the webhook only mutates pods at creation, so existing pods need a rollout, and auto-instrumentation gives framework spans, not business spans. For Java and .NET the injected agents cover a lot of ground on their own.
Correlating control plane, node, and application signals
A Kubernetes incident has at least four layers. Application: the service returns 500s. Pod: the container was OOMKilled and restarted. Node: memory pressure triggered eviction, or the disk filled with container logs. Control plane: the scheduler cannot place pods, or etcd latency is slowing every API call.
The connective signals are Kubernetes events, kube-state-metrics, kubelet metrics, and API server metrics. A tool that ingests events and overlays them on latency graphs turns a twenty-minute investigation into one glance — you see the Killing event at the moment latency spiked and you are done. Ask specifically whether it ingests events, whether it shows restart count and last termination reason beside traces, and whether it monitors the control plane at all. Managed control planes hide internals, but scheduler and API server latency stay visible through metrics many tools do not collect.
Ephemeral pods lose their logs
When a pod is evicted or OOMKilled, the container filesystem goes away. kubectl logs --previous works only while the pod object survives. The pods you most want to read are the ones whose logs are hardest to get, and the failure is silent until an incident.
Mitigations are unglamorous and all necessary. Ship logs off-node continuously with a DaemonSet reading /var/log/pods, so lines written before the crash are already leaving. Configure runtime log rotation deliberately, because a chatty pod filling the node disk causes the evictions you are debugging. Set terminationGracePeriodSeconds long enough to flush and handle SIGTERM. Keep termination reasons and exit codes as metrics, since those survive the pod.
OpenTelemetry: the standard underneath, not a product
OpenTelemetry is not one of the products below — it is the instrumentation standard most of them consume. It is a set of SDKs, semantic conventions, and a Collector. There is no dashboard, no alerting, no vendor, and no bill, so ranking it against Datadog or Dynatrace is a category error. What it does decide is portability: building on OTel constrains which products you can later leave, because the instrumentation stops being the vendor’s property.
OpenTelemetry in Kubernetes is two things: the Collector, which you deploy as a DaemonSet, a Deployment, or both in a gateway pattern, and the Operator, which turns instrumentation into a namespace annotation. The Collector is also where the cardinality decision lives — k8sattributes for enrichment, transform and attributes processors for dropping pod.name and container.id from metrics before anything is written.
What it gives you
- The Collector is the only place you can drop Kubernetes label cardinality before it becomes billable series, whatever backend you use
- The Operator’s
InstrumentationCRD instruments a namespace by annotation, so autoscaling adds instrumented pods automatically with no per-deployment work - Costs nothing per node or per pod, so scaling events do not have a licence consequence
- Deployment topology is yours to choose — DaemonSet, gateway, or hybrid — rather than dictated by a vendor’s agent
What it does not do
- You size, scale and monitor the collectors themselves; a DaemonSet collector that OOMs takes node telemetry with it
- The admission webhook only mutates pods at creation, so existing workloads need a rollout before injection applies
- Auto-instrumentation gives framework spans, not business spans, and no amount of annotation changes that
- Stores nothing and shows nothing: you still need a backend to receive the OTLP stream, and the cluster CPU and memory the collectors consume is real cost on top of it
groundcover

groundcover is the clearest expression of the eBPF-first approach and worth evaluating when many workloads cannot be instrumented. A privileged agent attaches to kernel hooks and reconstructs service-to-service traffic, HTTP and gRPC timings, and process behaviour without anyone touching an application image. Its architecture keeps data in your own cluster and sends control plane and query traffic out, which changes both the egress story and the pricing dimension.
Pros
- Covers third-party images, vendor containers and legacy workloads nobody will re-instrument, which is usually a meaningful slice of a real cluster
- No manifest changes, so autoscaling adds observed pods with zero rollout — new pods are visible the moment they schedule
- Storing data in-cluster keeps egress and retention cost under your control rather than a vendor’s meter
- One agent per node rather than per pod, so pod density does not multiply the footprint
Cons
- eBPF sees bytes on sockets, so encrypted traffic needs uprobes on the TLS library — version-sensitive and prone to breaking on statically linked runtimes
- No concept of business semantics: it can show you a slow gRPC call, never which customer or which feature flag
- Requires a recent kernel and privileged DaemonSet access that some security teams will not grant, which can end the evaluation before it starts
Best for: Clusters with a large share of workloads nobody can instrument — third-party images, acquired services, legacy containers — where network-level visibility beats no visibility.
Pricing: Node-based subscription with the data plane running inside your cluster, so storage and retention cost sit on your own infrastructure rather than on an ingest meter. Node count is the billing dimension, which means cluster autoscaling moves the bill and pod density does not.
Datadog

Datadog has the most complete Kubernetes coverage in the category — control plane, node, pod, and application in one place — which is exactly the four-layer correlation a real incident needs. It ingests Kubernetes events and overlays them on latency graphs, so the Killing event at the moment latency spiked is visible without a second tool. That completeness sits on a per-host plus per-container model that makes dense clusters expensive.
Pros
- Control plane, node, pod and application signals in one product, so a four-layer incident does not need four tools
- Kubernetes events ingested and overlaid on metric timelines, which collapses OOMKill investigations to a glance
- Its Agent DaemonSet also handles logs, metrics and traces, so one rollout covers the whole collection path
- Cluster Agent reduces API server load, which matters on large clusters where naive per-node scraping is itself a problem
Cons
- Per-node pricing with a container allowance means dense nodes incur a surcharge and autoscaling is a direct billing event — a spike that adds nodes for a few hours can set the month’s rate
- Small nodes are penalised relative to large ones, which creates pressure to change node topology for billing reasons
- Kubernetes labels reaching custom metrics is a well-known way to multiply the cardinality bill, and the guardrails are yours to build
Best for: Teams running Kubernetes who need per-layer attribution across control plane, node and pod in one place and can absorb per-node pricing with a container surcharge.
Pricing: Per-host subscription where a host is a node, with a per-node container allowance and a surcharge above it, plus separate meters for ingested and indexed spans, custom metrics and logs. Billing typically samples on a high percentile, so peak node count during autoscaling is what you pay for.
Dynatrace
Dynatrace prices full-stack monitoring on consumed memory per hour, which behaves differently from everything else here: many small pods can be cheaper than a few large ones, the inverse of per-node pricing. Operationally it deploys via an operator, discovers workloads automatically, and models the pod, node and cluster relationships so a restart is an event rather than a gap.
Pros
- Memory-hour pricing means pod count is not the billing dimension — a horizontally scaled deployment of small pods can be cheaper than a few large ones
- Automatic discovery means autoscaled pods are monitored the moment they schedule, with no annotation or manifest change
- Models the pod-to-node-to-cluster relationship, so restarts and evictions appear as events rather than unexplained discontinuities
- Operator-based rollout is one cluster resource rather than a per-deployment change
Cons
- Memory-hour billing punishes generously sized memory requests, so requests set defensively high cost you directly — a Kubernetes habit that is otherwise free
- Privileged host-level agent access is required, which some clusters will not grant
- Consumption meters across several data types make forecasting harder than a flat per-node line
Best for: Kubernetes estates running many small pods, where per-node or per-pod pricing would be punitive and memory requests are already tightly sized.
Pricing: Consumption-based, with full-stack monitoring billed on gibibyte-hours of consumed memory rather than node or pod count, plus separate meters for log and event ingest. Right-sizing memory requests is a direct cost lever, which is unusual and worth exploiting.
Chronosphere

Chronosphere is built around the cardinality problem specifically, putting aggregation and shaping controls in front of storage so you decide what is worth keeping before you pay to keep it. In a Kubernetes context that is the whole game: it lets you keep pod_name on the raw stream long enough to be useful and drop it from what is persisted, with visibility into which series any dashboard or alert actually references.
Pros
- Aggregation and cardinality controls sit before storage, which is the only place the Kubernetes churn problem can actually be fixed
- Shows which series are referenced by dashboards and alerts, turning the cardinality audit from a guess into a report
- Ingest-and-persist pricing decouples cost from node and pod count entirely, so autoscaling has no direct billing consequence
- Prometheus-compatible, so existing kube-state-metrics and kubelet scrape configs carry over
Cons
- Metrics-centric; it is not a full APM replacement covering traces, logs and application-level analysis in one product
- The shaping rules are a real ongoing job — the value comes from maintaining them, not from installing it
- Aimed at scale where cardinality is a budget line item, so smaller clusters will not see the benefit that justifies it
Best for: Large Kubernetes estates where pod churn has already made metric cardinality the dominant cost and someone needs to own shaping it.
Pricing: Usage-based on metrics ingested and metrics persisted, with the gap between the two being the point — you pay less for what you shape away. Node and pod counts do not appear in the bill, so autoscaling is cost-neutral.
Prometheus
Prometheus makes the cardinality problem concrete with metric_relabel_configs on the scrape side, and its label model is worth understanding even if you never run it, because most Kubernetes metric tooling has adopted its vocabulary. In-cluster it scrapes kubelet, kube-state-metrics and application endpoints via service discovery, so autoscaled pods are picked up automatically as targets.
Pros
- Kubernetes service discovery means autoscaled pods become scrape targets automatically with no registration step
metric_relabel_configsdrops high-cardinality labels at scrape time, before the series is ever written- Costs nothing per node or per pod, so cluster growth has no licence consequence
- The de facto standard for kube-state-metrics and kubelet metrics, with an enormous body of existing Kubernetes alert rules
Cons
- A single Prometheus is not highly available or long-term; durable storage and HA mean adopting Thanos, Cortex or Mimir, which is another system to run
- Metrics only — no traces, no logs, no application-level analysis
- Local storage on a node is exactly the wrong place for data about a cluster whose nodes churn, so remote write is effectively mandatory
Best for: Teams who want metric collection and cardinality control inside the cluster with no per-node licensing, and who accept running long-term storage themselves.
Pricing: Free and open source. Cost is the cluster resources it consumes and whatever long-term storage layer you add behind it.
Grafana
Grafana is the natural home for this stack if you are already Prometheus-based, and its adaptive metrics tooling exists precisely because unused high-cardinality series are the norm in Kubernetes. Mimir for metrics, Loki for logs, Tempo for traces, with a Kubernetes-aware agent handling collection, gives you the same layered picture without a per-node licence.
Pros
- Adaptive metrics aggregation targets exactly the Kubernetes failure mode — series nobody queries, generated by pod churn
- All components run in-cluster, so an air-gapped or egress-restricted cluster is a supported configuration
- Existing Prometheus scrape configs, kube-state-metrics dashboards and alert rules carry over without rework
- Cost dimension is data volume rather than node or pod count, so autoscaling does not directly move the bill
Cons
- Several components to run, and running Mimir, Loki and Tempo at cluster scale is a genuine platform engineering commitment
- No automatic Kubernetes topology model — you get the graphs you build, and control plane coverage is a configuration exercise
- Correlation between traces, logs and metrics depends on consistent labelling that pod churn constantly threatens
Best for: Platform teams already running Prometheus in-cluster who want logs and traces alongside on the same self-hosted footing.
Pricing: Open source components free to self-host; the managed cloud bills on active metric series, log volume and trace volume. Active series is the number pod churn inflates, so cardinality shaping is the main lever.
SigNoz
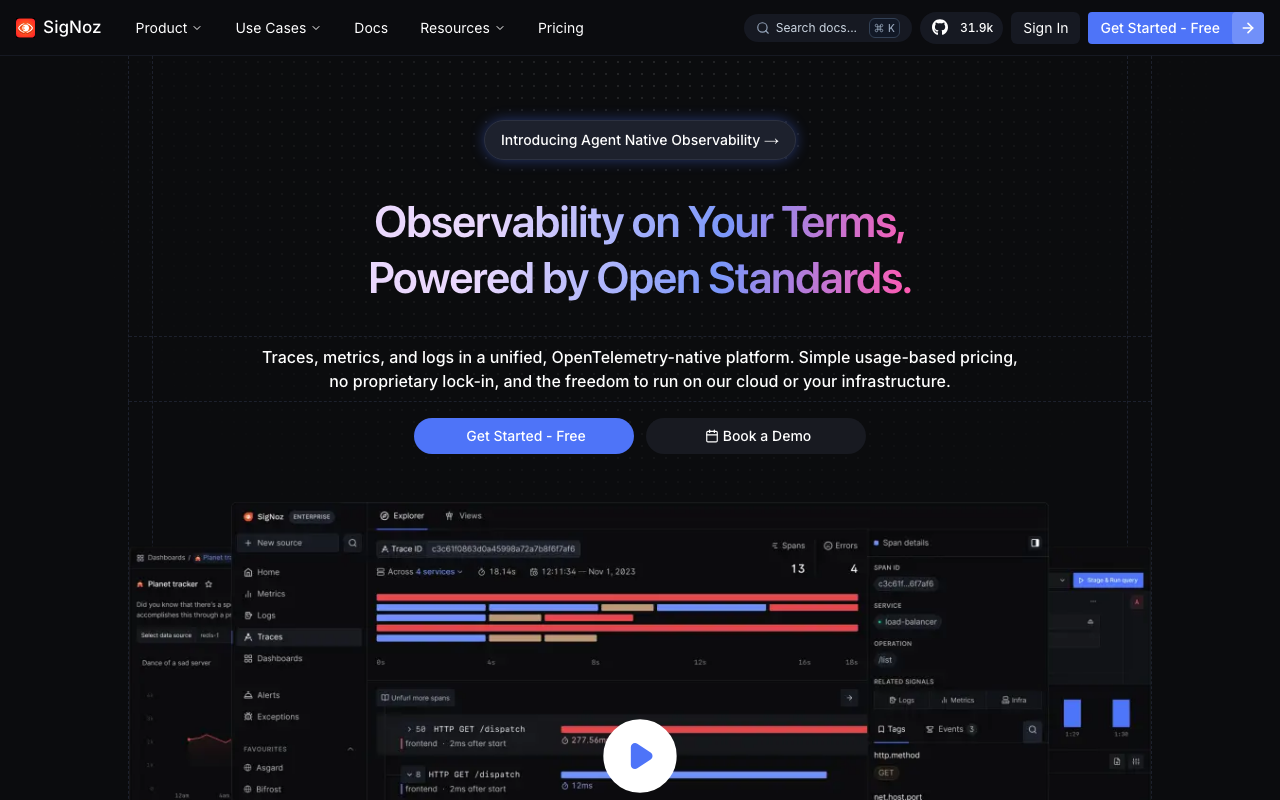
SigNoz pairs naturally with the OTel Operator since it consumes OTLP directly with no translation, so what the Operator injects is what the backend stores — including the k8sattributes enrichment your Collector added. It deploys in-cluster via Helm or runs as a managed service, and its query layer works over the same attribute names your Collector pipeline produced.
Pros
- Zero translation between what the Operator’s injected agents emit and what you query, so Kubernetes resource attributes survive intact
- Deployable inside the cluster, so telemetry never leaves for teams with egress restrictions
- Billing on ingested data rather than nodes or pods, so a scale-from-40-to-400 event costs only what those pods actually emit
- The Collector pipeline you build for it works unchanged against any other OTLP backend
Cons
- No automatic Kubernetes topology or control plane model comparable to the incumbents — you get what your Collector config collects
- Self-hosting means owning ClickHouse capacity in a cluster whose resource envelope is already contested
- Fewer prebuilt Kubernetes dashboards and alert rules than the Prometheus ecosystem has accumulated
Best for: Teams standardising on the OTel Operator and Collector who want the backend to be a swappable component rather than the thing the cluster is instrumented against.
Pricing: Open source and free to self-host; the managed offering bills on data ingested and retention period. Node and pod counts do not appear, so autoscaling is only as expensive as the telemetry the new pods produce.
How to choose
Count what you are buying. Peak node count, peak pod count, average pod lifetime, current active series count. Those four numbers price every option in the category.
Pick the collection architecture before the vendor. DaemonSet unless you have a specific isolation requirement. Add eBPF if many workloads cannot be instrumented. Sidecars only where you can name the reason.
Deploy the OTel Operator in a non-production cluster this week. Low effort, and it tells you how much coverage auto-injection gives your language mix before you pay anyone.
Do the cardinality audit — top twenty metrics by series count against the dashboards and alerts using them — then write collector processors dropping the rest. Before you sign, because it changes what you are quoted.
Kill a pod during the trial. OOMKill it and check whether the last seconds of logs arrived and whether the tool gives the termination reason without kubectl describe.
Match the billing dimension to your scaling behaviour. If you autoscale nodes aggressively, per-node pricing charges you for your elasticity. If you run many small pods, memory-hour pricing may beat both per-node and per-pod. If your cluster shape is stable but your metrics are noisy, ingest pricing puts the dial in your hands.
Starting fresh: OTel Operator for injection, an OTel Collector DaemonSet with aggressive cardinality trimming, an OTLP-native backend. That keeps the expensive vendor-specific part to storage and query, the part you can change later.
Frequently asked questions
Should I use a DaemonSet or sidecar collector?
DaemonSet for almost everyone. It scales with nodes rather than pods, needs no application manifest changes, and upgrades in one rollout. Choose sidecars when you need hard isolation between tenants, per-workload collector config, or guaranteed telemetry resources a noisy neighbour cannot consume.
Does eBPF replace application instrumentation?
No. eBPF observes syscalls and network traffic, giving you service maps, HTTP and gRPC timings, and process behavior without touching code. It cannot see business semantics — which customer, which cart, which feature flag — and struggles with encrypted traffic unless it hooks the TLS library.
Why did my observability bill go up when traffic did not?
Almost always pod count or cardinality. An autoscaling event, a node pool resize, a move to smaller instance types, or a new label on a common metric all raise cost with flat request volume. Check active series count and monitored host count over the same window as the bill.
Related reading
- Best APM tools for developers — the full landscape and how pricing models compare.
- Best OpenTelemetry-native observability platforms — where to send what the OTel Operator collects.
- Best self-hosted observability stacks — running storage inside the cluster.
- Best APM for serverless and edge functions — the opposite extreme, where no agent can run.
- Best APM tools for startups — where pod-based pricing breaks free tiers.
- Best open source APM and observability tools — Prometheus, Jaeger, and their operational cost.