There is no such thing as “a .NET APM decision.” There are two, and conflating them is the most common mistake I see. One covers .NET Framework 4.8 under IIS on Windows Server, deployed by a pipeline that copies files to a share. The other covers .NET 8 in a Linux container behind a service mesh. They share a language and almost nothing else about their observability story.
Most teams have both. A modernization program three years in still has the order-processing app on Framework 4.7.2 because it takes a System.Web.HttpContext dependency in forty places, alongside six new services on modern .NET. Evaluate only against the new services and you discover in month four that the Windows installer needs a COR_PROFILER variable set at the application pool level and a recycle, which change control treats as a production change.
Start with the split.
Key takeaways
- .NET Framework needs a CLR Profiling API agent, machine-level environment variables, and an app pool recycle to attach. Modern .NET can often be instrumented with a NuGet package and no infrastructure change at all.
System.Diagnostics.Activityis the type OpenTelemetry spans map onto in .NET. Because ASP.NET Core, HttpClient, and EF Core already emit Activities natively, .NET has the strongest built-in OTel story of any runtime — no bytecode rewriting required.- IIS application pool recycling resets in-process counters and drops buffered telemetry. Periodic unexplained discontinuities are usually recycles, not traffic.
- Async traces break at
.Result,.Wait(),Task.Runwithout context capture, and background services that never start their own Activity. The span is not missing, it is orphaned.
The Framework versus modern .NET split decides your tool
.NET Framework runs only on Windows, only in-process, under the CLR that ships with the OS. To instrument it, an agent uses the CLR Profiling API — a COM interface where a profiler DLL registers via the COR_PROFILER, COR_ENABLE_PROFILING, and COR_PROFILER_PATH environment variables, then receives callbacks as the JIT compiles each method and rewrites IL on the way through.
The consequences are real. The variables must be visible to the IIS worker process, which usually means setting them machine-wide or on the application pool, followed by a recycle or an iisreset. Only one profiler can attach per process, so an APM agent and a code coverage tool cannot coexist. Profiler DLLs are architecture-specific, so a 32-bit app pool needs the 32-bit DLL.
Modern .NET still supports the profiling API, and vendor agents use it on Linux too. But it also gives you a cleaner option in the base class library.
Activity is why .NET has the best native OpenTelemetry story
In most runtimes, OpenTelemetry has to inject itself. Java rewrites bytecode. Node monkey-patches require. Python swaps functions in module dictionaries. In .NET, the framework already emits the telemetry and OTel just listens.
System.Diagnostics.Activity represents a unit of work with a trace ID, span ID, parent, and tags. ActivitySource is the emitter. Crucially, Microsoft instrumented their own libraries with it: ASP.NET Core starts an Activity per request, HttpClient starts one per outbound call and injects the W3C traceparent header, and EF Core starts one per command — whether or not you have any observability tooling installed.
OpenTelemetry’s .NET SDK is, at its core, an ActivityListener subscribing to those sources and exporting over OTLP. Which is why setup is roughly six lines in Program.cs with no agent, no startup hook, and no privileged install:
builder.Services.AddOpenTelemetry()
    .WithTracing(t => t
        .AddAspNetCoreInstrumentation()
        .AddHttpClientInstrumentation()
        .AddEntityFrameworkCoreInstrumentation()
        .AddOtlpExporter());
Your own code participates through a static ActivitySource and StartActivity. That code references only System.Diagnostics, so instrumentation you write today survives changing vendors or dropping the vendor entirely.
This is a better position than Java or Node are in, and it should push your default toward OTel-native instrumentation on modern .NET. Pair it with an OTLP-native backend and you avoid conversion layers entirely.
Needs first-hand data: Instrument one ASP.NET Core service with only the OTel .NET SDK, then with each vendor’s agent, and list which spans appear in one and not the other. That gap — usually background services, custom middleware, and third-party clients — is what you are paying the vendor for.
IIS application pool recycling will lie to your dashboards
If your Framework metrics have unexplained discontinuities, look at recycling before you look at your code.
Application pools recycle on several default triggers: a fixed interval, an idle timeout, private memory limits, and request counts. The worker process is torn down and a new one starts, and everything in process memory goes with it.
Three things break. In-memory counters reset, so any metric accumulated in a static field restarts at zero and rate calculations across the boundary produce a spike or a negative. Buffered telemetry is lost — agents batch and flush on a timer, so whatever is in the buffer when the process dies is gone, which is exactly the window you want when a memory limit caused the recycle. Cold start latency reappears, because the next request pays JIT compilation, config load, and pool warmup.
Tools that install as a Windows service and read from ETW or an out-of-process collector survive this better, because the shipping path is not inside the process that died. Ask vendors how their agent behaves across a recycle. It separates the ones with real Windows experience from the ones with a Windows checkbox.
Async/await context flow is where traces go wrong
Trace context lives in Activity.Current, backed by AsyncLocal<T>, which flows across await because the async state machine copies execution context forward. Most of the time this just works. It stops in recognizable places:
- Sync-over-async.
.Resultor.Wait()blocks a thread and, in older ASP.NET, can deadlock on the synchronization context. Even without a deadlock, continuation context restoration gets unreliable. - Fire-and-forget.
Task.Run(() => DoWork())without awaiting starts work whose parent may end and dispose its Activity before the child finishes. - Long-lived background services. A
BackgroundServiceloop that does not start a new Activity per iteration attributes everything to whatever was current at startup, or to nothing. - Channels, queues, and custom thread pools. Any handoff the runtime does not know about drops ambient context unless you capture and restore it explicitly.
The symptom is not a missing span. It is a span appearing as a separate root trace with a duration matching something you know was a child. When orphaned roots show up in your trace list, go looking for Task.Run. This is the Node.js AsyncLocalStorage problem in different clothes.
Entity Framework visibility separates useful tools from noisy ones
EF Core emits an Activity per command with the SQL text as a tag, so every tool consuming Activities shows the query and its duration. What differs is what happens next.
Good EF visibility means the tool parameterizes and groups queries, collapsing five thousand executions of one statement into a single row with call count and duration distribution. Without grouping, a chatty ORM produces so many distinct query strings that the list is unusable and your cardinality bill climbs.
It also means surfacing N+1 patterns — the same query executing many times inside one request, which is what a lazy-loaded navigation property in a foreach produces. The most common EF performance bug, invisible on a latency graph, visible only as a shape in the waterfall: one parent span with 200 near-identical short children.
Needs first-hand data: Take an endpoint with a known N+1 and check which candidate tools flag it automatically versus which require reading the waterfall yourself. Record time-to-identification for an engineer who has not seen the code.
OpenTelemetry: the standard underneath, not a product
OpenTelemetry is not one of the products below — it is the instrumentation standard most of them consume. It is a set of SDKs, semantic conventions, and a Collector. There is no dashboard, no alerting, no vendor, and no bill, so ranking it against Datadog or Dynatrace is a category error. What it does decide is portability: building on OTel constrains which products you can later leave, because the instrumentation stops being the vendor’s property.
On .NET, OpenTelemetry is less an instrumentation layer bolted on top and more a listener on telemetry the framework already emits. Activity and ActivitySource live in the base class library, not in an OTel package, which gives .NET the strongest built-in OTel story of any runtime. The SDK subscribes to the ActivitySource instances ASP.NET Core, HttpClient and EF Core populate natively, then exports over OTLP. There is no profiler DLL, no environment variable, no privileged install, and no bytecode rewriting — which is why it requires no infrastructure change at all on modern .NET.
What it gives you
- Roughly six lines in
Program.csand no agent, noCOR_PROFILERvariable, and no app pool recycle on modern .NET - Your own
ActivitySourcecode references onlySystem.Diagnostics, so it survives changing or dropping the vendor - Coverage of ASP.NET Core, HttpClient and EF Core is native to the framework rather than reverse-engineered by a vendor
- No licensing gate, so instrumenting every service including low-traffic internal ones costs nothing
What it does not do
- Weak on .NET Framework, where the native Activity plumbing is not present in the same way and you are back to a profiler-based agent
- Libraries that do not emit Activities are simply invisible; there is no fallback bytecode rewriter to catch them
- You run and scale the collector yourself, and its failure modes are yours to learn
- Stores nothing and shows nothing: something still has to receive the OTLP stream, so a backend and the collector infrastructure around it remain your cost
SigNoz
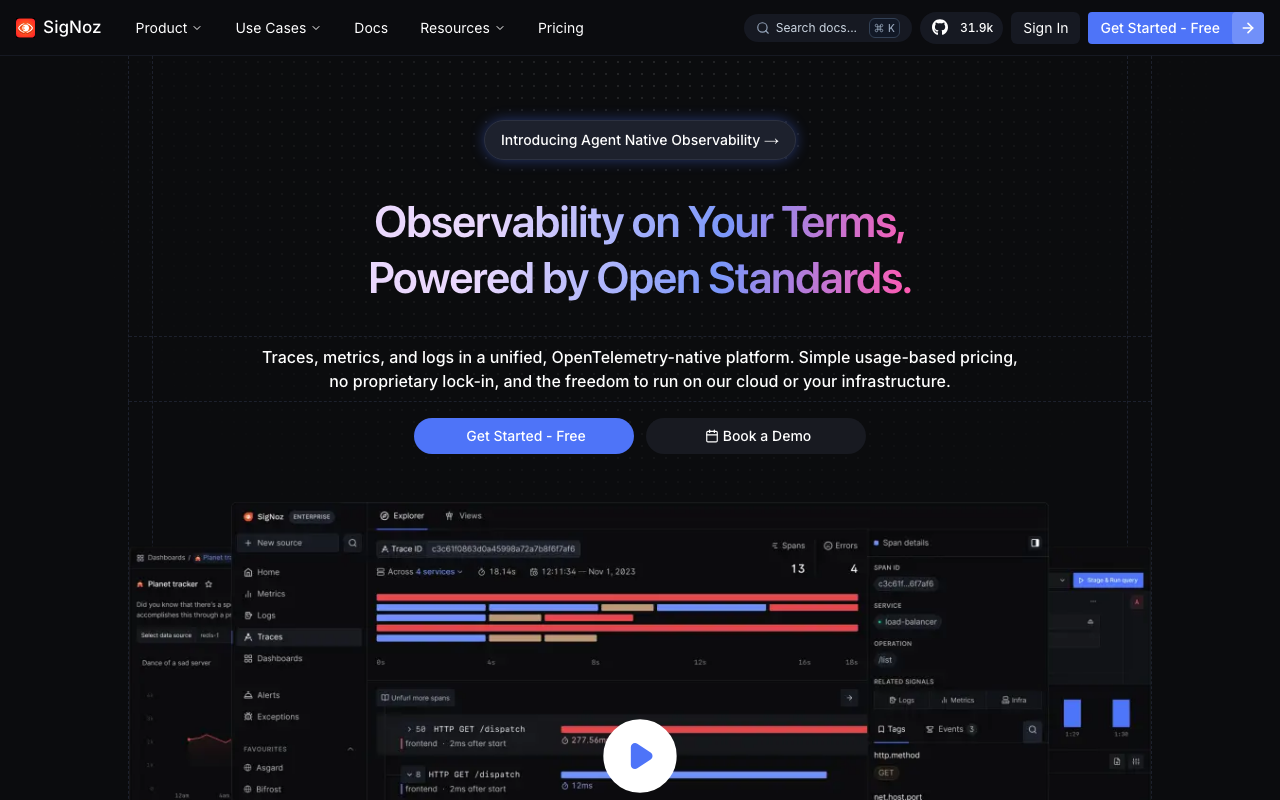
SigNoz takes the OTLP stream directly with no translation layer, so the Activity tags your ActivitySource code sets are the attributes you query. That makes it a reasonable place to see the data before committing budget: the instrumentation you write for it is the same instrumentation any other OTLP backend would accept, so the trial costs you nothing in lock-in. It runs self-hosted or as a managed service.
Pros
- No conversion between Activity tags and stored attributes, so custom
ActivitySourcemetadata survives intact - Trialling it costs no instrumentation work you would have to undo — the OTel .NET SDK is the same either way
- Self-hosting is a real option for .NET estates that cannot egress telemetry outside the network
- Traces, metrics and logs in one store queried with consistent attribute names
Cons
- Nothing for .NET Framework beyond what you can emit yourself; there is no CLR profiler agent
- No IIS-specific awareness — app pool recycles, worker process identity and site topology are not modelled
- Self-hosting means owning ClickHouse capacity and retention, which is real ongoing work
Best for: Modern .NET teams already committed to the OTel SDK who want an OTLP-native backend they can swap out later without re-instrumenting.
Pricing: Open source and free to self-host; the managed offering bills on data ingested and retention rather than per host, so container density does not move the bill.
Grafana
Grafana works if you already scrape System.Runtime and ASP.NET Core meters with Prometheus and want traces beside them rather than a separate product. .NET’s built-in Meter API exposes GC, thread pool, exception and request metrics that Prometheus can scrape directly, so the metrics half of the stack is often already running before anyone thinks about tracing.
Pros
- Adds tracing beside
System.Runtimeand ASP.NET Core meters you are probably already scraping - Exemplars link a thread pool queue length spike to a specific trace from the same window
- Fully self-hostable, which suits on-prem Windows estates that never send data out
- Component-level choice means you can adopt tracing without touching the metrics pipeline
Cons
- Several components to configure and operate rather than one product that works on install
- No .NET-specific analysis — it graphs the meters and leaves the interpretation to you
- Nothing for .NET Framework’s performance counters unless you build the scrape path yourself
Best for: .NET teams whose runtime metrics already live in Prometheus and who want traces alongside without adopting a second product.
Pricing: Open source components free to self-host; the managed cloud bills separately on metric series, log volume and trace volume, so meter cardinality is the number that moves the bill.
Datadog

Datadog does query grouping and resource aggregation well, which is what makes EF Core data usable rather than just present — five thousand executions of one statement collapse into a row with a duration distribution instead of five thousand distinct strings. Its .NET tracer covers Framework and modern .NET from one product, which matters when you have both and do not want two vendors for one language.
Pros
- One tracer and one product across .NET Framework on IIS and modern .NET on Linux, so a mixed estate is one contract
- EF Core query grouping and N+1 surfacing rather than raw statement lists
- Traces, runtime metrics, IIS logs and profiles on a shared timeline
- Windows install path is well-trodden, including the app pool environment variable setup
Cons
- Separate meters for hosts, ingested spans, indexed spans, custom metrics and logs; a chatty EF workload can move the ingest bill more than adding servers does
- Ungrouped or high-cardinality SQL text is a known and expensive way to blow up custom metric counts
- Framework instrumentation still requires the profiler environment variables and a recycle, which change control will treat as a production change
Best for: Organisations with both .NET Framework on IIS and modern .NET in containers who want one vendor covering the whole estate.
Pricing: Per-host subscription with separate meters for ingested and indexed spans, custom metrics, profiling and log ingest, on annual commitments. Windows VMs are fewer and larger than Linux pods, which flatters the per-host line until you containerize.
Dynatrace
Dynatrace has the strongest automatic story for mixed Windows estates. OneAgent discovers IIS sites and application pools at the host level rather than needing per-application configuration, which is a large difference across hundreds of servers where the alternative is setting profiler variables and recycling pools one at a time. It also models the relationship between the site, the pool and the worker process, so a recycle shows up as an event rather than a mystery discontinuity.
Pros
- Host-level discovery of IIS sites and app pools instead of per-application config, decisive at hundreds of Windows servers
- App pool recycles surfaced as events on the timeline rather than appearing as unexplained metric gaps
- Covers Framework and modern .NET from the same agent, with automatic dependency mapping across both
- Strong story for the Windows infrastructure around the app — the host, the service, the pool
Cons
- The most opinionated agent here; you get its model of your application whether or not it matches yours
- OneAgent needs privileges and a host-level install that some hardened Windows environments resist
- Consumption-based licensing across several meters makes forecasting harder than a flat per-host line
Best for: Large Windows estates with many IIS servers where per-application agent configuration is not a realistic rollout plan.
Pricing: Consumption-based with separate meters for full-stack monitoring, log ingest and other data types, on annual commitments. The full-stack meter tracks consumed memory per hour, so IIS worker process memory limits feed directly into cost.
AppDynamics
AppDynamics comes from the enterprise Framework world and handles WCF, MSMQ and older transaction shapes that newer tools treat as an afterthought. Its business transaction model names work after the entry point that started it rather than a URL template, which fits WCF service contracts and message-driven work better than HTTP-shaped models do.
Pros
- Named handling of WCF and MSMQ, not just HTTP — the transaction shapes most modern tools skip
- Business transaction naming maps onto service contracts and message handlers rather than assuming REST routes
- Offline and air-gapped installation is a supported path, which matters for on-prem Windows estates
- Enterprise support model with people who have debugged a profiler conflict on IIS before
Cons
- Configuration is heavy — business transaction rules and tiers usually need manual tuning before the data is useful
- Weaker fit for modern .NET on Linux containers, where its assumptions add friction
- The UI feels dated next to newer tools and the learning curve is steep
Best for: Enterprise .NET Framework estates with WCF and MSMQ in the critical path, where change windows and offline install are hard constraints.
Pricing: Per-agent licensing tiered by capability, on annual enterprise agreements with volume discounting. The unit is the instrumented process, so a few large IIS servers cost less than many small ones.
IBM Instana
Instana also comes from the enterprise Framework world and handles the older transaction shapes, with automatic discovery as its distinguishing model — a newly deployed IIS site or .NET service appears without anyone editing a config file. It traces continuously rather than sampling, so the one slow request in a batch job is actually in the data.
Pros
- Automatic discovery of new .NET processes and IIS sites without config changes
- Unsampled tracing by default, so rare slow requests are present rather than statistically absent
- Coverage of older enterprise transaction shapes alongside modern .NET
- Available self-hosted, which suits Windows estates that cannot send telemetry out
Cons
- Unsampled tracing at high request volume drives data cost, and that lands on you
- Differentiation narrows outside IBM-centric estates
- Smaller integration ecosystem and community than the largest platforms
Best for: Enterprises with mixed .NET Framework and modern .NET workloads who want processes discovered automatically rather than enrolled one at a time.
Pricing: Per-host licensing tiered by capability, on annual agreements, available as SaaS or self-hosted. Host-based pricing rewards the small number of large Windows servers typical of Framework estates.
Elastic
Elastic is worth considering if you already ship Windows event logs and IIS logs to Elasticsearch, because correlating a trace exception with its IIS log line happens in one place. The .NET agent supports both Elastic’s own format and OTLP, so you are not committing to a proprietary wire protocol to get the co-location benefit.
Pros
- IIS logs, Windows event logs and traces in one store, so correlating a 500 with its
w3svclog line is one query - Supports OTLP ingest, so
ActivitySourceinstrumentation stays portable - Self-hosted operation is a first-class deployment mode for estates that cannot egress
- Reuses Elasticsearch capacity and skills the Windows ops team may already have
Cons
- Adopting it without an existing Elasticsearch cluster means taking on cluster operations and index lifecycle management
- .NET-specific interpretation is thinner than the dedicated vendors — good data, less analysis
- No IIS app pool modelling; recycles are still something you infer from the data
Best for: .NET teams already sending IIS and Windows logs to Elasticsearch who want trace data landing in the same cluster.
Pricing: Open source components free to self-host; the managed offering is tiered by feature level and billed on provisioned cluster resources, so cost tracks retention and storage rather than server count.
New Relic
New Relic’s .NET agent has been around a long time and handles Framework well, including the CLR profiling install path on IIS and the older transaction shapes that come with it. Evaluate it if you want one vendor across a mixed estate. What separates it from the rest of this list is the billing dimension: it charges on data ingested and on user seats rather than per host, which changes the arithmetic completely when your Windows fleet is many small servers rather than a few large ones.
Pros
- Pricing does not scale with server count, so a wide IIS fleet does not multiply the bill
- Mature Framework agent with a well-documented
COR_PROFILERinstall path and app pool setup - One platform for traces, runtime metrics and IIS logs, avoiding a separate correlation problem
- Accepts OTLP, so modern .NET services can use the plain OTel SDK and Framework apps can use the agent, into one backend
Cons
- Ingest-based billing punishes verbose tracing, and a chatty EF Core workload emits a lot of spans
- The seat-based half of the model can bite in large engineering organisations where many people occasionally need access
- Fewer Windows infrastructure-level features than the vendors that model IIS sites and pools directly
Best for: Mixed .NET estates with many Windows servers, where per-host pricing would be punitive and telemetry volume is the more controllable dial.
Pricing: Billed on data ingested plus a per-user model with tiers of platform access, rather than per host or per agent. Server count is free; span volume and headcount are what you pay for.
Azure Application Insights
If you are entirely on Azure App Service and Azure Functions, the platform’s built-in monitoring is competitive and already collecting. Its distributed tracing uses the same Activity plumbing as everything else in this article, so your ActivitySource code works unchanged and nothing you write for it is wasted if you leave. Instrumentation can be codeless through the App Service extension or SDK-based, and the data lands in a Log Analytics workspace queried with KQL.
Pros
- Already collecting on Azure App Service and Functions with no agent install and no infrastructure change
- Uses the same
System.Diagnostics.Activitymodel, so custom instrumentation is portable in and out - Deep correlation with Azure platform signals — App Service, Functions, SQL Database — that third-party tools see less of
- Live Metrics gives a near-real-time view during a deploy without waiting for ingest
Cons
- Stops being enough on multi-cloud or hybrid estates; on-prem IIS servers outside Azure are a second pane of glass, which defeats the purpose
- Infrastructure correlation ends at the Azure resource boundary
- KQL is a separate query language to learn, and sampling defaults can quietly drop the traces you went looking for
Best for: Teams whose .NET estate is entirely inside Azure App Service and Azure Functions with nothing on-prem or in another cloud.
Pricing: Consumption billing on data ingested into the Log Analytics workspace plus retention beyond the included period, with commitment tiers that lower the effective ingest rate at volume. Sampling is the main cost lever.
How to choose
Inventory honestly. Count production applications by runtime and host: Framework on IIS, modern .NET on Windows, modern .NET on Linux containers. If Framework-on-IIS is more than a third of the estate, that constraint leads.
Instrument one modern service with pure OpenTelemetry. Six lines in Program.cs, no vendor agent. Close to free, and on .NET the baseline is high enough that some teams stop there.
Test the Windows install path in a change-controlled environment, not a laptop. Set the profiler variables, recycle the pool, confirm attachment on a 32-bit app pool. Time it including approvals.
Force a recycle and check what you lost. Set a low private memory limit, drive traffic until the pool recycles, and see whether the last thirty seconds of traces survived.
Price per host and per ingest separately. Windows VMs are fewer and larger than Linux pods, which flatters per-host pricing until you containerize. Model both, and read how pricing models differ across the category before signing multi-year.
| Framework on IIS | Modern .NET on Linux | Install disruption | |
|---|---|---|---|
| OpenTelemetry SDK (standard, not a product) | Limited | Native | None |
| Datadog | Yes | Yes | Profiler vars plus recycle on Framework |
| Dynatrace | Yes, host-level discovery | Yes | Host agent install |
| AppDynamics | Yes, including WCF and MSMQ | Partial | Profiler vars plus recycle |
| IBM Instana | Yes | Yes | Host agent install |
| Elastic | Yes | Yes | Agent or OTLP |
| New Relic | Yes | Yes | Profiler vars plus recycle on Framework |
| Azure Application Insights | Only inside Azure | Yes on Azure | None on App Service |
My default: modern .NET services get the OpenTelemetry SDK and an OTLP backend, because the instrumentation is native and portable. Framework-on-IIS gets a commercial agent from a vendor with real Windows heritage, because CLR profiling and IIS integration are not work you want to own.
Frequently asked questions
Do I need an APM agent for .NET, or is the OpenTelemetry SDK enough?
For ASP.NET Core, HttpClient, and EF Core the SDK is enough — those libraries emit Activities natively and the SDK just listens. You need an agent for zero-code-change instrumentation of libraries that do not emit Activities, when you cannot rebuild the application, or for .NET Framework, where the native Activity plumbing is not present in the same way.
Why do my .NET traces show separate root spans instead of one trace?
Trace context stopped flowing. Look for Task.Run without context capture, .Result or .Wait() calls, work handed to a custom thread pool or channel, and background services that do not start their own Activity per iteration.
Is Azure Application Insights enough on its own?
For an all-Azure estate, often yes, and it uses the same Activity model so your instrumentation is portable either way. It becomes insufficient when you have on-prem servers, another cloud, or need correlation with infrastructure it does not monitor.
Related reading
- Best APM tools for developers — how the whole category compares on architecture and pricing.
- Best APM for Java and Spring Boot — the other mature managed runtime and its agent model.
- Best OpenTelemetry-native observability platforms — where to send OTLP from your ActivitySource code.
- Best APM for Kubernetes workloads — what changes when .NET services move to Linux containers.
- Best APM tools for enterprise — rollout and governance across a mixed Windows and Linux estate.