The first Node trace you look at is usually a lie. The HTTP span is there, the database span is there, and between them is a two-hundred-millisecond gap with nothing in it. Or worse: the trace ends at the first await and everything downstream shows up as an orphaned root, so the slow path you are hunting is spread across four traces nobody can join.
That is not a vendor bug. It is what happens when Node instrumentation meets a real codebase — ESM imports, a bundler, a worker pool, a queue consumer that resumes work on a different tick. Every Node APM does the same fundamental trick and they all fail in the same places.
So the useful question is not which tool has the nicest dashboard. It is whether the agent survives your module system, keeps async context across your code, and shows you event loop health.
Key takeaways
- Node auto-instrumentation patches modules at
requiretime. ESM does not go throughrequire, which is why ESM apps need loader hooks and bundled apps often produce no spans at all.AsyncLocalStorageis what stitches spans into a trace. Where context is lost — worker threads, queues, listeners bound at boot — the trace breaks.- Event loop delay and event loop utilization predict user-visible pain better than CPU. Most teams never chart them.
- Without source maps, every stack trace from transpiled TypeScript points at one minified line in
dist/.
Auto-instrumentation is monkey-patching, and ESM breaks it
Every Node agent — Datadog’s dd-trace, Elastic’s Node agent, the OpenTelemetry Node SDK — starts the same way. It hooks module loading, waits for you to load http, express, pg, ioredis, and wraps the exports before your code holds a reference. The community plumbing is require-in-the-middle for the hook and shimmer for the safe wrap. That is the whole magic.
Two consequences follow.
The agent must load first. If your app requires pg before the tracer initializes, the tracer wraps a module nobody is holding. Hence --require ./tracer.js, or an init at the very top of the entry file — and hence moving that init into a framework bootstrap silently killing half your spans.
ESM does not call require. ESM bindings are resolved statically and are immutable from outside — you cannot reassign an export from another module, which is exactly what shimmer needs to do. The workaround is Node’s loader hooks: import-in-the-middle rewrites module source as it loads to add settable indirection, registered through --experimental-loader on older Node or module.register() from an --import bootstrap on Node 20.6 and later. Newer releases add synchronous in-process hooks, removing the off-thread loader complexity but not the requirement to register first.
Bundlers are the other half. Ship an esbuild, webpack or ncc bundle and dependencies were inlined at build time — no require('pg') left to intercept, so no spans and no error. Mark instrumented packages external, or instrument manually. This is one reason serverless runtimes need a different approach.
AsyncLocalStorage decides whether traces stitch together
A trace is only a trace if a span created deep in a callback knows which request it belongs to. In Node that mechanism is AsyncLocalStorage from node:async_hooks — the OpenTelemetry SDK ships AsyncLocalStorageContextManager for exactly this, and vendor agents use the same primitive.
Context propagates through promises, async/await, timers and most standard callbacks. It does not propagate through:
- Worker threads. Each worker is a separate V8 isolate;
postMessagecarries data, not async context. Serialize the trace context into the message and re-activate it yourself. - Objects created before the request. A connection pool or
EventEmitterregistered at boot captured boot context and restores it when it fires.AsyncResource.bind()fixes this; well-behaved libraries use it, yours probably does not. - Queue consumers. A BullMQ or SQS job crosses a process boundary and nothing propagates unless you put
traceparentin the payload.
Do not evaluate a Node APM on a hello-world Express route. Test the path that goes HTTP → queue → worker → database and count how many traces it takes to describe one logical request.
Event loop lag is the metric that predicts pain
Node’s single thread means a request can be fast, the database can be fast, CPU can look moderate, and the service still times out — one handler is blocking the loop and everything else queues behind it.
Two metrics show this: event loop delay via perf_hooks.monitorEventLoopDelay(), a real histogram rather than setInterval drift, and event loop utilization via performance.eventLoopUtilization(), the fraction of time the loop was busy. Utilization is the one people miss. A service at 95% ELU has no headroom and shows it as a latency cliff, not a slope.
The culprits are boring and specific: JSON.parse on a large body, pbkdf2Sync, synchronous zlib, readFileSync in a hot path, catastrophic regex backtracking. None produce a span. They produce loop delay and a p99 that matches no single slow operation.
Require loop delay percentiles and ELU as first-class, alertable, per-process metrics. Some tools report only a mean, which averages away the spikes you need. A CPU profile taken during the spike names the function holding the thread.
Needs first-hand data: Run a fixed load test against one Node service with each agent enabled in turn, recording p50/p99 event loop delay and utilization from
perf_hooksindependently of the agent. Report the delta each agent adds.
Cluster mode and worker threads split one service into many
cluster forks N processes. Each loads its own agent, keeps its own span buffer, reports its own runtime metrics. Two things go wrong.
Attribution. If the agent tags metrics only by host or container, per-process gauges from four workers collapse into an average — heap of 400 MB on one worker and 100 MB on three others averages to a number describing no process that exists. You need PID or worker ID as a dimension and the ability to group by it.
Cost. Some platforms price per host and ignore process count. Others emit per-process series, multiplying metric count by worker count, which compounds with pod churn — see the Kubernetes guide.
Worker threads add the context problem above plus memory: each is a full isolate with its own heap, and agents buffering spans per isolate multiply their own footprint.
Source maps, or your stack traces point at nothing
Write TypeScript, ship JavaScript, and an unhandled error gives you dist/main.js:1:84210.
Three ways out. --enable-source-maps makes the runtime rewrite Error.stack — simple and universal, costs startup and error-path time. Uploading maps to the vendor at build time gives the best fidelity but is a build step you own with a vendor-specific CLI. Shipping .map files beside the bundle works and hands your source to anyone who fetches them.
Whichever you pick, tie it to a release identifier the agent also reports, or you will symbolicate yesterday’s stack against today’s map and get plausible, wrong line numbers.
OpenTelemetry: the standard underneath, not a product
OpenTelemetry is not one of the tools below. It is the instrumentation standard — SDKs, semantic conventions and the collector — that the products in this article consume. It has no dashboard, no alerting and no bill, so scoring it against Datadog or New Relic is a category error: you do not pick it instead of a backend, you pick it underneath one. What that choice does decide is how cheaply you can leave whichever backend you pick.
It is the instrumentation layer under most of what follows. The Node SDK is where require-in-the-middle, import-in-the-middle and AsyncLocalStorageContextManager actually live, so understanding it is understanding why any Node agent breaks. Using it directly means switching vendors is an exporter change, not a re-instrumentation project. You own the collector, the sampling policy, and the debugging when a version bump breaks a patch.
What it gives you
- ESM auto-instrumentation works through documented loader hooks you register yourself, so failures are inspectable rather than vendor-internal
- Context propagation uses the same
AsyncLocalStorageprimitive every vendor agent uses, without a second patching layer - Instrumentation is entirely portable: the collector decides where data goes, and that is a config change
- Manual spans around your queue and worker-thread boundaries are the same code regardless of which backend you end up on
What it does not do
- No backend, no UI, no storage — you still have to pick and pay for one of the products below
- Version-range mismatches in instrumentation packages fail silently, producing missing spans with no error
- You operate the collector, own the sampling policy, and debug loader-hook ordering yourself
- It carries no licence cost, but it is not free: you pay in collector infrastructure, the engineering time to keep instrumentation versions current, and whichever backend you export to
Datadog

Datadog has the most complete Node story of the commercial set: wide library coverage in dd-trace, ESM support through its own loader hook, runtime metrics including event loop delay, and a profiler that correlates V8 CPU profiles to spans. Collection is a proprietary tracer loaded via --require or --import, shipping to a local Agent process rather than straight to the backend, so you get local buffering and host tagging for free. That profile-to-span correlation is the thing you are actually paying for — it is how you name the synchronous function that held the loop during a p99 spike. The trade is a multi-meter bill and a proprietary agent in your dependency graph, and the alternatives roundup covers the exits.
Pros
- ESM auto-instrumentation is supported through a maintained vendor loader hook, not a community experiment you pin yourself
- Reports event loop delay percentiles and utilization as first-class runtime metrics, tagged per process rather than per host
- V8 CPU profiles correlate to the span that was open, which is the only reliable way to find a blocking call that produces no span
- Library coverage is broad enough that a typical Express or Fastify service needs no manual spans on day one
Cons
- Bundled apps still produce nothing unless you mark instrumented packages external — the tracer cannot patch a
requirethat esbuild inlined away - Instrumentation is proprietary, so migrating means re-instrumenting rather than repointing an exporter
- Separate meters for hosts, custom metrics, profiling, logs and spans make the bill hard to predict for a cluster-mode service with many processes
Best for: Node teams running many services who want ESM and profiling handled for them and can absorb per-host pricing plus meter sprawl.
Pricing: Per-host subscription with independent meters for indexed spans, custom metrics, profiling, log ingest and retention; annual commitment discounts apply, and overage on any single meter can dominate the bill.
Dynatrace
Dynatrace injects OneAgent at the process level instead of asking you to edit an entry file, so the ordering problem that breaks most Node agents — tracer must load before pg — is handled outside your code entirely. In Kubernetes the operator can inject with no application change at all. For an estate where you cannot make every team add a --require flag that is a real advantage, and its automatic dependency mapping across processes is the strongest here. Enterprise-shaped in both price and setup.
Pros
- Process-level injection removes the “agent must load first” failure mode, including for services whose entry point you do not control
- ESM is handled by OneAgent rather than by a loader flag you have to register correctly per Node version
- Automatic topology and dependency mapping across a large multi-service Node estate without per-team instrumentation work
- Cluster-mode processes are discovered individually rather than needing you to add a worker-ID dimension by hand
Cons
- Deep runtime injection means a privileged agent and a much larger blast radius than a library you can read
- Instrumentation is entirely proprietary; nothing you configure is portable to another backend
- Setup and licensing are sized for enterprises, which makes it heavy for a handful of Node services
Best for: Large organisations with many Node services and no realistic path to getting every team to edit an entry file or bootstrap flag.
Pricing: Consumption-based across separate units for full-stack hosts, infrastructure-only hosts and data ingest and retention, typically under an annual contract with committed volume.
SigNoz
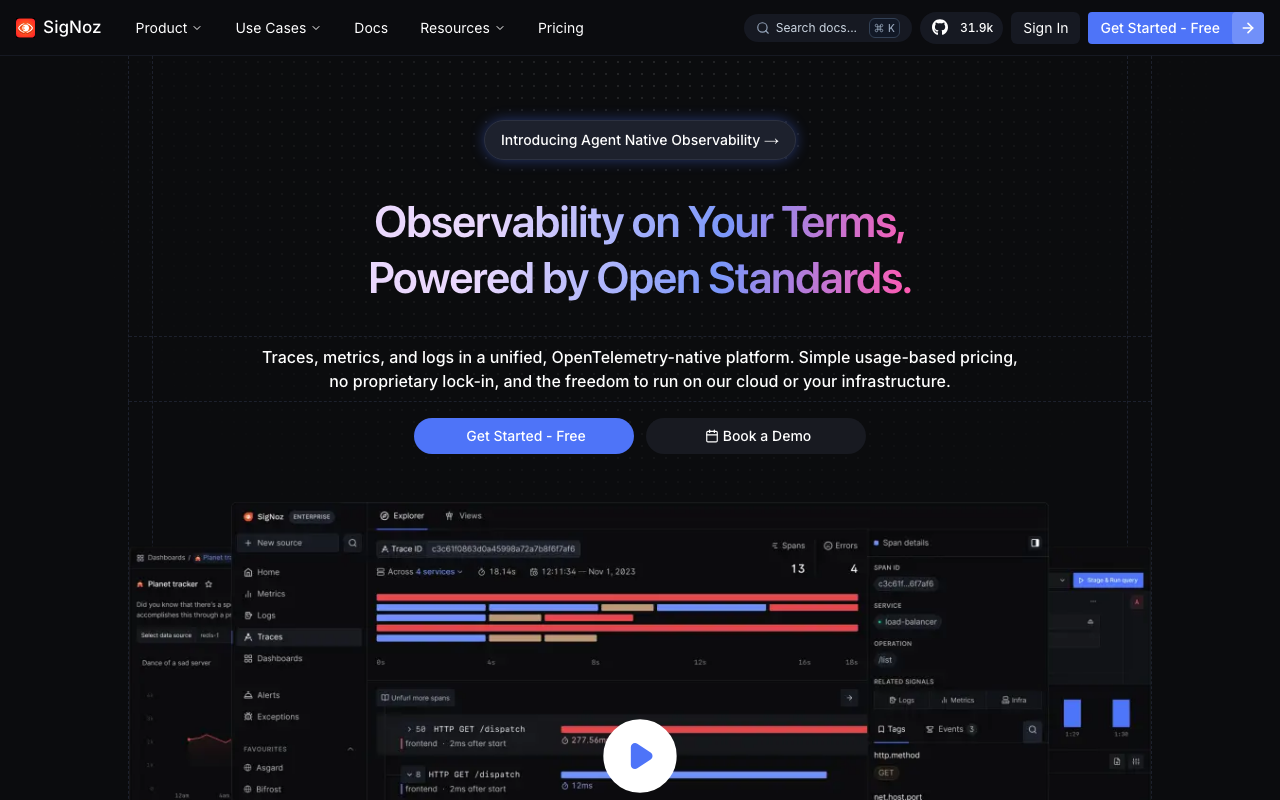
SigNoz is OpenTelemetry-native: you instrument with the standard OTel Node SDK, point the OTLP exporter at SigNoz, and get traces, metrics and logs together in ClickHouse. Because nothing proprietary sits in your process, ESM and async-context behaviour is exactly what the OpenTelemetry project documents — the same import-in-the-middle registration, the same AsyncLocalStorageContextManager. It runs self-hosted or as a managed cloud, and the instrumentation work is portable if you leave.
Pros
- ESM support is upstream OTel loader hooks, so its behaviour is documented and debuggable rather than vendor-internal
- Your
--importbootstrap, sampling config and manual spans stay valid if you move to any other OTLP backend - ClickHouse storage handles per-process and per-worker dimensions without the cardinality penalty that hurts on some usage-priced backends
- Self-hosting is a genuine option, which matters when Node services handle data that cannot leave your network
Cons
- You own the OTel version-range problem: an instrumentation package that silently stops patching after a dependency upgrade gives you missing spans and no error
- Node CPU profiling is not built in the way it is with Datadog, so finding the function that blocked the loop needs a separate tool
- Self-hosted ClickHouse is real operational work at high span volume
Best for: Teams that have already committed to OpenTelemetry instrumentation and want a backend that does not add a second patching layer on top.
Pricing: Open-source self-hosted at infrastructure cost only, plus a managed cloud priced on data ingested and retention period rather than per host.
Grafana
Grafana Cloud, or a self-run Mimir/Loki/Tempo/Pyroscope stack, suits teams already living in Grafana dashboards. It ingests OTLP directly, so the Node SDK wiring is the same as any other OTel backend, and Pyroscope adds continuous profiling that covers the CPU-bound blocking calls spans cannot show. The metrics backend handles high cardinality well, which matters when every cluster worker emits its own heap and loop-delay series. Self-hosting is four systems to operate — see the self-hosted stacks comparison.
Pros
- OTLP-native ingestion means ESM instrumentation is upstream OTel, with no vendor loader hook to keep in sync
- Pyroscope continuous profiling captures the blocking
JSON.parseor synczlibcall that never produced a span - High-cardinality metrics storage tolerates per-PID and per-worker-ID dimensions for cluster-mode services
- Same stack covers infrastructure and application signals, so Node runtime metrics sit beside node-level ones
Cons
- Four separate systems to run if you self-host, each with its own scaling and retention behaviour
- Trace-to-profile correlation requires deliberate wiring rather than arriving configured
- Cloud pricing meters each signal type separately, so a chatty Node fleet can surprise you on metric series count
Best for: Teams already fluent in PromQL and Grafana dashboards who want profiling and traces without adopting a proprietary Node agent.
Pricing: Managed cloud metered separately per signal — metric series, log volume, trace volume, profile volume — with a usage-based model and committed-use discounts; self-hosting trades that for infrastructure and engineering time.
Elastic
Elastic fits teams whose Node logs already sit in Elasticsearch. You can run its own Node agent or its OpenTelemetry distribution, which lets you standardise instrumentation without changing where data is stored. Its strength is correlation: taking a symbolicated stack trace from a transpiled TypeScript service and putting it next to the surrounding log lines from the same process, in the same index, without a cross-tool join.
Pros
- Two instrumentation paths — its own agent or an OTel distro — so you can adopt OTel semantics without a storage migration
- Stack trace and log correlation in one store is the fastest route from an unhandled rejection to the lines around it
- Source map handling is a supported build-step upload rather than something you improvise
- Self-managed and cloud deployments use the same instrumentation, which keeps a hybrid estate consistent
Cons
- Elasticsearch is heavy to operate at trace volume if you self-host, and index lifecycle management is a permanent chore
- The Node agent’s ESM story is thinner than the loader-hook support in the OTel SDK, so check it against your exact Node version
- Its value drops sharply if your logs are not already in Elasticsearch — otherwise you are adopting a search cluster to get an APM
Best for: Teams already running Elasticsearch for Node application logs who want traces in the same store rather than a second vendor.
Pricing: Resource-based subscription tied to the compute and storage of the deployment across tiers, with self-managed and cloud options and separate cost for hot versus frozen retention.
New Relic
New Relic has a mature Node agent with broad library coverage, distributed tracing, and runtime metrics including event loop and garbage collection detail. Its instrumentation follows the same module-patching model as everyone else, so the same ordering and bundling rules apply — it must load before your dependencies, and a bundled artifact needs externals marked. What sets it apart commercially is the pricing shape: data volume plus user seats rather than per host, which changes the arithmetic sharply for cluster-mode Node services running many processes per box.
Pros
- Data-plus-users pricing does not penalise running many Node processes per host, unlike per-host models
- Mature agent with runtime metrics covering event loop and GC behaviour rather than CPU alone
- Distributed tracing and errors land in one place, so an unhandled rejection is one click from the trace that produced it
- Supports both its own agent and OTLP ingest, so you are not forced to re-instrument to send data
Cons
- ESM support has historically lagged the OTel loader-hook path, so verify it against your Node version and module system before committing
- Seat-based cost grows with how many engineers actually need access, which fights the goal of making observability everyone’s job
- Proprietary agent means the same lock-in as any vendor tracer if you use it rather than the OTLP path
Best for: Node teams running many processes per host — cluster mode, worker pools — where per-host pricing is punitive and only a handful of engineers need full platform access.
Pricing: Combination of ingested data volume and per-user seats by access tier, rather than per host; the model rewards many small processes and penalises broad seat access.
Needs first-hand data: Measure startup cost and steady-state RSS for the same container image with no agent, with the OTel Node SDK, and with each vendor agent.
How to choose
Take your worst real request path — the one crossing HTTP, a queue and a worker — and instrument it with the plain OpenTelemetry Node SDK against a local collector. If the trace does not stitch together with upstream OTel, no vendor agent will fix it; you have a context propagation bug of your own and you need to know that before signing anything.
Then check three things in every candidate: does it produce spans in your built artifact rather than under ts-node, does it report loop delay percentiles and utilization per process, and can you group metrics by worker ID. Failing one is disqualifying.
Finally price it against your shape. Many small processes favour per-host pricing; few large ones favour the opposite. The APM tools hub lays the models out side by side.
| Tool | Instrumentation | ESM support | Profiling | Lock-in |
|---|---|---|---|---|
| Datadog | Proprietary agent | Vendor loader hook | Built-in, span-correlated | High |
| Dynatrace | Process-level injection | Handled by OneAgent | Built-in | High |
| SigNoz | Upstream OTel SDK | OTel loader hooks | Via integrations | Low |
| Grafana | OTel / Prometheus | OTel loader hooks | Pyroscope | Low |
| Elastic | Own agent or OTel distro | Both paths | Built-in | Medium |
| New Relic | Own agent or OTLP | Verify per Node version | Built-in | Medium |
| OpenTelemetry SDK (standard, not a product) | You wire it | Loader hooks, DIY | Bring your own | None |
Needs first-hand data: Record trace completeness — the share of logical requests covered by one unbroken trace — under each candidate across the HTTP → queue → worker path.
Frequently asked questions
Does OpenTelemetry work with ESM in Node?
Yes, through loader hooks rather than require patching. You register import-in-the-middle via an --import bootstrap or the experimental loader flag depending on your Node version, and it must run before any application module loads. Test it against your exact Node version rather than assuming.
Why do my traces stop at a background job?
Async context does not cross a process or broker boundary — the queue message is a new execution with no parent. Inject the W3C traceparent into the job payload on enqueue and activate it in the consumer. Custom queue wrappers always need this by hand.
Can I run a vendor agent alongside OpenTelemetry?
Generally not safely. Two libraries patching the same functions give you double-counted spans, broken context, or crashes. Pick one instrumentation layer, and if you want vendor features on top of OTel, choose a backend that ingests OTLP natively.
Related reading
- Best APM tools for developers — the full landscape and how pricing models differ.
- Best OpenTelemetry-native observability platforms — backends that take OTLP without a proprietary agent.
- Best APM for serverless and edge functions — where bundling breaks Node auto-instrumentation hardest.
- Best APM for Kubernetes workloads — per-pod attribution and why the bill scales with pods.