Most “Datadog alternatives” lists are the same twelve logos in a different order, which helps nobody. The useful question isn’t what else exists — it’s why you’re leaving, because the answer determines which replacements are even relevant.
There are three reasons teams leave, and they’re not interchangeable. One team is leaving because the invoice tripled and nobody can explain the delta. Another is leaving because a single tag change caused a custom-metrics bill that dwarfs their compute spend. A third is leaving because they don’t want their operational nervous system living in a proprietary format they can’t run anywhere else.
Those three teams should shortlist three different sets of tools. A cost-driven team that migrates to another closed SaaS platform on a different meter has solved the immediate problem and reproduced the structural one. A lock-in-driven team that picks the cheapest managed vendor hasn’t addressed their reason at all.
So: figure out which of the three you are first.
Key takeaways
- Cost shock, cardinality billing, and lock-in are three different problems with three different answers.
- If cardinality is your issue, look at platforms whose storage was designed for high-cardinality data rather than ones that just charge less per series.
- If lock-in is your issue, the answer is OpenTelemetry instrumentation plus a backend you could self-host, not a different SaaS logo.
- Datadog’s integration catalog and out-of-box polish are genuinely hard to replace. Budget engineering time for what you’re giving up.
Reason one: cost shock and unpredictable bills
If your complaint is the size and volatility of the invoice, you need a vendor whose pricing meter matches how your system actually grows.
Datadog bills per host, per product. Enable APM, logs, RUM, synthetics, and database monitoring across a fleet and you’re multiplying two growing numbers. Add elastic Kubernetes nodes that scale up under load and the per-host meter moves for reasons unrelated to how much you’re observing.
The alternatives that address this directly change the shape of the meter: price on data volume rather than host count, give you a self-host escape hatch so the ceiling is hardware you already own, or tier telemetry so low-value data doesn’t cost what queried data costs. Grafana Cloud, SigNoz, Coralogix, Middleware, and Uptrace all attack it from one of those three angles.
Needs first-hand data: Export twelve months of Datadog invoices and break the total into per-product lines. Then model each shortlisted vendor’s meter against your actual host, log, and span volumes for those same months. Without that table you’re comparing marketing claims.
Reason two: cardinality and custom metric billing
If a tag change moved your bill more than a traffic spike did, your problem is cardinality, and most alternatives don’t solve it — they just charge less for the same broken shape.
Here’s the mechanism. Traditional time-series databases store one series per unique combination of metric name and label values. Add a label with 10,000 distinct values and you’ve created 10,000 series from one metric. Datadog bills custom metrics on that count, so the cost is a function of your tagging discipline, not your traffic. Every team eventually has an engineer add customer_id or endpoint_path to a metric with good intentions and no idea of the billing consequence.
The genuine answers are platforms whose storage model was designed around this — wide-event storage that treats high cardinality as the normal case, or governance controls that shape and aggregate metrics before they reach storage at all. Honeycomb, Chronosphere, and Last9 sit in that category.
The judgment call: if you have a cardinality problem, do not move to a cheaper tool with the same per-series model. You’ll be back in eighteen months. Either move to storage that handles wide data natively, or adopt a platform that gives you enforcement controls, or fix the tagging discipline internally — and honestly, do the last one regardless.
Needs first-hand data: Pull your top 20 custom metrics by series count and record how many distinct values each label contributes. Nine times out of ten, two or three labels account for most of the cost, and that list changes which category of tool you need.
Reason three: getting out of proprietary lock-in
If lock-in is your reason, the fix is at the instrumentation layer, not the vendor layer. Changing SaaS providers without changing that is just moving the lock.
Instrument with OpenTelemetry. That single decision means your traces, metrics, and logs leave your applications in a vendor-neutral format, and swapping backends becomes a collector configuration change rather than a code rewrite. Everything below assumes you’ve done that.
Then pick a backend you could, in principle, run yourself. SigNoz is open source and self-hostable. Grafana’s Mimir, Loki, and Tempo are open source and self-hostable. Elastic gives you an APM and log platform you can run on your own cluster, with the operational weight of Elasticsearch that comes with it.
The point isn’t that you will self-host. The point is that being able to is what gives you a negotiating position at renewal. A managed vendor whose software you could run yourself has a natural ceiling on how much they can raise your price.
There’s a second-order benefit people miss: open backends force you to understand your own telemetry. When a vendor curates your dashboards, nobody on the team can explain which metrics matter or why an alert threshold is what it is. When you assemble it, someone had to decide. That knowledge is what makes on-call work at 3am, and it’s the part that doesn’t transfer when you switch vendors.
For the full menu, the open source APM tools guide covers what the ecosystem actually delivers, and self-hosted observability stacks covers the operational load you’d take on.
What you will actually miss about Datadog
Be honest with yourself about this before you commit, because underestimating it is how migrations stall halfway.
The integration catalog. Hundreds of first-party integrations, each with a curated dashboard where someone already decided which metrics matter. On most alternatives you deploy an exporter and adapt a community dashboard. Multiply that by every managed service you run.
Cross-product navigation. Clicking from an infrastructure spike to the traces in that window to the logs of that specific container works without configuration. Assembling equivalent correlation elsewhere is possible and takes work.
Breadth under one login. Synthetics, RUM, security signals, CI visibility, database monitoring — replacing Datadog often means replacing one bill with three or four tools, three or four onboarding processes, and three or four vendor relationships. That’s a real operational tax even when the arithmetic favors it.
Alerting maturity. Composite monitors, anomaly detection, and sensible defaults for no-data and flapping conditions are more polished than most alternatives out of the box.
Datadog

The incumbent you’re leaving, and worth stating plainly so the comparison is honest. Datadog is a single integrated proprietary platform covering infrastructure, APM, logs, RUM, synthetics, security, and CI visibility, collected by one agent with hundreds of named first-party integrations. Because the vendor owns every layer, correlation across products needs no configuration — and because every layer is proprietary, none of what you build inside it comes with you when you leave.
Pros
- Largest curated integration catalog in the category, with dashboards and default monitors already opinionated
- Zero-configuration navigation between infrastructure, traces, and logs
- Genuinely broad product surface under one login and one vendor relationship
- Mature alerting with composite monitors and sensible no-data and flapping defaults
Cons
- Per-host, per-product billing multiplies two growing numbers, and elastic Kubernetes nodes move the meter for reasons unrelated to observability
- Custom metrics billed by unique time series means a tagging decision, not a traffic change, can dominate the invoice
- Dashboards, monitors, query syntax, and history are Datadog-only, so an exit is a rebuild
Best for: Teams that need broad coverage of managed cloud services working on day one and have someone owning cost governance as a permanent job.
Pricing: Per-host subscription charged separately per enabled product, with additional meters for custom metrics by unique series count, indexed log events, APM spans, and containers.
Grafana Cloud
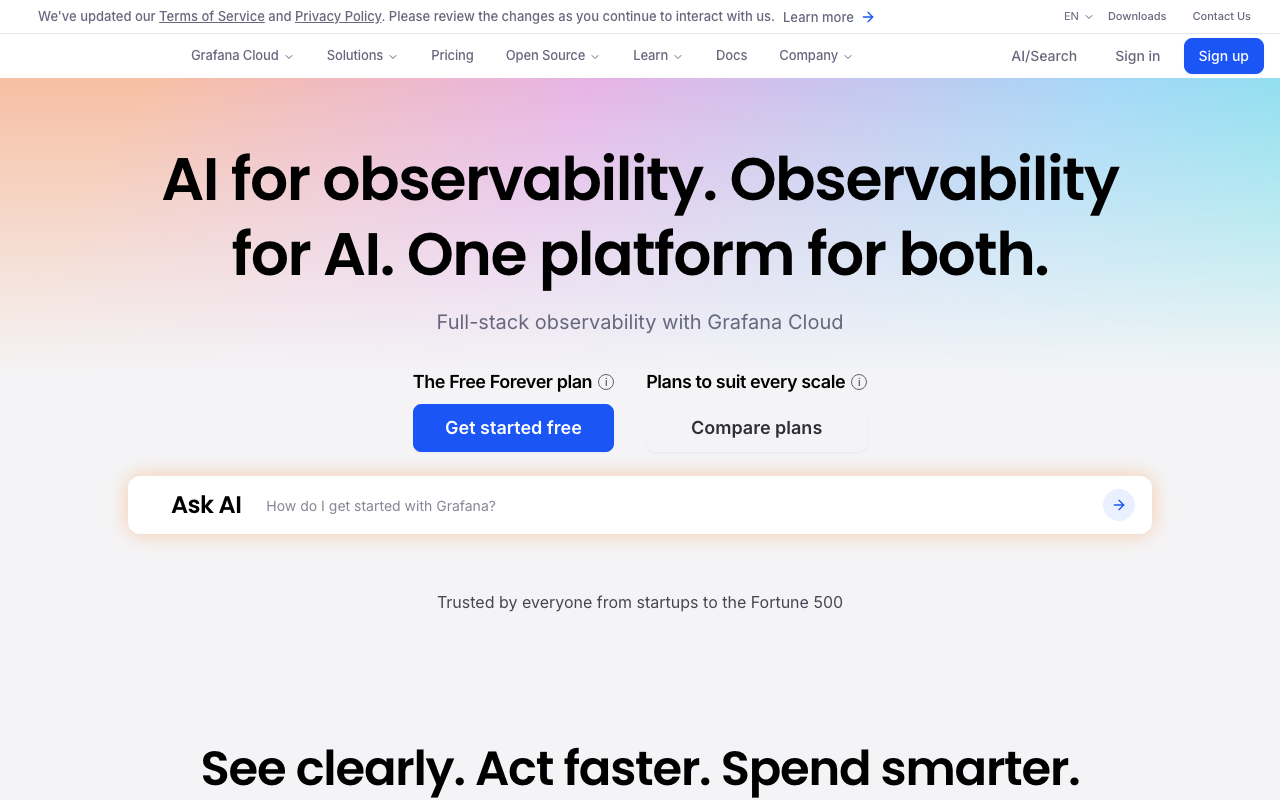
Grafana Cloud prices on data volume with generous handling of Prometheus metrics, and — more importantly — you can move to self-hosted Mimir, Loki, and Tempo when volume makes SaaS uneconomic, using the same queries and dashboards. That optionality is itself a cost control: a vendor whose software you could run yourself has a ceiling on how much they can raise your price. The stack is assembled rather than integrated, so correlation between metrics, logs, and traces is configured through exemplars and trace-ID links rather than being implicit.
Pros
- Every component is open source and self-hostable, making the exit a data-transfer project rather than a rebuild
- Loki’s index-light log design behaves very differently at volume from indexed-event pricing
- PromQL and LogQL are transferable skills, and Prometheus-emitting infrastructure needs no translation layer
- Dashboards and alert rules move unchanged between Grafana Cloud and a self-hosted stack
Cons
- Out-of-box coverage depends on community exporters and dashboards of uneven quality that you maintain
- Cross-signal correlation is a configuration project, not a default
- Needs a named platform owner with real time, or the assembled stack decays
Best for: Cost-driven teams that are already Prometheus-native and want a credible self-host escape hatch rather than just a cheaper invoice.
Pricing: Usage-based on metric series, log and trace ingest, and retention tier, with no per-product multiplier against host count. The off-invoice cost is engineering hours.
SigNoz
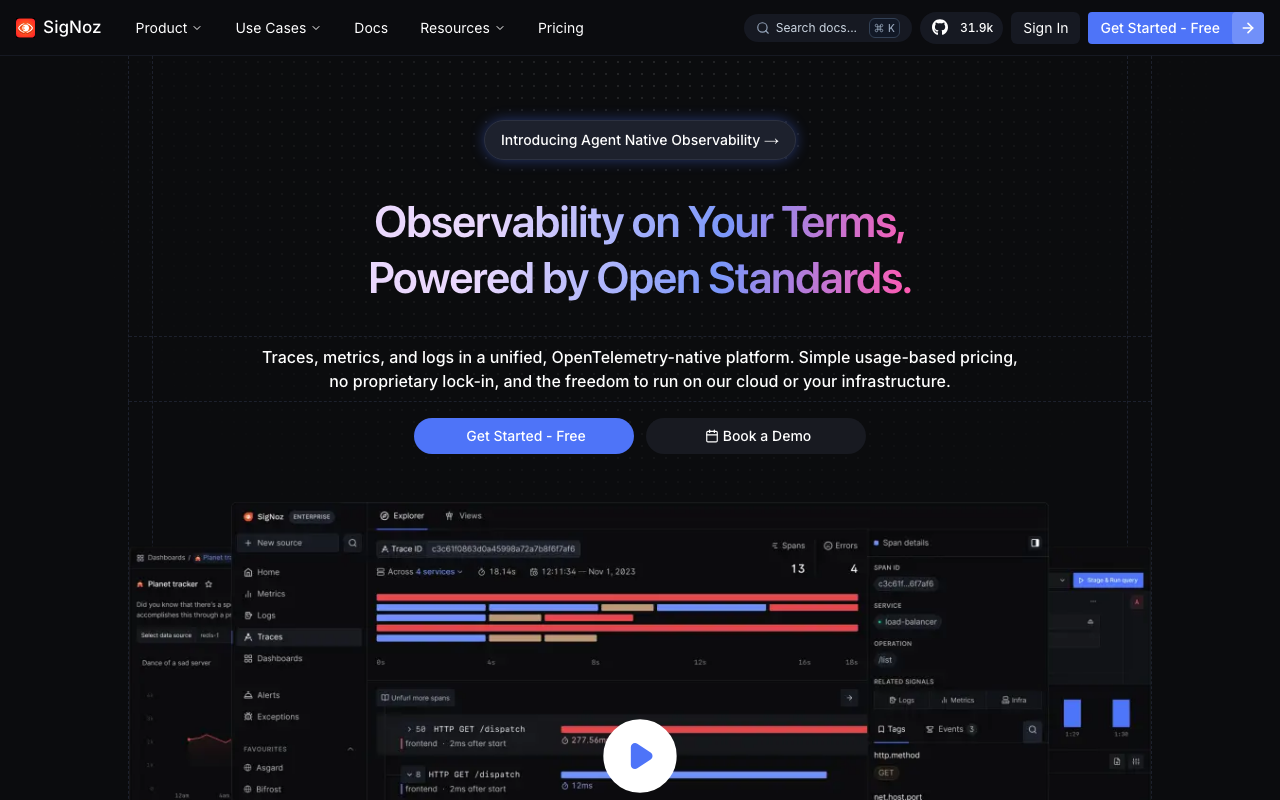
SigNoz is OpenTelemetry-native and open source, backed by ClickHouse. It’s the cleanest answer for a team that wants one tool for traces, metrics, and logs without a per-host multiplier, and the self-hosted option means the ceiling is your hardware rather than a seat count. Because it was built around OTLP rather than retrofitted to accept it, instrumentation you write for SigNoz is instrumentation you can point anywhere else later.
Pros
- One platform for all three signals with a single query surface, so you don’t split one bill into three tools
- OpenTelemetry-native by design rather than by translation layer, keeping instrumentation portable
- ClickHouse-backed columnar storage handles high-volume trace and log data efficiently
- Managed cloud and self-hosted are the same software, so the deployment decision stays reversible
Cons
- Integration breadth is far narrower than Datadog’s catalog; managed cloud services need exporter work
- Self-hosting means owning ClickHouse capacity, retention, and upgrades
- Adjacent categories like synthetics, RUM, and security signals are thin or absent compared with an all-in-one platform
Best for: Teams whose complaint is the per-host meter rather than the product, and who want one consolidated tool with a credible self-host path.
Pricing: Usage-based on ingested telemetry volume and retention for the managed offering, with no per-host or per-seat multiplier; self-hosting trades the invoice for infrastructure and operations time.
Coralogix
Coralogix approaches cost from a different direction: routing telemetry into different tiers based on how you’ll use it, so high-volume low-value data doesn’t get priced like data you query daily. Data destined for compliance archives, data you might query occasionally, and data you dashboard continuously are treated as economically distinct. If logs dominate your Datadog bill, that model is the one worth understanding in detail.
Pros
- Tiered telemetry routing decouples cost from raw volume, which is the dominant term for log-heavy estates
- Lets you keep data you would otherwise drop, because archive-tier retention is not priced like queryable storage
- Full observability coverage rather than logs only, so it can consolidate more than one tool
Cons
- The tiering model needs designing and maintaining — misclassified data means either surprise cost or missing data during an incident
- Proprietary platform, so it solves the cost reason but not the lock-in reason
- Additional conceptual overhead for teams that just wanted a simpler bill
Best for: Log-dominated estates where the invoice is driven by volume you can classify by how often you actually query it.
Pricing: Volume-based, differentiated by how data is tiered for querying, monitoring, or archival, so the effective rate depends on your routing design rather than on host count.
Middleware
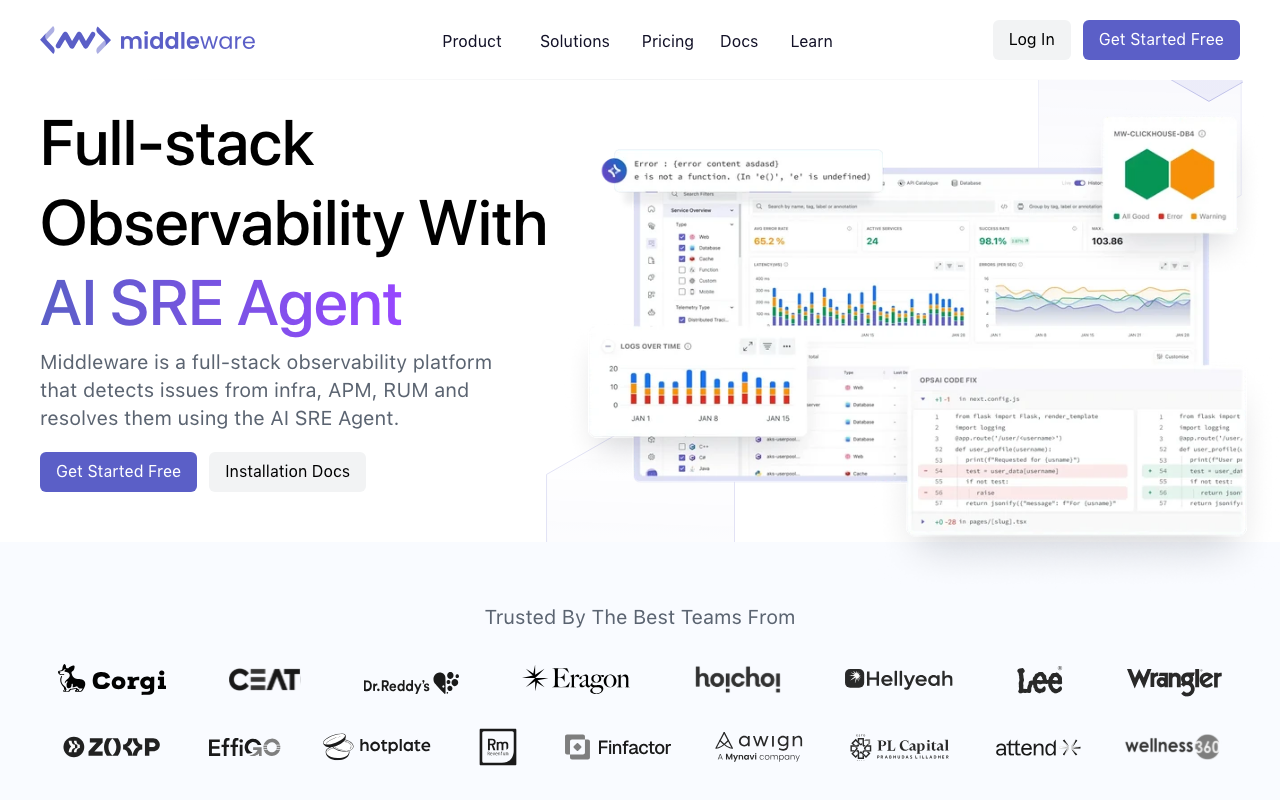
Middleware targets the “full-stack observability without enterprise pricing” segment, built on OpenTelemetry, covering infrastructure, APM, logs, and real user monitoring in one place. It is aimed at small to mid-size teams whose primary complaint is the invoice rather than a specific capability gap, and it keeps instrumentation OTLP-shaped so the decision is not permanent.
Pros
- OpenTelemetry-native ingest keeps your instrumentation portable if you outgrow it
- Covers several signal types in one product, so leaving Datadog doesn’t immediately mean three vendors
- Positioned and priced for teams below enterprise scale, which is where per-host multipliers hurt most
Cons
- A smaller company with a correspondingly smaller integration library and ecosystem
- Depth in any individual category trails specialist tools
- Managed-only posture means it addresses cost but not lock-in
Best for: Small to mid-size teams that want most of Datadog’s shape at a meter that doesn’t multiply against host count.
Pricing: Usage-based on ingested data volume across signals rather than per host per product.
Uptrace
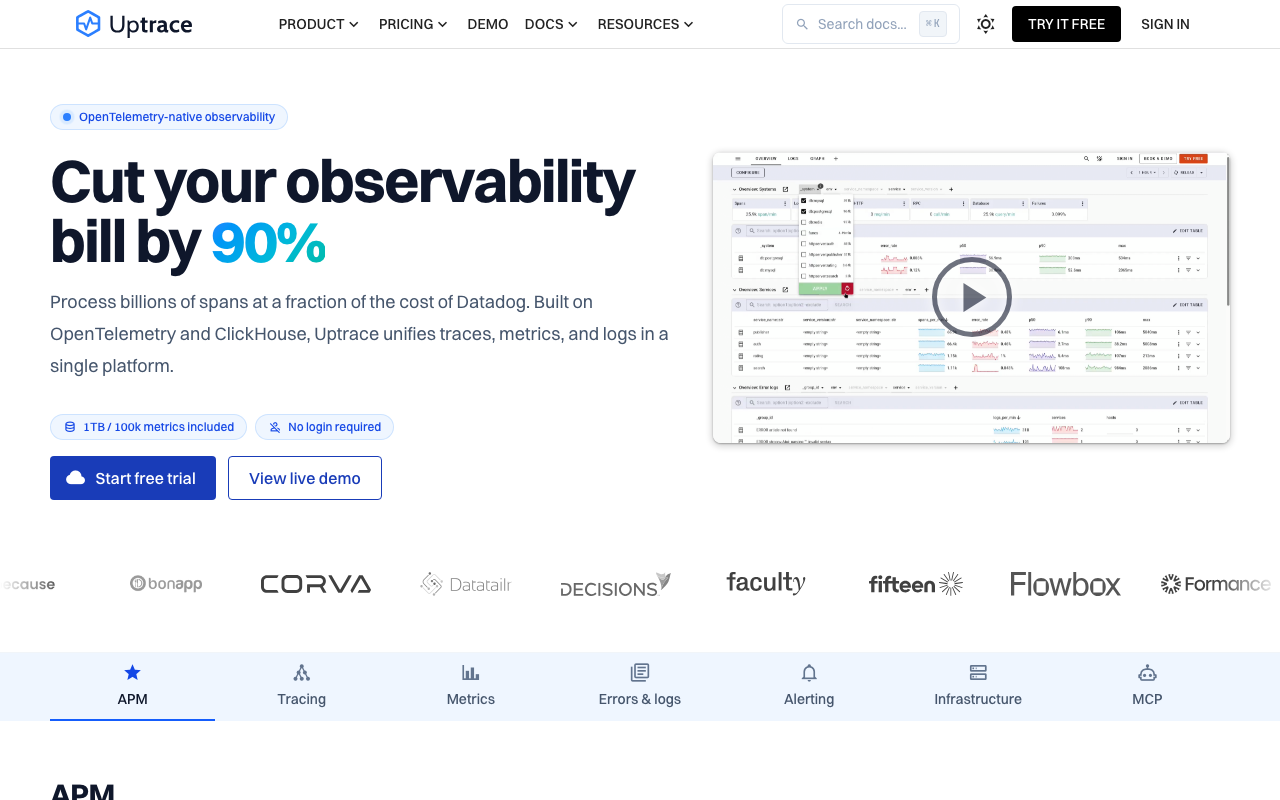
Uptrace is an OpenTelemetry-native platform covering traces, metrics, and logs, available both managed and self-hosted, and deliberately lighter to operate than a full assembled stack. For a team whose entire complaint is the meter, it is a short path from Datadog to something with predictable economics and a runnable-yourself backend.
Pros
- OTLP-first, so migrating instrumentation is a collector config change rather than a code rewrite
- Considerably lighter operational footprint than running Mimir, Loki, and Tempo yourself
- Self-host option puts the cost ceiling on hardware you control
Cons
- Narrower feature surface and smaller ecosystem than the established platforms
- Fewer curated integrations, so managed-service coverage is exporter work
- Less suited to large estates where governance and RBAC depth matter
Best for: Small to mid-size teams that want an OpenTelemetry backend they could run themselves without taking on a full Grafana stack.
Pricing: Usage-based on ingested spans, metrics, and logs for the managed service; self-hosting converts that to infrastructure cost.
Honeycomb
Honeycomb treats high cardinality as the normal case rather than an exception. It stores wide events with arbitrary attributes and lets you slice by any of them at query time, which is the opposite of pre-aggregating into metrics and hoping you picked the right dimensions in advance. If your debugging questions sound like “which customers on which build in which region are slow,” this is the architectural fit rather than a cheaper version of what you already have.
Pros
- Wide-event storage means adding an attribute costs storage, not a per-series billing explosion
- Query-time slicing by any dimension removes the need to predict useful dimensions before an incident
- Genuinely different debugging workflow — exploratory rather than dashboard-first
- Strong OpenTelemetry alignment, so instrumentation stays portable
Cons
- The event-oriented model is a real relearning cost for teams whose mental model is dashboards and pre-aggregated metrics
- Not a broad platform: infrastructure monitoring, synthetics, and security signals are not the product
- Proprietary managed service, so it addresses cardinality but not lock-in
Best for: Teams whose hardest questions are per-customer, per-build, or per-endpoint slices that a pre-aggregated metric can’t answer.
Pricing: Volume-based on events ingested and retention, rather than on unique time series, which is precisely why the cardinality dynamic changes.
Chronosphere
Chronosphere attacks cardinality from the control side: it’s built for organizations drowning in Prometheus-style metric cardinality, with aggregation and shaping controls that let a platform team cap what any service can emit before it hits storage. That’s a governance product as much as an observability product, and it’s aimed squarely at large orgs where the metric explosion is organizational rather than technical.
Pros
- Shapes and aggregates metrics before storage, so a single team’s tagging mistake can’t move the whole bill
- Gives a platform team enforceable policy rather than a wiki page about tagging discipline
- Prometheus-compatible, so existing queries and dashboards largely carry over
- Built for scale where per-service metric budgets are a real organizational need
Cons
- Aimed at large organizations; the governance layer is overhead a small team doesn’t need
- Enterprise procurement posture rather than a self-serve signup
- Solves metrics governance specifically, not the full breadth of what Datadog covers
Best for: Large organizations where metric cardinality growth is an organizational coordination problem across many teams, not a single bad label.
Pricing: Enterprise agreements based on the volume of metrics persisted after shaping, which is the point — you pay for what survives your aggregation rules, not what services emit.
Last9
Last9 sits in similar territory with a focus on high-cardinality metrics at a predictable cost, targeting teams that have outgrown vanilla Prometheus but don’t want the per-series billing shock. It’s Prometheus- and OpenTelemetry-compatible, so it slots into an existing metrics pipeline rather than requiring a new instrumentation approach.
Pros
- Designed for high-cardinality metric workloads without per-series billing dynamics
- Compatible with Prometheus and OpenTelemetry, so existing scrape and remote-write setups largely carry over
- Positioned for teams past vanilla Prometheus scale but short of enterprise governance needs
Cons
- Metrics-centric, so logs and traces need another tool or a separate part of the stack
- Smaller ecosystem and integration library than incumbent platforms
- Managed service, so the lock-in reason is only partly addressed by protocol compatibility
Best for: Teams that have outgrown self-managed Prometheus on cardinality and want predictable cost without adopting a full governance platform.
Pricing: Usage-based on metric volume and retention rather than on unique series count, which is what makes cardinality economically boring.
Elastic
Elastic gives you an APM and log platform you can run on your own cluster, with the operational weight of Elasticsearch that comes with it. For lock-in-driven teams this is the option that keeps everything — logs, APM data, and search — inside infrastructure you control, queryable with a stack many organizations already run for other reasons. The tradeoff is explicit: you are adopting Elasticsearch operations along with the observability product.
Pros
- Fully self-hostable, so data residency, air-gapped, and regulatory constraints are satisfiable
- Logs, APM, and search in one platform, with a query surface many teams already know
- Strong fit when log volume dominates and Elasticsearch expertise already exists in-house
Cons
- Elasticsearch operations — cluster sizing, shard management, upgrades — become someone’s ongoing job
- Heavier to run than purpose-built columnar backends at comparable volumes
- APM depth trails dedicated APM vendors in tracing ergonomics
Best for: Lock-in-driven or regulated teams with existing Elasticsearch expertise and log volume large enough to justify owning the cluster.
Pricing: Subscription tiers for the managed offering based on deployment size and retention; self-managed shifts cost entirely to infrastructure and operations headcount.
How to choose
Start from the reason, not the shortlist. Break your last twelve invoices into product lines, name the single largest line, and read across.
| Your reason for leaving | What to look for | Where to start |
|---|---|---|
| Cost shock, unpredictable bills | A meter that tracks data volume rather than host count, plus a self-host escape hatch | Grafana Cloud, SigNoz, Coralogix, Middleware, Uptrace |
| Cardinality and custom metric billing | Storage designed for wide, high-cardinality data, or enforcement controls before ingest | Honeycomb, Chronosphere, Last9 |
| Proprietary lock-in | OpenTelemetry instrumentation plus a backend whose software you could run yourself | SigNoz, Grafana stack, Elastic |
Then run this over two weeks.
- Break your last twelve invoices into product lines. Name the single largest line. That’s your reason, and it may not be the one you assumed.
- Map your reason to a category using the table above. Shortlist no more than three tools from that category.
- Inventory what you’d have to rebuild: dashboards, monitors, custom metric names, and every code site calling a Datadog SDK. This inventory is the size of the project.
- Migrate instrumentation to OpenTelemetry first, while still on Datadog. Datadog ingests OTLP, so this de-risks the move and is useful even if you stay.
- Run one real service dual-shipped to Datadog and your top candidate for two weeks. Compare during an actual incident, not a demo.
- Decide what you’re consciously giving up and write it down. If nobody can name the losses, the evaluation wasn’t honest.
Needs first-hand data: During the dual-ship trial, have the same on-call engineer resolve one real incident in each tool and record time-to-root-cause. That number decides whether the savings are worth the friction.
Frequently asked questions
What is the closest drop-in replacement for Datadog?
There isn’t one, and any list claiming otherwise is selling something. Datadog’s product surface is unusually wide, so replacements are typically a combination: an OpenTelemetry-native APM plus something for logs plus something for synthetics. Plan for a portfolio, not a swap.
Should I self-host to save money?
Only if you have a platform team with capacity to own it. Self-hosting converts a predictable invoice into engineering time plus on-call responsibility for the system you use to debug other systems. At large data volumes the arithmetic is compelling; at small volumes it usually isn’t.
Will moving to OpenTelemetry break my existing Datadog setup?
No — Datadog ingests OTLP, so you can migrate instrumentation while staying on Datadog and validate that traces still look right. That’s exactly why it’s the correct first step: it’s reversible, and it decouples the two hardest parts of the migration.
How do I stop the cardinality problem from following me?
Put controls at the collector, not in policy documents. Drop or aggregate high-cardinality labels in the OpenTelemetry Collector before they reach storage, and treat adding a label to a metric as a change that needs review. Tools help, but the discipline is what actually holds.
Related reading
- Best APM tools for developers — the full landscape and where each category fits.
- Grafana Cloud vs Datadog — the same decision framed as open standards versus managed polish.
- Datadog vs New Relic vs Dynatrace — how the three big commercial platforms differ on pricing model.
- Best open source APM and observability tools — what the open ecosystem covers and where it stops.
- Best OpenTelemetry-native observability platforms — how to make the backend decision reversible.
- Best APM for Kubernetes workloads — why the bill scales with pods, not traffic.