Teams evaluate Grafana Cloud against Datadog as if it were a feature bake-off. Does it have distributed tracing? Yes. Log search? Yes. Alerting? Yes. Both boxes get ticked, someone points at a price sheet, and the decision gets made on the wrong axis entirely.
The actual question is: when you want to leave, what comes with you? Grafana’s stack is assembled from open components with open query languages — Prometheus, Loki, Tempo, Pyroscope, and OpenTelemetry ingest. Your metrics are Prometheus time series, your alert rules are PromQL, your dashboards are JSON referencing those queries. You can run the identical components yourself, on your own hardware, using the same queries. Datadog is a proprietary managed product where the storage format, the query syntax, and the dashboard model exist only inside Datadog.
That’s not a knock on Datadog. Proprietary is what lets it be as polished as it is. But it means the choice you’re making is a durable one, and the cost of being wrong is measured in quarters of engineering time.
Key takeaways
- Grafana Cloud keeps your data and queries in open formats you can run yourself; Datadog does not, by design.
- Datadog’s integration catalog and out-of-box dashboards are meaningfully ahead. You will rebuild some of that by hand on Grafana.
- PromQL and LogQL are transferable skills; Datadog’s query syntax is a Datadog-only skill.
- Budget the Grafana path in engineering hours, not just subscription dollars — that’s where the real comparison lives.
Frame it as a lock-in decision
The feature gap between these two closes every year. The portability gap does not, because it is architectural rather than a matter of roadmap.
Grafana Cloud is a hosted version of software you can download. Grafana Mimir stores Prometheus-compatible metrics, Loki stores logs, Tempo stores traces, and Grafana itself renders dashboards over all of them. Every one of those is available to self-host. That means a migration off Grafana Cloud is a data-transfer and operations problem — hard, but well-defined, and your dashboards and alert rules survive the move essentially unchanged.
Datadog is a single integrated product. Your dashboards are Datadog dashboards, your monitors are Datadog monitors, your metric queries use Datadog’s syntax, and your historical data lives in Datadog’s storage. You can export dashboard definitions via API, but they’re Datadog JSON describing Datadog widgets querying Datadog metrics. Nothing on the other side of a migration reads that file.
The Prometheus exposition format and PromQL sit underneath the Grafana side of this, and that matters more than it looks. Prometheus is the de facto standard for Kubernetes metrics. Nearly every infrastructure component ships a /metrics endpoint. When you instrument against Prometheus and OpenTelemetry, you’re instrumenting against something a dozen vendors can ingest — including Datadog, which accepts both.
That’s the escape hatch worth knowing about: instrument with OpenTelemetry and Prometheus regardless of which backend you pick. Then the backend is a rental decision, not a marriage. More on that in the OpenTelemetry-native platforms guide.
Where the capability gap actually is
Out-of-box coverage. This is not close, and pretending otherwise wastes your time.
Datadog ships hundreds of integrations where you enable a checkbox and get a curated dashboard, sensible default monitors, and metric names that match the vendor’s own terminology. Postgres, RDS, Kafka, Elasticache, nginx, Cloudflare, Stripe — someone at Datadog already thought about which of the forty available metrics matter and put those six on a dashboard.
On Grafana Cloud, the equivalent path is usually: deploy an exporter or the OpenTelemetry Collector with the right receiver, import or adapt a community dashboard, then tune it. The community dashboard ecosystem is large and often good. It is also inconsistent — dashboards vary in quality, some assume label conventions you don’t use, and some are stale. You will spend real time on this.
The second gap is coherence. Datadog’s products were built to link to each other: click a spike on an infrastructure graph, land on the traces from that window, jump to the logs of the specific container. Grafana’s equivalent works, and correlation between Mimir, Loki, and Tempo has gotten much better through exemplars and trace-ID links, but it needs configuring. Datadog needs zero.
Third, alerting sophistication and anomaly detection are more mature and easier to configure in Datadog. Grafana’s unified alerting is capable and improving, and it’s Prometheus-rule-compatible, which is exactly the portability point above — but “capable and portable” is a different sales pitch from “works well on day one.”
Needs first-hand data: Pick the five services you actually page on. Count the hours to get each to a production-quality dashboard plus alerts on both platforms, including the time to find and fix a community dashboard. That ratio is the entire Grafana premium.
The query language difference is a hiring decision
PromQL and LogQL are industry-standard skills. Datadog’s query syntax is not.
PromQL is a real query language with a learning curve — rate windows, histogram_quantile, and the difference between counters and gauges trip up everyone at first. But it’s the same language used by self-hosted Prometheus, Thanos, Mimir, VictoriaMetrics, and Cortex, and it’s what most Kubernetes-native tooling speaks. An engineer who learns it carries it to their next job and their next employer’s stack. LogQL is deliberately PromQL-shaped, so log queries feel like metric queries with a filter stage.
Datadog’s query builder is easier to start with. The UI guides you, the syntax is simpler, and a new engineer builds a useful graph faster. The tradeoff is that the skill is non-transferable, and complex queries eventually hit the ceiling of what the builder expresses, at which point you’re working around the language rather than with it.
If you run Kubernetes, this is close to decided already. Your cluster is emitting Prometheus metrics whether you like it or not, and your engineers are going to learn PromQL for kubectl-adjacent tooling regardless. The Kubernetes APM guide goes deeper on why per-host billing and Prometheus-native metrics interact badly.
What migration actually involves in each direction
Leaving Grafana Cloud is a well-defined project. Leaving Datadog is a rewrite.
Off Grafana Cloud, you’re standing up Mimir, Loki, and Tempo (or a compatible backend), repointing your collectors and remote-write targets, and moving dashboard JSON that mostly just works because the queries are still PromQL against still-Prometheus data. Alert rules are Prometheus rules and port directly. Historical data can be backfilled or left behind, and you can run both in parallel during the cutover because both speak the same protocols. The hard parts are operational: object storage sizing, compaction, retention, and someone being on call for the observability stack itself.
Off Datadog, every dashboard is rebuilt by hand or by script against different metric names. Every monitor is retranslated into a different alerting language with different semantics for no-data and flapping. Every custom metric emitted through a Datadog SDK, every StatsD-style call in your code, and every dd.trace annotation is code that changes. Historical data does not come with you — you either run Datadog in parallel until the retention window rolls off, or accept a gap in the record.
Needs first-hand data: Count your Datadog assets — dashboards, monitors, custom metric names, and code sites calling a Datadog SDK. That inventory is the honest size of an exit project and most teams have never run the count.
Grafana Cloud
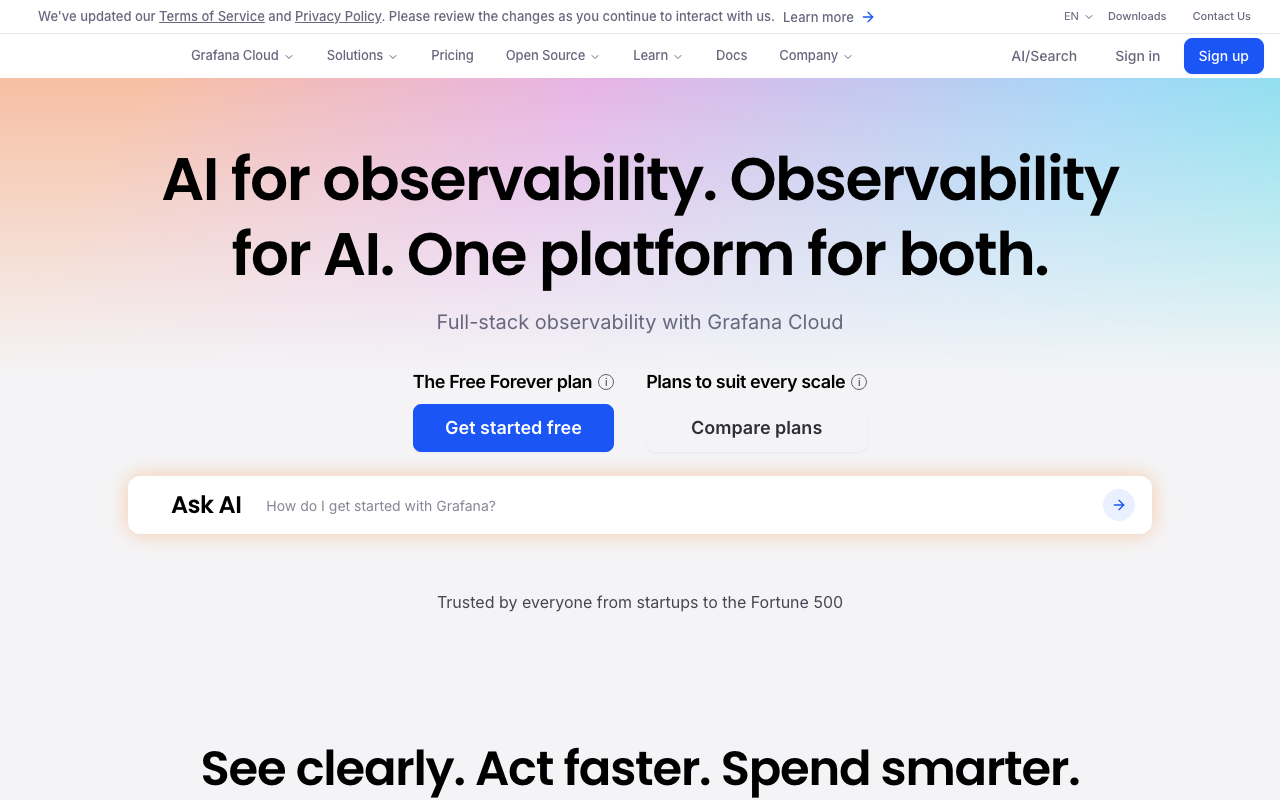
Grafana Cloud is a managed hosting of open source components you could equally run yourself: Mimir for Prometheus-compatible metrics, Loki for logs, Tempo for traces, Pyroscope for continuous profiling, and Grafana as the query and dashboard layer over all of them. Collection is via Prometheus scraping, remote write, the Grafana Agent, or the OpenTelemetry Collector — all open protocols. The architectural consequence is that nothing you build is trapped: dashboards are JSON over PromQL, alert rules are Prometheus rules, and both run unchanged against a self-hosted stack. Loki’s index-light design in particular changes log economics, since it indexes labels rather than full log content.
Pros
- Every component is open source and self-hostable, so leaving is a data-transfer project rather than a rebuild
- PromQL, LogQL, and TraceQL are transferable skills your engineers likely already have if you run Kubernetes
- Native fit for Prometheus-emitting infrastructure — no translation layer between what your cluster emits and what the backend stores
- Loki’s index-light architecture handles high log volume without indexed-event pricing dynamics
Cons
- Out-of-box coverage relies on community exporters and community dashboards of inconsistent quality; you will adapt and maintain them
- Cross-signal correlation works but must be configured — exemplars, trace-ID links, and data source wiring are your job
- Needs a named platform owner with actual time; unmaintained assembled stacks decay into unmaintained dashboards
Best for: Prometheus-native teams with real platform engineering capacity who value portability enough to spend engineering hours buying it.
Pricing: Usage-based on data volume across metrics series, log and trace ingest, and retention tier, with no per-product multiplier against host count. The genuine cost line is off-invoice: engineering hours to assemble and maintain what a curated catalog would ship for you.
Datadog

Datadog is a single integrated proprietary product spanning infrastructure, APM, logs, RUM, synthetics, security, and more. Collection is agent-based with hundreds of named first-party integrations, and the storage format, query syntax, and dashboard model are all Datadog’s own. That closed design is exactly what funds the polish: because the vendor controls every layer, cross-product navigation and curated defaults work without configuration. It also means everything you build inside it is an asset that exists only inside it.
Pros
- The largest curated first-party integration catalog, each with dashboards and default monitors someone already thought about
- Cross-product navigation from infrastructure to traces to container logs needs zero configuration
- Mature alerting: composite monitors, anomaly detection, and sensible no-data and flapping defaults
- Fast time to a useful dashboard for a new engineer, thanks to a guided query builder
Cons
- Nothing portable comes out the other side — dashboards, monitors, query syntax, and history are all Datadog-only
- Query-builder skill does not transfer to any other tool, and complex queries eventually hit its expressive ceiling
- Bill growth is driven by module adoption and metric cardinality, both of which move without any change in traffic
- Lock-in becomes a commercial problem at renewal, when you have no credible alternative to name
Best for: Teams without dedicated platform capacity who need broad coverage of managed cloud services working well in week one, and who can absorb the renewal position that comes with it.
Pricing: Per-host subscription charged separately per product, with additional meters for custom metrics by unique time series and for indexed log events. The hidden cost is bill growth from adding modules and adding dimensions to metrics, not from serving more traffic.
How to choose
The two paths differ on portability far more than on capability, so compare on that axis first.
| Grafana Cloud | Datadog | |
|---|---|---|
| Metric format | Prometheus / OTLP | Proprietary (accepts OTLP, Prometheus) |
| Query language | PromQL, LogQL, TraceQL | Datadog-specific |
| Dashboards | JSON, portable across Grafana anywhere | Datadog JSON, Datadog-only |
| Self-host the same thing | Yes, same components | No |
| Out-of-box integrations | Community exporters and dashboards | Large curated first-party catalog |
| Main hidden cost | Engineering hours to assemble and maintain | Bill growth from modules and cardinality |
Then ask four questions in order and stop when one of them decides it.
- Are you already Prometheus-native? If your Kubernetes clusters are exporting Prometheus metrics and your team writes PromQL, Grafana Cloud is the lower-friction option and Datadog is the one that needs justifying.
- Do you have platform engineering capacity? Not “could someone do it” — is there a named owner with time? If not, Datadog’s out-of-box coverage is worth paying for, because unmaintained dashboards are worse than none.
- How much does portability matter to your risk profile? If you’re regulated, cost-sensitive at scale, or have been burned by a vendor renewal, the open-standards path has a value that doesn’t show up on the invoice.
- What’s your log volume? Logs dominate observability bills. Loki’s index-light design and Datadog’s indexed-event pricing behave very differently at volume, and this term can swamp everything else.
Then run both trials against the same real service for two weeks, and time the tasks — not the features.
Frequently asked questions
Is Grafana Cloud cheaper than Datadog?
On subscription cost, frequently. On total cost including engineering time, it depends entirely on whether you already have Prometheus expertise. A team that already runs Prometheus saves money. A team learning it from scratch spends the savings on salary instead of invoices, and may spend more.
Can I use OpenTelemetry with both?
Yes. Both ingest OTLP. Instrumenting your applications with OpenTelemetry is the single highest-leverage decision here, because it makes the backend swappable and keeps the expensive part of your instrumentation work vendor-neutral.
Can I self-host Grafana instead of using Grafana Cloud?
Yes, and that’s the point of the architecture — the same Mimir, Loki, Tempo, and Grafana components run on your own infrastructure. You take on capacity planning, upgrades, and on-call for the stack. The self-hosted observability stacks guide covers the operational load honestly.
Does Datadog lock-in actually matter if the product is good?
It matters at renewal. Lock-in isn’t a technical problem until it’s a commercial one: when the quote goes up and you have no credible alternative, you have no negotiating position. Keeping instrumentation on open standards is cheap insurance against that conversation.
Related reading
- Best APM tools for developers — the full landscape and where each category fits.
- Datadog alternatives — replacements segmented by which part of the bill drove you out.
- Datadog vs New Relic vs Dynatrace — the three big commercial platforms compared on pricing model.
- Best open source APM and observability tools — what the open ecosystem covers and where it stops.
- Best self-hosted observability stacks — the operational cost of running it yourself.
- Best APM for Kubernetes workloads — why the bill scales with pods, not traffic.