Buying observability is one decision. Assembling it is about forty, and each is reversible only at cost. Which metrics store, which log store, which trace store, what sits in front of them, how data gets in, how long it stays, what happens when a node dies, and who wakes up when the stack that pages people is itself unreachable.
Most teams get the first four right and skip the last three. Then a disk fills at 4am, ingestion stalls, alerts stop firing, and nobody finds out until a customer does. A monitoring stack that fails silently is worse than none, because you were relying on it.
This is the assembly guide I would give an engineer standing one up from scratch: what each component is for, how to size storage without guessing, why cardinality is what actually kills you, and where the all-in-one alternatives beat building it yourself.
Key takeaways
- The canonical stack is Prometheus for metrics, Loki for logs, Tempo or Jaeger for traces, Grafana for the UI, and the OpenTelemetry Collector as the ingestion layer.
- Storage sizing is arithmetic, not intuition: series count times sample rate times bytes per sample times retention.
- Cardinality kills metrics stacks. Almost every self-hosted outage traces back to a label carrying an unbounded value.
- The monitoring stack needs its own alerting path that does not depend on itself. Dead man’s switch or nothing.
The five layers, and what each one is actually for
A self-hosted stack has five jobs, and conflating them is where designs go wrong.
Ingestion. The OpenTelemetry Collector receives telemetry, batches it, transforms it, and routes it to backends. Run it even with one backend today — it is the layer that makes every other layer replaceable.
Metrics. Prometheus scrapes numeric time series and evaluates alerting rules. It is the standard, the exporter ecosystem is enormous, and PromQL is worth learning properly.
Logs. Loki indexes log lines by labels only, not content. Cheap ingestion, cheap storage, and full-text search that scans rather than looks up.
Traces. Tempo or Jaeger. Tempo is the Grafana-ecosystem choice with object storage and trace-ID lookup; Jaeger is the CNCF project with richer search over a Cassandra or Elasticsearch backend.
UI and alerting. Grafana queries all of the above and is where humans actually interact with the stack.
The separation matters because each layer scales differently. Metrics scale with series count, logs with byte volume, traces with span count and sampling rate. Sizing them as one number produces a stack oversized in one dimension and underwater in another.
Size storage with arithmetic, not vibes
For metrics: active series × samples per second × bytes per sample × retention seconds. Active series is the number you have to measure rather than guess — it is the product of every metric name and every combination of label values, usually an order of magnitude larger than engineers expect.
For logs it is simpler and more brutal: bytes per day × retention days × replication factor, divided by whatever compression ratio you actually achieve. Note “actually achieve” — compression on structured JSON behaves very differently from unstructured text.
For traces it is span count × average span size × retention, adjusted by sampling rate. Sampling is the lever most teams pull too late, after the disks are already full.
Needs first-hand data: Measure your actual active series count with
prometheus_tsdb_head_series, your log bytes per day at the collector, and your span rate. Multiply out the three storage requirements at your target retention and compare against provisioned disk.
Then decide retention deliberately per signal. Metrics are small and useful for a long time — keep them for quarters. Logs are large and useful for days — keep hot logs short and archive the rest to object storage. Traces are large and useful for hours, occasionally days.
The retention cliff
Retention costs do not rise smoothly. They rise smoothly until you cross a threshold where the data no longer fits the current storage tier or the current query approach, and then they jump.
The typical shape: a single Prometheus holds a month comfortably. At three months the head block’s memory footprint and the disk footprint together push you off a single node, and now you need remote write to a long-term store — a new system with its own operational surface. Same with logs: a local disk works until it does not, and then you are running object storage with an index tier in front of it.
Plan the cliff before you hit it. If you know you will eventually want a year of metrics, put VictoriaMetrics or an equivalent behind Prometheus from the start rather than migrating under pressure.
Cardinality is what actually kills you
Every self-hosted metrics outage I have seen came from the same root cause: someone added a label whose values were unbounded. User ID. Request ID. Full URL path with IDs in it. Customer email. Each distinct value creates a new time series, memory consumption grows with series count, and the process dies.
The bad part is that a code change causes an infrastructure outage, deployed by someone who has no idea the metrics system exists. There is no review gate for it by default.
Needs first-hand data: Pick your top ten metrics by series count and record how many series each one contributes and which label drives it. Then record memory consumed per million active series on your Prometheus instance — that ratio is your capacity planning constant.
Three defences, in order of effectiveness. Enforce cardinality limits at the collector or the metrics store so a bad label is dropped rather than propagated. Alert on series growth rate, not absolute count — a sudden slope change is a deploy that just broke something. And educate: labels are for bounded dimensions, high cardinality belongs in traces and logs where the storage engine is built for it.
That last point is the architectural insight. Trace backends on columnar storage handle high-cardinality attributes natively. If you want a metric labelled by customer ID, you want a trace query, not a metric.
High availability, and being honest about whether you need it
Full HA roughly doubles the operational surface: replicated Prometheus pairs with deduplication, a distributed log store, a distributed trace store, Grafana behind a load balancer with an external database for its own state.
Ask what you are protecting against. A single-node stack that loses fifteen minutes of data during a restart is usually acceptable. A stack that loses the alerting path during an incident is not. Those are different requirements, and the second is much cheaper to satisfy.
The minimum viable answer: two Prometheus instances scraping the same targets with identical alerting rules, both feeding one Alertmanager cluster. Alert continuity without solving distributed storage. Long-term data goes to the remote-write store, made durable separately. Keep Grafana’s configuration in version control and treat the instance as disposable — dashboards as code means a dead Grafana is a redeploy, not an archaeology project.
Who gets paged when the monitoring goes down
This is the question that separates a stack from a toy.
Alerting depends on Prometheus evaluating rules and Alertmanager delivering notifications. If either stops, alerts stop — and the absence of alerts is indistinguishable from everything being fine. That is the silent failure mode.
The fix is a dead man’s switch: a rule that always fires, sent to an external service that pages you when it stops arriving. The external service must not run on your infrastructure; that is the whole point. Several uptime and cron monitoring services do exactly this, and it is one of the few cases where an external dependency is unambiguously correct.
Second, monitor the stack’s own health signals — ingestion rate, scrape failures, disk headroom, WAL replay time — on a different channel from application alerts. When the stack is degraded you do not want its alerts buried in the same queue as everything else.
Third, write the runbook for “observability is down” before you need it. During an incident with no dashboards the fastest path is usually direct queries against the storage layer or straight to container logs, and knowing that in advance saves ten minutes you do not have.
OpenTelemetry Collector
The Collector is the ingestion layer: it receives telemetry over OTLP and other protocols, batches it, transforms it, and routes it to one or more backends. Deployed as an agent per node it handles local collection and host metadata; deployed as a gateway behind those agents it makes sampling decisions that need a complete trace and centralises routing. The reason to run it even with a single backend is indirection — with the collector in place, changing storage is a config change; without it, the backend endpoint is baked into every service.
Pros
- Makes every other layer of the stack replaceable without touching application code
- One place to control sampling, redact PII, and add consistent resource attributes
- Dual-export to two backends at once turns a migration into a controlled comparison
- Enforces cardinality limits before bad labels reach the metrics store
Cons
- It is another system you operate, with its own capacity, monitoring and upgrade cycle
- The config format is expressive and easy to get subtly wrong, and failures are quiet
- A gateway tier becomes a single point of ingestion failure unless you run it redundantly
Best for: Every self-hosted stack, without exception — the day it costs to deploy buys back a quarter later when you change a backend.
Pricing: Free under a permissive open source licence with no commercial edition and no gated features. Cost is the compute for agent and gateway tiers plus the engineer time to own its configuration.
Prometheus
Prometheus is the metrics layer and the de facto standard for it: a pull-based scraper, a local TSDB, PromQL, and a rules engine that evaluates alerting expressions next to the data. The exporter ecosystem covers essentially anything you run, and alerting rules live in version-controllable config rather than a console. Its limits are structural — a single node, a local disk, and no defence against a label carrying unbounded values.
Pros
- Enormous exporter ecosystem, so instrumenting infrastructure is usually a config change
- PromQL is expressive and portable to several compatible backends
- Alerting rules as code, reviewed in the same pipeline as application changes
- A single instance is genuinely simple to run and understand
Cons
- Cardinality is unguarded: a code change adding an unbounded label can take the instance down
- No native long-term storage — past a few months you need remote write and a second system
- Metrics only, and correlating with logs and traces is your problem
Best for: The metrics leg of any stack, from a single node upward, as long as someone owns cardinality discipline.
Pricing: Fully open source under a permissive licence — no enterprise edition, no feature gating. Cost is the node’s memory and disk plus the engineer time spent on retention, cardinality and upgrades.
Loki
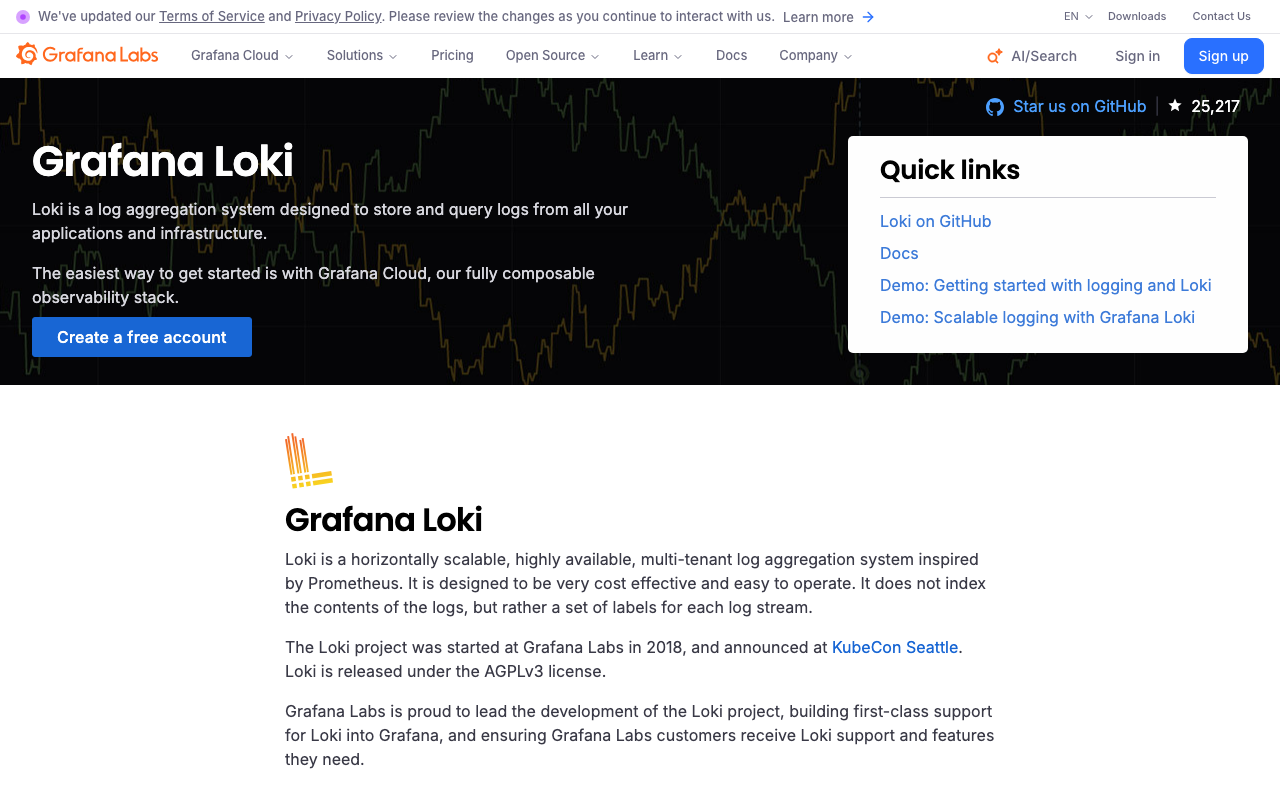
Loki is the log store designed around one deliberate constraint: it indexes log lines by labels only, never by content. That makes ingestion and storage cheap, and full-text search a scan rather than a lookup. It is the right trade when you mostly query logs scoped by service and time window, which is what most debugging actually looks like. It is the wrong trade if you need fast arbitrary search across everything, which is what Elasticsearch buys you and charges for.
Pros
- Dramatically cheaper ingestion and storage than a full-text indexing log store
- Label model mirrors Prometheus, so the same service and environment labels line up
- Object storage backend keeps long log retention affordable
- Integrates natively with Grafana, including jumping from a metric to its logs
Cons
- Arbitrary full-text search across a wide time range is slow because it scans
- Label discipline matters as much as it does in Prometheus — a high-cardinality label hurts here too
- Running it in a distributed mode is meaningfully more complex than the single-binary mode suggests
Best for: Teams whose log queries are almost always scoped by service and time, and who want log costs to stay proportional to volume rather than index size.
Pricing: Free open source licence, with some capabilities reserved for the vendor’s enterprise and hosted tiers. Self-hosted cost is object storage plus the compute for the ingestion and query paths, and the engineer time to tune both.
Tempo
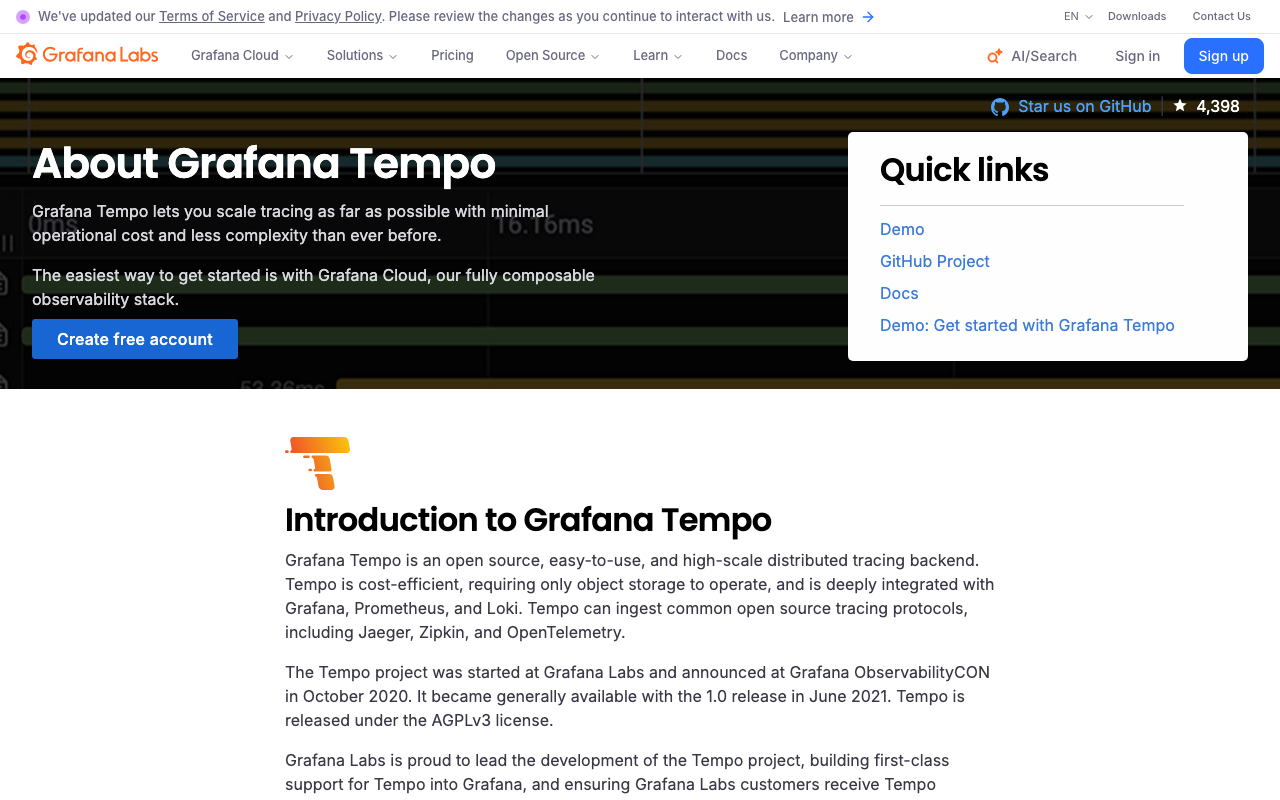
Tempo is the Grafana-ecosystem trace store. Its design bet mirrors Loki’s: keep the index minimal, put the bulk of the data in object storage, and optimise for trace-ID lookup rather than rich open-ended search. That works extremely well when your workflow starts from a log line or an exemplar on a metric and follows the trace ID into the trace. It works less well when trace search itself is the primary investigative tool.
Pros
- Object storage as the primary tier makes trace retention cheap at volume
- Very low operational overhead compared with running Cassandra or Elasticsearch behind a trace store
- Tight integration with Grafana, Prometheus exemplars and Loki for signal-to-signal navigation
- Accepts OTLP directly, so instrumentation stays portable
Cons
- Search over trace attributes is weaker than a backend built around a search index
- Cold object storage adds latency to queries that scan wide time ranges
- Effectively assumes you are in the Grafana ecosystem; standalone it is less compelling
Best for: Teams already running Grafana and Prometheus whose main access pattern is following a trace ID discovered in a log or a metric exemplar.
Pricing: Free open source licence with enterprise capabilities and a hosted tier sold separately. Self-hosted cost is object storage and query compute plus the engineer time to manage sampling and retention.
Jaeger
Jaeger is the CNCF distributed tracing project and the alternative to Tempo when trace search is a first-class workflow rather than a fallback. It ingests spans, stores them in a pluggable backend — Cassandra, Elasticsearch or OpenSearch — and gives you trace search plus a service dependency graph. The storage backend choice is where the operational weight lands, and it is a bigger decision than picking Jaeger itself.
Pros
- Rich search across trace attributes, not just trace-ID lookup
- Mature project with a long production track record and broad OTLP support
- Service dependency graphs derived from real spans rather than declared architecture
- Reuses a database your team may already operate
Cons
- The backing store, not Jaeger, is the system you actually end up operating and paying for
- No alerting engine, so trace-derived alerts need another component
- Traces only, with correlation to metrics and logs left to you and Grafana
Best for: Teams who need trace search as a primary debugging workflow and already have Elasticsearch or Cassandra expertise in house.
Pricing: Fully open source with no commercial tier from the project. Cost is dominated by the storage backend’s infrastructure and the engineer hours to run it, which dwarf Jaeger’s own footprint.
Grafana
Grafana is the front door: dashboards and unified alerting over Prometheus, Loki, Tempo, ClickHouse and dozens of other sources. It stores nothing itself, which is the single most important thing to understand about it — it solves the one-pane-of-glass problem and none of the storage problems. Keep its configuration in version control and treat the instance as disposable.
Pros
- Queries essentially any backend, so it survives changes underneath it
- Dashboards and alert rules provisionable as code, reviewable in a diff
- Unified alerting gives one notification pipeline across all three signals
- Signal-to-signal navigation between metrics, logs and traces when the datasources are wired up
Cons
- Stores nothing — every retention and capacity problem stays yours
- Licence position has shifted over the years and some capabilities are Enterprise-only
- Dashboard sprawl is the default outcome without deliberate governance
- Its own state needs a database if you run it highly available
Best for: Every assembled stack — it is the layer humans actually use, and dashboards as code is what makes the stack reproducible.
Pricing: Open core: the core is free to self-host, specific features are Enterprise, and a hosted cloud tier sits alongside. Verify the features you depend on are on the open side. Self-hosted cost is small compute plus dashboard maintenance time.
VictoriaMetrics
VictoriaMetrics is the pragmatic answer to the retention cliff. It accepts Prometheus remote write, answers PromQL, and uses a storage engine built for better compression and lower memory pressure at high series counts. Put it behind Prometheus from the start if you know you will eventually want a year of metrics — it delivers long retention without the operational weight of a full Thanos or Cortex deployment.
Pros
- Remote-write in, PromQL out, so existing dashboards and alerts port unchanged
- Substantially lower memory footprint than Prometheus at the same series count
- Far simpler to operate than the distributed alternatives for the same outcome
- The single-node build carries a surprising amount of load
Cons
- Metrics only — it does nothing for logs or traces
- Clustering and some enterprise features require a commercial licence
- PromQL compatibility is very close but not identical, so unusual queries need checking
Best for: Metrics-heavy stacks that have outgrown a single Prometheus and need retention measured in quarters.
Pricing: Free open source licence for the single-node build; the clustered version and some enterprise capabilities are commercial. Self-hosted cost is storage and memory plus the engineer time to run it.
SigNoz
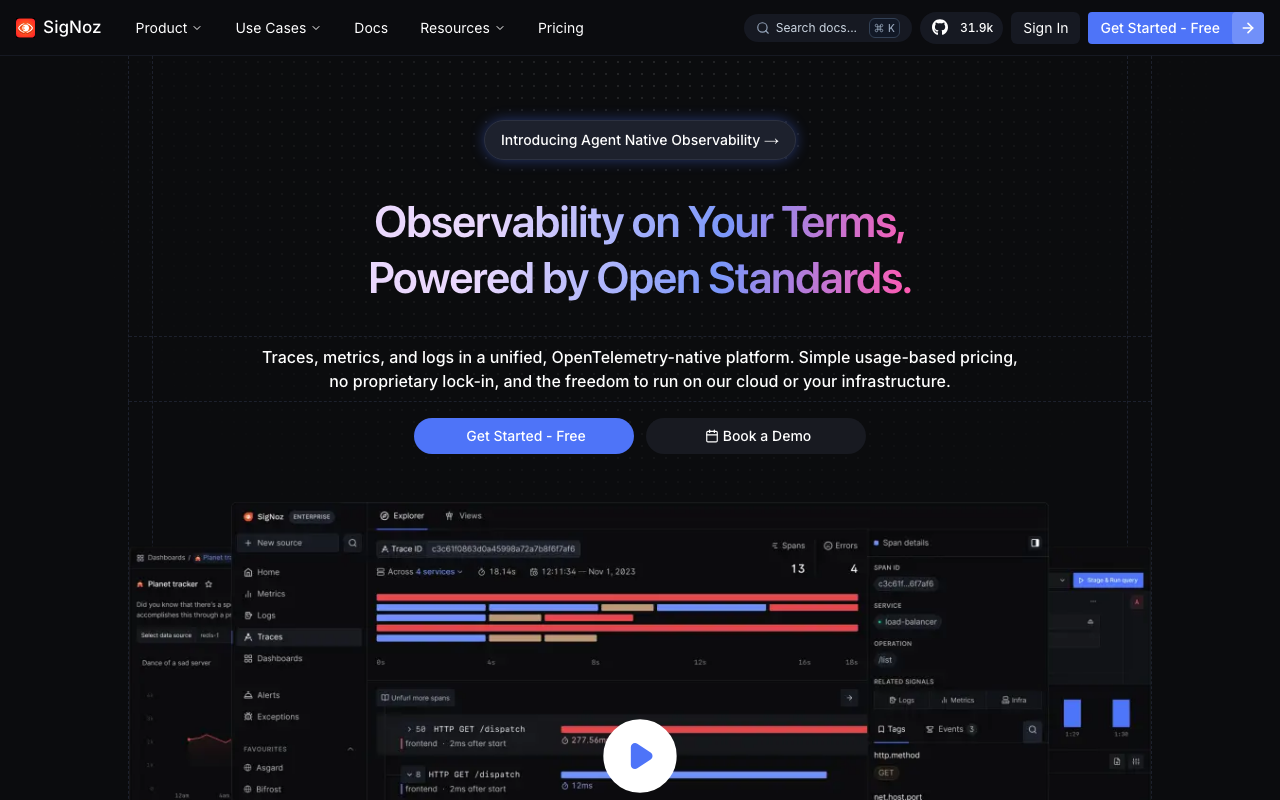
SigNoz is the all-in-one alternative to assembly: metrics, traces and logs all stored in ClickHouse behind one UI. One system instead of five, correlation between signals for free because they share a store, and you skip the entire question of how Loki labels line up with Prometheus labels. What you give up is component-level choice — if you have a strong reason to want Loki’s label model or Prometheus’ recording rules, this will feel constraining.
Pros
- One deployment covering all three signals, with cross-signal correlation built in
- ClickHouse handles high-cardinality attributes that break a TSDB-based metrics layer
- OTLP-native, so instrumentation stays portable if you change your mind
- Removes the hardest part of assembly: making signals from different stores line up
Cons
- ClickHouse operations — sizing, merges, replication, disk layout — become your problem
- Open core: SSO and some access control sit in the commercial tiers
- Less flexibility than a component stack when you need a specific storage behaviour
Best for: Teams with a small ops budget who need all three signals and value correlation over component-level choice.
Pricing: Free open source community edition with a commercial cloud and enterprise tier gating SSO, some access control and support. Self-hosted cost is ClickHouse infrastructure plus the engineer time to keep it healthy.
OpenObserve
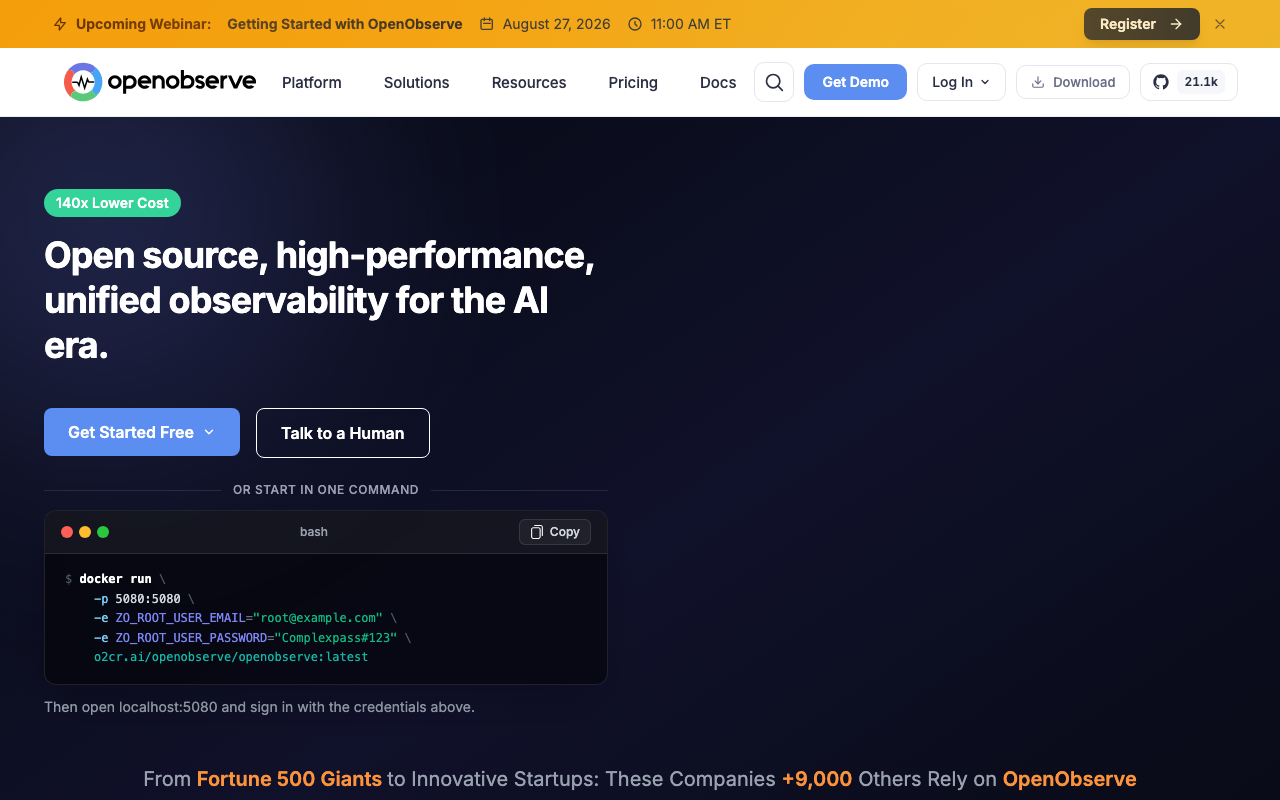
OpenObserve makes the same consolidation bet as SigNoz with object storage as the primary tier, which changes long-retention economics substantially — logs and traces in a bucket cost a fraction of the same data on SSD. The trade is query latency on cold data, which is the right trade when retention is driven by compliance rather than day-to-day debugging.
Pros
- Object storage as the primary tier makes multi-quarter retention affordable
- All three signals in one deployable product, so assembly work disappears
- Storage scales independently of compute — a retention increase is not a node resize
Cons
- Queries against cold object storage are slower, which hurts interactive debugging
- Object storage brings its own failure modes: throttling, request charges, consistency edges
- Younger project with a thinner ecosystem than the Prometheus and Grafana worlds
Best for: Teams whose storage bill is dominated by retention requirements they cannot negotiate away and who rarely query old data interactively.
Pricing: Free open source licence with a hosted commercial tier. Self-hosted cost is object storage capacity and request charges plus the engineer time to run the query layer — model bucket economics rather than disk economics.
The open-core boundaries across these projects are covered in best open source APM tools.
How to choose
Count people, not features. If nobody owns this stack on a named basis, do not build it — use a hosted product and revisit in a year.
With an owner, pick the narrowest stack that covers your signals. Metrics only? Prometheus and Grafana, done. Metrics and logs? Add Loki. All three? Seriously evaluate an all-in-one before assembling four components, because correlation between signals is the hard part and shared storage gives it to you free.
Whatever you pick, do three things in week one: put the OpenTelemetry Collector in front of it, set a dead man’s switch on an external service, and write the storage arithmetic into the repo so the next person knows what the numbers were based on.
| Approach | Components to operate | Best for | Main risk |
|---|---|---|---|
| Prometheus + Loki + Tempo + Grafana | 4-5 plus collector | Teams with a platform function | Assembly and upgrade toil |
| Prometheus + VictoriaMetrics + Grafana | 3 plus collector | Metrics-heavy, long retention | No traces or logs story |
| SigNoz | 1 plus ClickHouse | Unified signals, small ops budget | ClickHouse operations |
| OpenObserve | 1 plus object storage | Cheap long retention | Cold-query latency |
| Hosted vendor | 0 | Teams without ops capacity | Cost at volume, lock-in |
Frequently asked questions
Tempo or Jaeger for traces?
Tempo if you are already in the Grafana ecosystem and your primary access pattern is trace-ID lookup from a log or metric. Jaeger if you need richer trace search as a first- class workflow and you are willing to operate Elasticsearch or Cassandra behind it.
Should I run the OpenTelemetry Collector even with one backend?
Yes. It gives you a single place to control sampling, redact sensitive fields, add resource attributes, and — critically — dual-export during a backend migration. Without it, changing backends means redeploying every service.
Can I self-host and still have a status page?
You can, but the status page must not run on the infrastructure it reports on. Host it externally or on a separate provider. This is the same principle as the dead man’s switch and it is non-negotiable.
Related reading
- Best APM tools for developers — the full landscape and where self-hosting fits.
- Best open source APM and observability tools — storage architecture and open-core boundaries.
- Best OpenTelemetry-native observability platforms — keeping the ingestion layer portable.
- Best APM for Kubernetes workloads — scaling a stack alongside pod churn.
- Grafana Cloud vs Datadog — the hosted version of this stack.