The fastest way to know your site is down is to have something outside your infrastructure ask it a question every minute and complain when the answer is wrong. That is uptime monitoring. It takes ten minutes to set up and for a lot of teams it is genuinely all the external monitoring they need for years.
The trouble starts when the homepage returns 200 and the checkout is broken. A health
endpoint returning {"status":"ok"} proves the process is running. It proves nothing about
whether a user can log in, add to cart, and pay. Closing that gap is what synthetic browser
monitoring is for, and it is a much bigger commitment than a ping.
The other failure is more insidious. A monitor that cries wolf twice a week gets muted, and a muted monitor is worse than no monitor because the org believes it is covered. I have watched teams lose more to alert fatigue than to any outage.
Key takeaways
- Three distinct things: uptime checks (is it reachable), API monitoring (does the contract hold), synthetic browser tests (can a user complete the journey).
- Most teams need only uptime checks until a silent business-logic failure teaches them otherwise. That is a reasonable order.
- False positives destroy alerting faster than outages do. Multi-location confirmation and retry-before-alert are not optional.
- Your status page must not run on the infrastructure it reports on. This has no exceptions.
Three different products that get sold as one
Uptime checks hit a URL on an interval and assert on status code, response time and sometimes body content. Cheap, low false-positive rate when configured properly, and the right first thing to buy. They tell you the front door opens.
API monitoring goes further: authenticate, call a sequence of endpoints, assert on the response body and schema. This catches the failure where the service is up and returning 200 with wrong data — an empty product list, a broken pagination cursor, a downstream dependency degrading silently.
Synthetic browser transactions drive a real browser through a real user journey: load the page, fill the login form, add an item, reach the payment step. They catch JavaScript errors, broken third-party scripts, a CDN serving a stale bundle, a CSS change that hides the submit button.
Cost and maintenance scale in that order too. Uptime checks are effectively free to maintain. Browser transactions are code — they break when the UI changes, and unowned they rot into a source of false alarms within a quarter. Hence the honest sequencing: uptime checks for everything public, API monitoring for the two or three endpoints that carry revenue, browser transactions only for the most important journey and only once someone owns them.
Check frequency is the cost dial
These tools price on volume — checks per interval, per location, per month — and frequency multiplies with geographic spread. A check every minute from ten locations costs ten times the same check from one, and sixty times a ten-minute check from one.
Frequency should follow detection requirements, not instinct. If your alerting pipeline plus human response time is fifteen minutes, a one-minute check buys you nothing a five-minute check does not. Automated failover that triggers on the monitor justifies one minute or faster.
Needs first-hand data: Measure the actual time from a real incident’s first failed check to a human acknowledging the page. If check interval is a small fraction of that number, your frequency is over-provisioned and you are paying for it.
Set frequency per endpoint, not globally. The payment API deserves a tight interval from several regions. The marketing blog does not.
Global probe placement, and what it actually tells you
Multi-region checking answers one question: is this broken for everyone, or only from there. That distinction matters when the failure lives in a CDN edge, a regional DNS resolver, or a routing problem between two networks that has nothing to do with your servers.
Choose locations matching where your users are, plus one that does not. Users-only placement tells you about impact; the odd one out tells you whether a problem is geographic, and that is often what shortens an incident.
Probe networks are not identical either, and a probe sitting in a cloud region tests a path most of your users never take. If a market matters commercially, verify the provider has a probe near it rather than assuming continental coverage is enough.
The false-positive problem is the whole game
An uptime tool that alerts on every transient blip trains your team to ignore it. Once that happens the tool is worse than nothing, because leadership believes there is coverage and there is not.
Four defences, all supported by the good tools and all routinely left unconfigured.
Confirm from a second location. A single probe seeing a failure is usually the probe’s network, not yours. Two probes on different networks agreeing is signal.
Retry with a short delay. Most transient failures resolve in seconds. Requiring two or three consecutive failures costs a little detection latency and removes a lot of noise.
Set thresholds against real behaviour, not aspiration. If p95 response time routinely sits near your alert threshold, you will page on normal traffic.
Route by severity. The checkout journey pages someone. The marketing site posts to a channel. Everything at the same severity gets ignored at the same rate.
Needs first-hand data: Count alerts fired over 90 days and classify each as real incident, transient blip, or monitor misconfiguration. If real incidents are under a third, tune the monitors before adding any more.
Monitoring as code, because the console will drift
Checks configured by hand in a web console decay. Someone adds an endpoint and forgets the monitor. Someone raises a threshold to stop a page during an incident and never reverts it. Nobody reviews any of it, because it is not in a diff.
Defining checks in code fixes the hygiene problem and then keeps paying out. The same browser test can run in CI against a preview environment and in production as a synthetic monitor: one artefact, two jobs, no drift between what you test before deploy and what you check after.
The cost is that it becomes a developer workflow. If the people who need to add checks are not comfortable with a repo and a pull request, a console-first product will get more use — and a monitor that exists beats one that was architecturally superior and never written.
Your status page cannot live on your infrastructure
This is the rule people nod at and then violate.
If your status page is served from the same cluster, region, or load balancer as the product, a serious outage takes down the page that is supposed to explain the outage. Customers get an error from the product and an error from the status page, and support takes the entire load with no self-service option.
Host it with a different provider. Most uptime vendors offer a hosted status page, which is the easiest correct answer — it runs on their infrastructure, updates from their monitors, and stays up when yours does not. Automate the update so the page reflects reality without someone remembering mid-incident, and check its DNS does not depend on the same zone as the failing service. DNS is the dependency that catches people out.
The same principle applies inward: if you self-host monitoring, an external heartbeat watching your alerting pipeline is the only thing between you and silent failure.
Checkly
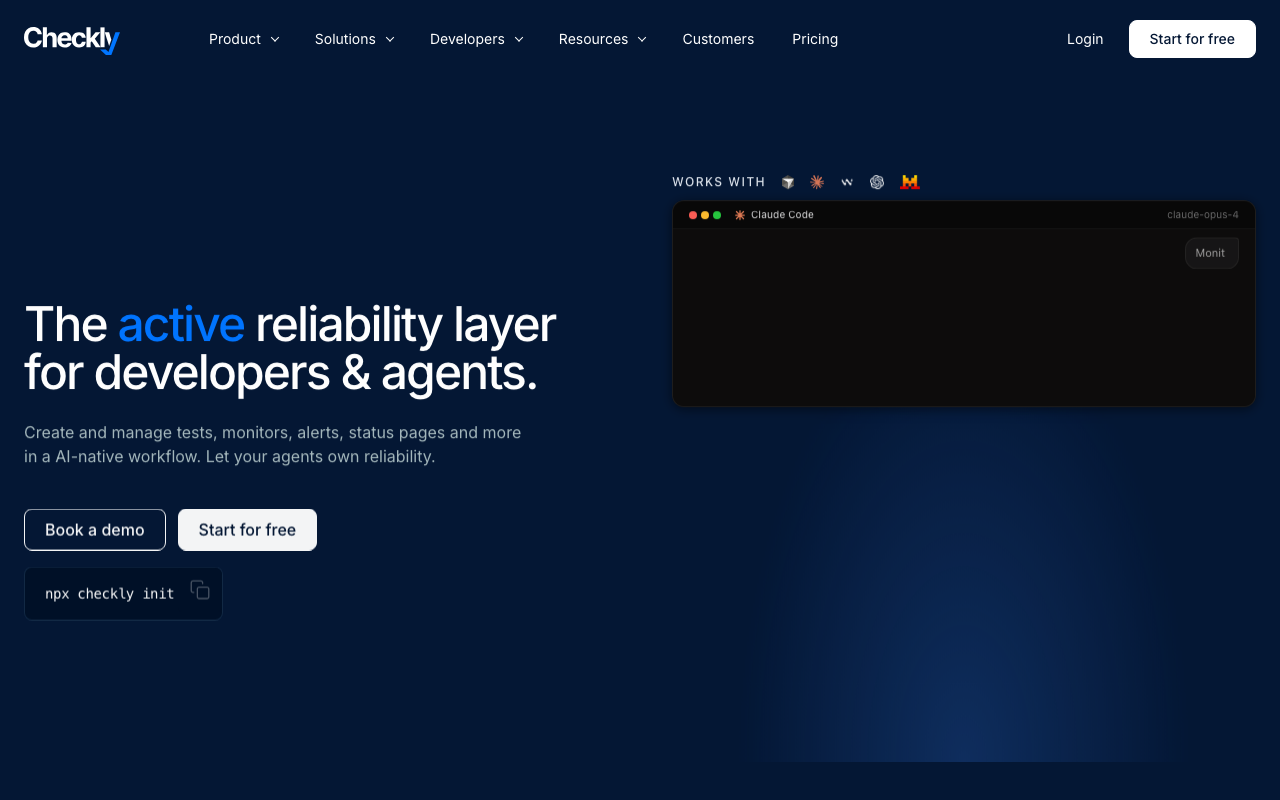
Checkly is the clearest expression of monitoring as code: checks defined in code, browser tests written as Playwright scripts, and the whole configuration in version control and deployed through your pipeline. Because the browser tests are ordinary Playwright, the same artefact runs in CI against a preview environment and in production as a synthetic monitor, which removes the usual drift between pre-deploy testing and post-deploy checking.
Pros
- Checks live in version control, so every threshold change is reviewable in a diff
- Playwright tests are reusable between CI and production synthetics — one artefact, two jobs
- Deploys through your existing pipeline, so monitoring ships with the service it watches
- API and browser checks in one model rather than two separate products
Cons
- It is a developer tool: teams without a CI culture will simply not add checks
- Browser tests are code and rot like code — unowned they become false-positive generators
- Overkill if all you need is a handful of URL checks
Best for: Product engineering teams with a CI culture who want synthetic checks reviewed, versioned and deployed like any other code.
Pricing: Usage-based on check runs, with browser checks metered far more heavily than API checks; frequency and location count are the levers, so per-endpoint intervals matter more here than elsewhere.
UptimeRobot
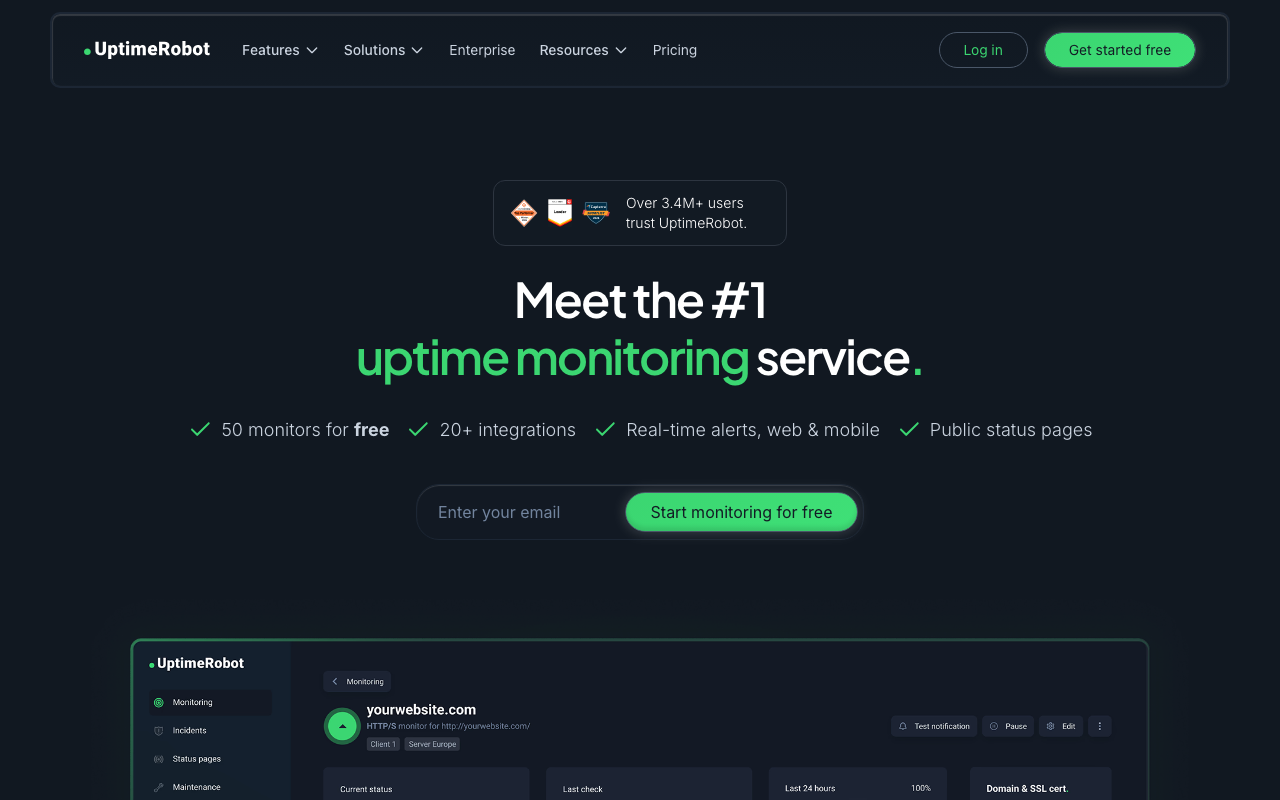
UptimeRobot is the default entry point for good reason: HTTP, ping, port and keyword checks set up in minutes, plus a hosted status page. If you need external checks and nothing more, this is a sensible ten-minute decision that you will not regret and can outgrow gracefully when a business-logic failure eventually gets past it.
Pros
- Fastest path from nothing to external coverage on every public entry point
- Console-first, so non-engineers can add and maintain checks
- Hosted status page included, which satisfies the off-infrastructure requirement
- Keyword checks catch a useful class of “up but wrong” failures without scripting
Cons
- No real synthetic browser transactions, so user-journey failures stay invisible
- Assertion depth is shallow — response bodies and schemas are not properly testable
- Console configuration drifts and is not reviewable in a diff
Best for: Small teams buying their first external monitoring who need coverage today and have no synthetic requirement yet.
Pricing: Tiered subscription by number of monitors and minimum check interval, with a free tier at a coarse interval; the upgrade trigger is usually interval, not monitor count.
Cronitor
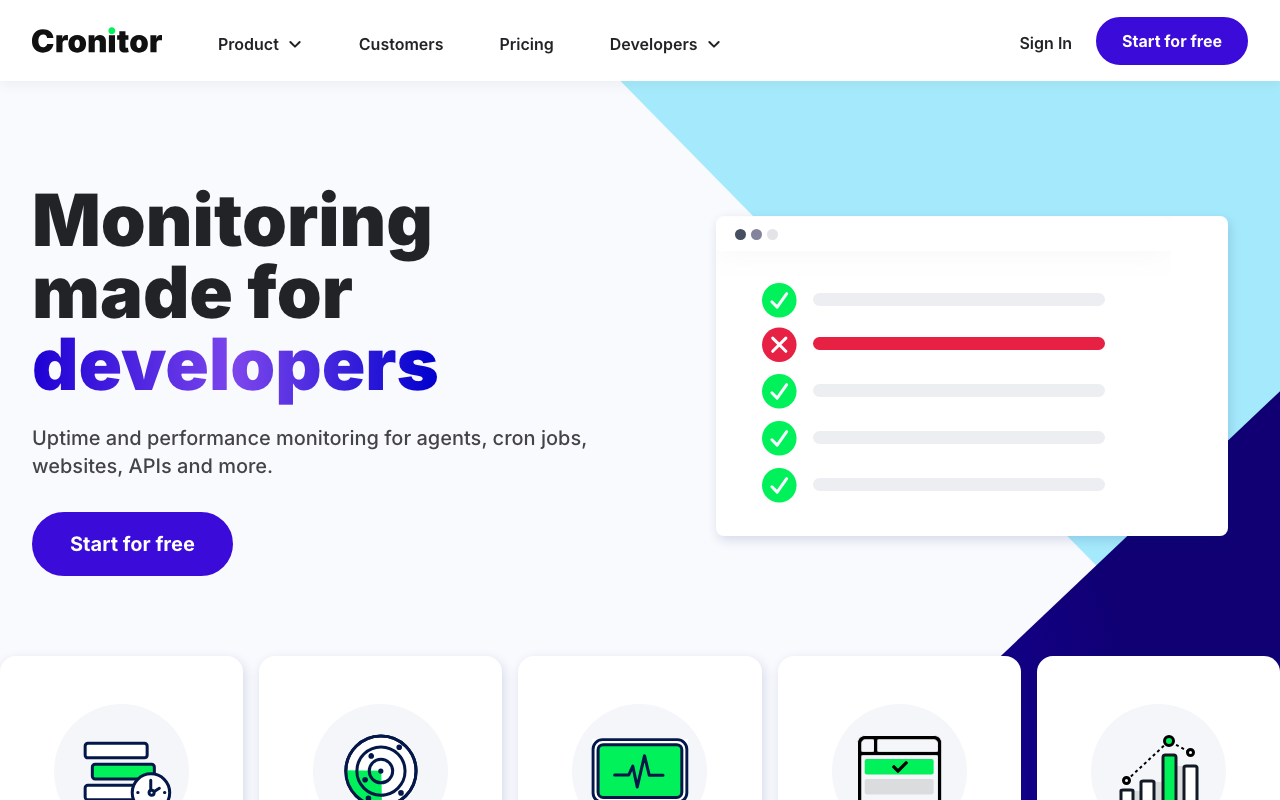
Cronitor starts from an underrated problem: background jobs. A cron that silently stops running produces no error and no alert, and you find out when the weekly report does not arrive. Its heartbeat model — the job pings on completion, you get paged when the ping stops — is the dead man’s switch pattern, and it is exactly what you should point at your own monitoring stack’s alerting pipeline.
Pros
- Heartbeat monitoring catches silent failures that no external probe can see
- The dead man’s switch it enables is the correct external watchdog for a self-hosted stack
- Also covers ordinary uptime and API checks, so it is not a single-purpose purchase
- Alerts on jobs running late or too long, not just on jobs missing entirely
Cons
- Heartbeats require instrumenting each job, which means touching code or crontabs
- Browser synthetics are not the focus, so complex journeys need another tool
- A job that reports success while producing wrong output still looks healthy
Best for: Teams with meaningful batch or cron workloads, and anyone self-hosting monitoring who needs an external dead man’s switch.
Pricing: Subscription tiered by number of monitors and alerting features, with a free tier for a small number of heartbeats — enough that the dead man’s switch on your own alerting pipeline costs essentially nothing.
Better Stack
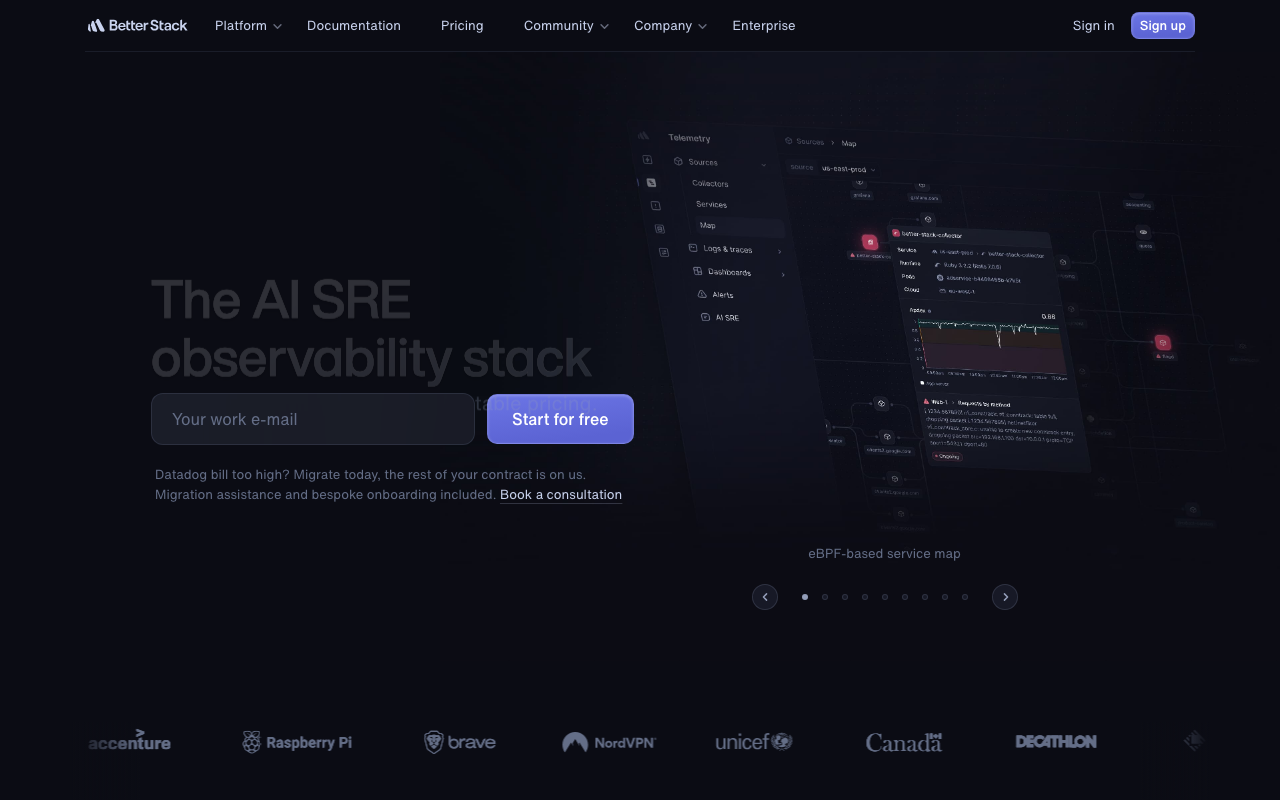
Better Stack bundles uptime monitoring, incident management, on-call scheduling and status pages into one product. The argument for bundling is real: uptime alerting is useless without an escalation path, and splitting the monitor and the rota across two vendors is a seam that fails during incidents — exactly when nobody has capacity to debug an integration.
Pros
- Monitor, escalation policy and status page in one place, so the alerting path has no seam
- On-call scheduling included, which removes a separate vendor for small teams
- Status page updates driven directly by monitor state rather than by someone remembering
- Covers the whole minimum viable setup in one purchase
Cons
- Bundling means the on-call product must be good enough, not just present — evaluate it separately
- Synthetic browser coverage is thinner than a dedicated synthetics tool
- One vendor for monitoring and incident response concentrates risk in a single provider
Best for: Teams who want one vendor covering detection, escalation and public communication rather than assembling three.
Pricing: Subscription tiered by monitor count, check frequency and on-call seats, with separate meters for log and incident volume on higher tiers.
Pingdom
Pingdom remains a familiar name in this category and plenty of teams still run it from years back. It does standard uptime checks and transaction checks competently from a global probe network, with the reporting and page-speed features that made it a default choice for a long time. There is rarely a compelling reason to migrate off it while it works, and rarely a compelling reason to choose it fresh over the newer options.
Pros
- Long-established global probe network with a mature reporting layer
- Transaction checks cover multi-step journeys without writing Playwright code
- Familiar enough that most engineers can operate it without training
Cons
- Console-first configuration with no meaningful monitoring-as-code story
- Sits inside a larger vendor’s portfolio, so roadmap attention is not guaranteed
- Newer tools cover the same ground with better developer workflows
Best for: Teams already running it who have working checks and no unmet requirement driving a migration.
Pricing: Subscription tiered by check volume and frequency, with synthetic transaction checks metered separately from basic uptime checks.
Datadog Synthetics

Datadog offers API and browser synthetic tests that link directly to the traces those tests generate. That correlation is the genuine advantage: a failing synthetic hands you the trace of the failing request, not a red mark on a dashboard. If you already run Datadog for APM, the synthetic test and the root cause live one click apart.
Pros
- Failing synthetics link straight to the backend trace, collapsing detection and diagnosis
- Shares alerting, on-call routing and dashboards with the rest of the platform
- Browser test recorder lowers the barrier for non-engineers to create journeys
- No extra vendor to procure if Datadog is already in place
Cons
- A synthetic inside the platform you use to observe your infrastructure shares failure modes with it
- Synthetics are a separate meter on an already multi-metered bill
- Weak fit if you are not already a Datadog customer — you would not buy the platform for this
Best for: Existing Datadog customers who want synthetic failures to resolve into traces without leaving the platform.
Pricing: Metered per test run and separated by API versus browser tests, on top of the platform subscription; frequency and location count drive the meter, and browser tests cost substantially more per run than API tests.
Grafana
Grafana provides synthetic monitoring in its cloud offering, which fits neatly if your dashboards and alerting already live there — one alerting pipeline, one on-call integration, one place to look. Checks can be provisioned rather than clicked, which puts it closer to the monitoring-as-code end of the spectrum than the other console-first options.
Pros
- Synthetic results land next to your existing dashboards and alert rules
- Checks can be provisioned as code alongside the rest of your Grafana configuration
- Reuses the alerting and on-call path you already trust, with no second escalation setup
- Probe results feed the same query and visualisation layer as everything else
Cons
- Shares failure modes with the observability platform it runs alongside, which is the wrong property during an outage
- Browser synthetic depth trails the dedicated synthetics tools
- Only compelling if you are already committed to the Grafana ecosystem
Best for: Existing Grafana Cloud users who want external checks in the same alerting pipeline as their internal telemetry.
Pricing: Metered by check executions within the cloud subscription, with frequency and probe-location count as the levers; it rides on the existing plan rather than being a separate purchase.
The trade-off across the bundled options is the usual one, plus a structural argument specific to this category: a synthetic monitor inside the platform you use to observe your infrastructure shares failure modes with it, and independence has value precisely when things are broken. Wider platform comparison in best APM tools for developers.
How to choose
Week one, do the minimum properly: an uptime check on every public entry point with two-location confirmation and retry-before-alert, a status page hosted somewhere else, and a heartbeat monitor pointed at your own alerting pipeline. That is a day of work and it covers most of what external monitoring is for.
Week two, add API monitoring to the two or three endpoints that carry revenue, asserting on response bodies rather than status codes alone.
Only then consider browser synthetics, and only for the single journey whose failure costs the most. Write it as code, run it in CI as well as production, assign an owner by name. If you cannot name the owner, do not write the test — an unmaintained browser test becomes a false-positive generator, and you already know what that does.
| Tool | Primary strength | Configuration model | Best fit |
|---|---|---|---|
| Checkly | Playwright synthetics as code | Code, version controlled | Teams with a CI culture |
| UptimeRobot | Fast, simple uptime checks | Console | Small teams, first monitor |
| Cronitor | Cron and heartbeat monitoring | Console plus API | Background jobs, dead man’s switch |
| Better Stack | Uptime plus on-call plus status page | Console | Teams wanting one incident vendor |
| Pingdom | Established uptime and transaction checks | Console | Incumbent users with working checks |
| Datadog Synthetics | Correlation with APM traces | Console | Existing Datadog customers |
| Grafana | Synthetics in an existing stack | Console plus provisioning | Existing Grafana users |
Frequently asked questions
How often should uptime checks run?
Frequently enough that check interval is small relative to your total detection-to-response time, and no more. One to five minutes covers most services. Sub-minute is justified when something automated acts on the result.
Do I need synthetic browser monitoring?
Not until a business-logic failure gets past your uptime checks. When a user journey breaks while every endpoint returns 200, that is the signal. Start with the single highest-value journey rather than trying to cover the app.
Uptime monitoring or real user monitoring?
Different questions. Uptime tells you whether the service responds to a synthetic request from outside, including when nobody is using it. RUM tells you what real users experienced. Run both.
Should synthetics live in my APM vendor or a separate tool?
Separate if independence during outages matters most, bundled if trace correlation matters more. If bundled, make sure at least one check — ideally the heartbeat on your alerting pipeline — runs somewhere else entirely.
Related reading
- Best APM tools for developers — where uptime monitoring sits in the wider stack.
- Best RUM tools — what real users experienced, not synthetic probes.
- Best self-hosted observability stacks — why monitoring needs an external watchdog.
- Best APM tools for startups — the minimum a small team should run.
- Best free APM tools — free tiers and where they stop.