A free APM tier is not a smaller version of the paid product. It is the paid product with specific capabilities removed, and the removals are chosen carefully — they are the ones you will not notice until an incident, at which point you will notice them a great deal.
That is not a scandal; free tiers are a customer acquisition channel and everyone involved knows it. The problem is that the removals are described in terms that sound neutral — retention, sampling, cardinality — when what they mean is “the trace showing your outage was discarded before it reached storage”.
So this is about reading the fine print structurally rather than numerically. I am not going to quote limits, because they change every quarter and any number here would be wrong by the time you read it. The shape of the restrictions does not change, and once you know the shape you can evaluate any free tier in ten minutes.
Key takeaways
- Free tiers restrict along six axes: retention, volume, cardinality, sampling, seats and alerting. Work out which one binds for your workload before you build on top of it.
- Forced sampling is the most dangerous restriction because it silently deletes exactly the rare events you most need during an incident.
- “Free forever” and “free trial” are deliberately blurred. If the plan requires a card and converts automatically, it is a trial.
- Genuinely free open source moves the cost from an invoice to engineer hours. That trade is good when you already run stateful infrastructure and bad when you do not.
The six restrictions, and which ones actually hurt
Every free tier is built from some combination of these. They are not equally survivable, and they are listed here roughly in increasing order of damage.
Retention windows are the honest restriction. Data is deleted after a fixed period, which is visible, predictable and mostly fine — you investigate incidents while they are fresh. The exception is slow-burn problems: a memory leak that manifests over three weeks is invisible if you can only see three days.
Volume caps reject or bill ingest above a threshold, and they are fine as long as you know which of those two happens at the ceiling. Some vendors reject data above the cap, so you lose telemetry and pay nothing. Others accept it and bill overage. Find out which before you ship verbose logging.
Cardinality caps limit distinct metric series and break most confusingly. Cardinality is the count of distinct label combinations on your metrics and it grows multiplicatively — a label with fifty possible values multiplies your series count by fifty. When you cross the cap, platforms typically stop accepting new series rather than failing loudly. Existing dashboards keep working, the metric you just added silently never appears, and you spend an afternoon debugging your instrumentation before discovering the limit was the problem.
Forced sampling keeps a fraction of traces and I would treat it as disqualifying for a production tier. Head sampling — deciding whether to keep a trace at the start of the request — is cheap and throws away errors at exactly the same rate as successes, so the rare failure you need is almost certainly gone. Tail sampling decides after the trace completes and can preferentially keep errors and slow requests, which is what you actually want, and it is frequently a paid feature.
Seat limits restrict who can log in, and matter more than they look. During an incident you want the on-call engineer, the service owner and whoever writes the customer update all looking at the same data. A two-seat limit means someone is reading screenshots in Slack.
Alerting restrictions are the quietest failure: caps on rule count, available notification channels, or evaluation frequency. A five-minute evaluation interval on a checkout outage is four extra minutes of downtime, and free-tier alerting often excludes exactly the channel that wakes a human up. A monitor that cannot page you is decoration.
Needs first-hand data: For each free tier evaluated, send a controlled traffic pattern containing a known rare error — say one failure in ten thousand requests — and record whether that trace is retrievable an hour later. This single test separates free tiers that work during incidents from ones that do not, and no vendor publishes the answer.
Free forever versus free trial
The marketing language is deliberately similar and the difference is total.
A free trial is a full-featured plan that expires, usually requires a card, and converts automatically. Use it as an evaluation with a calendar reminder. Building production monitoring on one means rebuilding it in a fortnight.
A free tier persists indefinitely with reduced capability. No card, no expiry, no conversion.
A third category muddies both: the allowance inside a paid account, where you pay for anything above a threshold. That is a volume discount with a zero floor, not a free tier, and it matters because your bill is zero right up until it is not.
Two questions resolve which you are looking at. Does signup require a payment method? And on day 15, does the account downgrade or start charging? A vendor that cannot answer the second plainly on its own signup page has told you something.
Free SaaS tier versus genuinely free open source
These are different products with different failure modes, and “free is free” is wrong in both directions.
A free SaaS tier costs nothing in money or operations, and costs you capability plus a likely forced migration when you outgrow it. The migration is the real cost, and it lands at the worst time — you outgrow the free tier precisely when you are growing fastest and have the least slack.
Genuinely free open source costs a server, an upgrade cadence, a backup strategy and someone’s attention when it breaks. In exchange there is no cap, no migration, and no vendor able to change the terms. Good trade if you already run stateful infrastructure competently. Bad trade if the answer to “who runs this” is “whoever is free that week”, because an observability stack that is down during an incident is worse than not having one — you waste ten minutes trusting it first.
Needs first-hand data: Track hours actually spent on a self-hosted stack over a quarter — upgrades, disk pressure, query performance tuning, incidents in the observability system itself — and convert to a monthly cost at a realistic engineering rate. That figure is the honest comparison against a SaaS invoice, and nobody publishes it.
Grafana
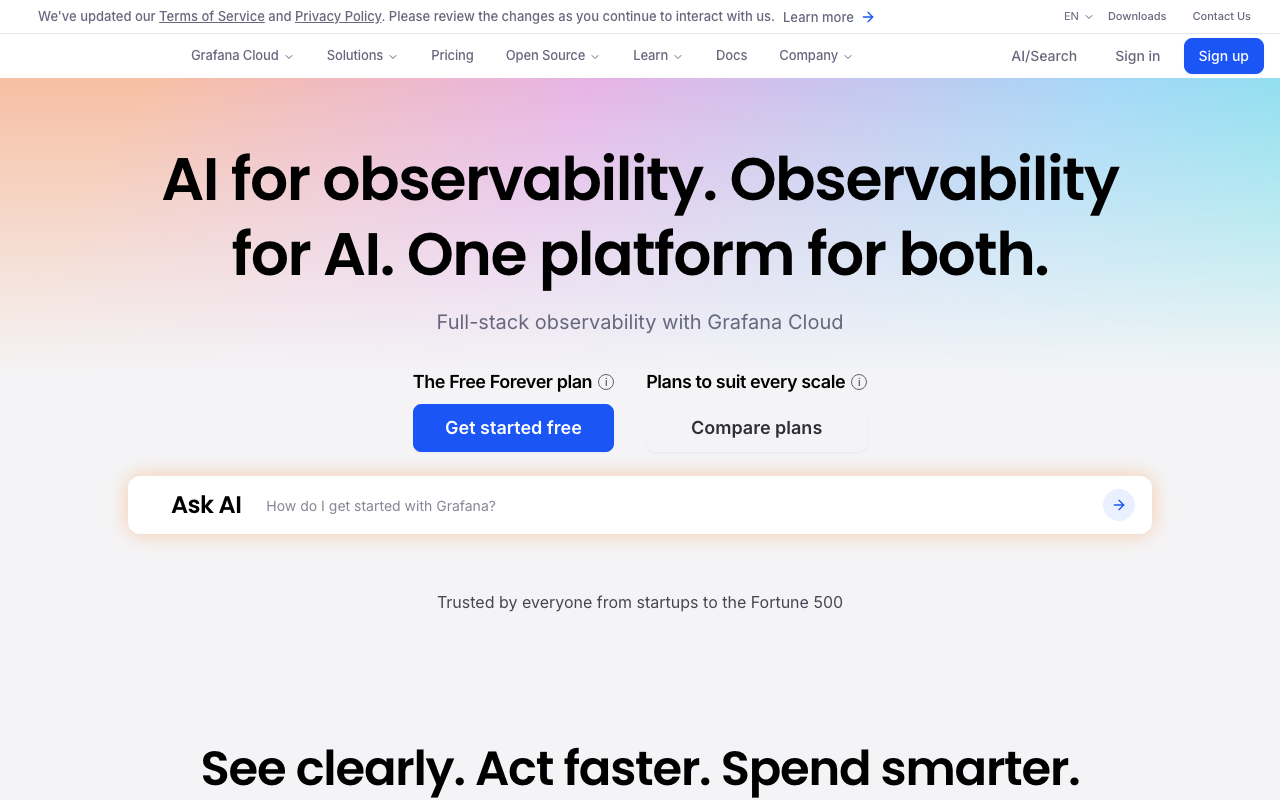
Grafana Cloud has the most useful managed free tier for a small team, because the restrictions are on volume and retention rather than on capability — you get the real product rather than a demonstration of it. The exit path matters as much as the tier itself: the same Prometheus, Loki and Tempo stack runs on your own hardware if the managed bill stops making sense, with the same queries and dashboards intact.
Pros
- Restrictions fall on the two most survivable axes, volume and retention, not on features
- Alerting is real on the free tier rather than crippled, which is the usual free-tier trap
- The self-hosted escape route is the identical software, so outgrowing it is not a migration
- Large community dashboard ecosystem, so most infrastructure is covered without custom work
Cons
- You assemble and correlate the components yourself; nothing wires logs to traces for you
- Metric cardinality is your responsibility and is the fastest way to exhaust the allowance
- Several components to learn, which is more conceptual overhead than a single-product backend
Best for: Small teams who want a genuinely usable managed free tier and want the option to move the whole stack in-house rather than negotiate when it runs out.
Pricing: Free allowance on metric series, log and trace volume with a short retention window, then usage-based charging above it — and self-hosting available as the alternative that converts the bill into hardware.
SigNoz
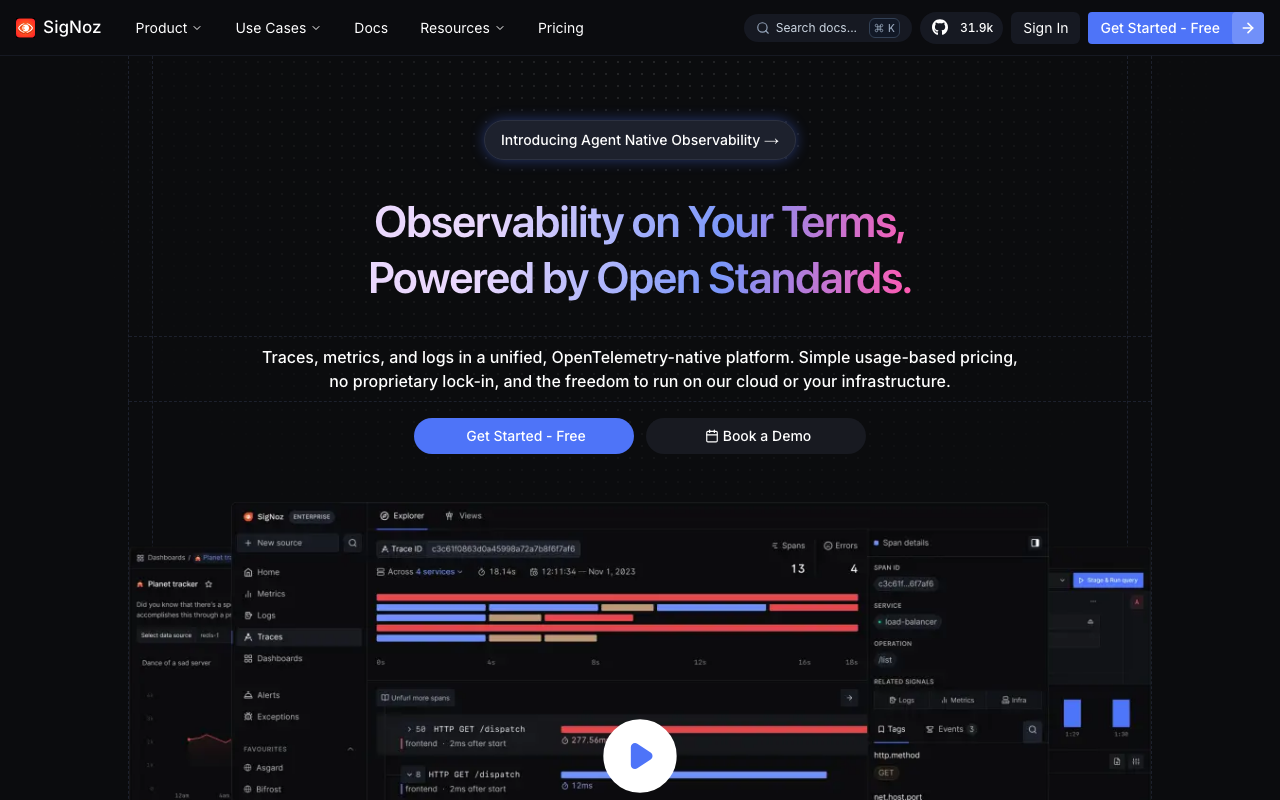
SigNoz belongs here in two senses. The managed tier has the usual free allowance; the more interesting option is the open-source build, which is the same product with no ingestion limit at all. Metrics, traces and logs in one backend, OpenTelemetry native, running on hardware you pay for. That is a different deal from a capped SaaS tier, and for teams that can run a VM it is usually the better one.
Pros
- The open-source build has no ingestion ceiling, so there is no cliff to plan around
- All three signals in one product with no integration work
- OTLP-native ingestion means switching later costs a config change, not re-instrumentation
- Managed and self-hosted are the same build, so you can start on one and move to the other
Cons
- Self-hosting means running a columnar datastore, with the disk and upgrade work that implies
- Smaller integration catalogue than the incumbents, so infrastructure coverage needs more effort
- The managed free allowance is unremarkable; the open-source build is the actual argument
Best for: Teams already emitting OpenTelemetry who can run one VM and would rather own an uncapped backend than manage a SaaS allowance.
Pricing: Managed tiers meter ingested data per signal with retention priced separately; the open-source build carries no licence cost, moving the entire expense into infrastructure and attention.
Uptrace
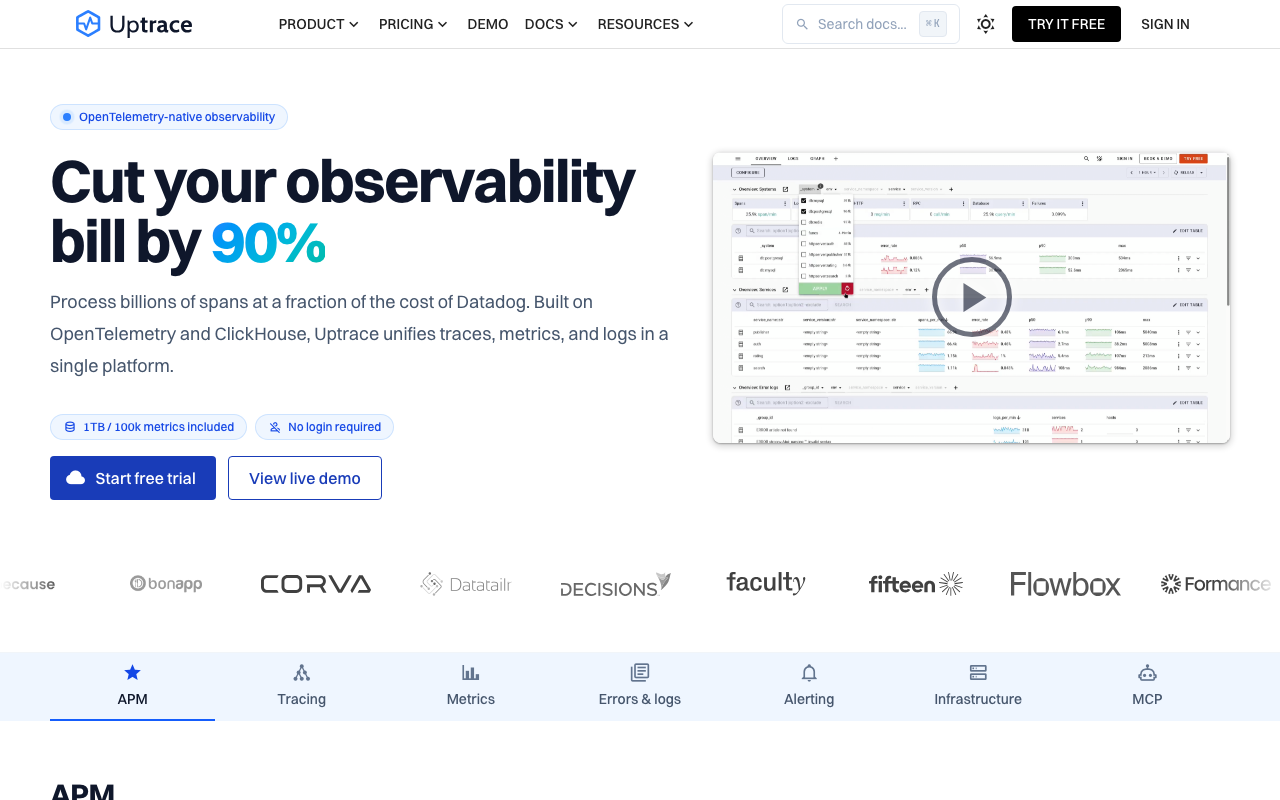
Uptrace has the same shape as SigNoz — self-hosted open source alongside a managed tier — with a leaner footprint, which means it fits beside existing infrastructure rather than requiring dedicated hardware. Smaller community, which counts against it when something breaks at an inconvenient hour, but modest enough that running it is not a project.
Pros
- Lean enough to run alongside existing services rather than on its own machine
- OTLP-native, so instrumentation stays portable regardless of what you do later
- Self-hosted build has no ingestion cap
- Small codebase, which makes reading the source a viable debugging path
Cons
- Smallest community among the OTel-native options, so obscure failures have few existing answers
- Thinner dashboard and integration ecosystem than Grafana
- Fewer engineers have used it, so knowledge does not arrive with new hires
Best for: Teams already comfortable running their own infrastructure who want uncapped OTel-native coverage on the smallest possible footprint.
Pricing: Managed plans meter ingested spans, logs and metric data points with retention tiers; the self-hosted build is licence-free and costs whatever the machine costs.
Prometheus
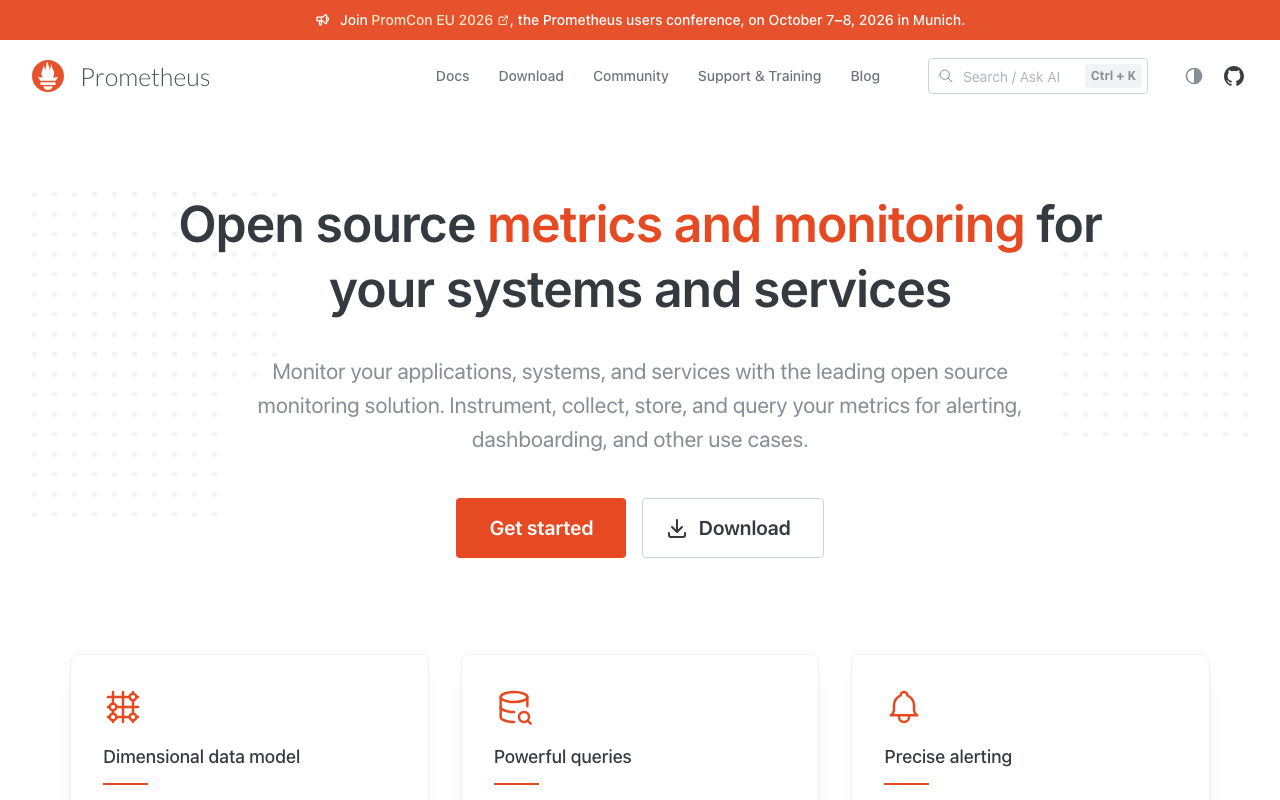
Prometheus is the baseline everything else is measured against, and it is free in the unambiguous sense — no tier, no allowance, no vendor able to change the terms. It does metrics and alerting extremely well and does not do traces or logs at all. PromQL and the pull model are the de facto standard across the industry, so the skills transfer everywhere and so do the exporters.
Pros
- Genuinely free with no allowance, cap or commercial relationship of any kind
- PromQL and the exporter ecosystem are industry standards, so skills and integrations transfer
- Simple operational model — a single binary with local storage for most deployments
- Alertmanager gives you real alert routing and silencing without a paid tier
Cons
- Metrics only; you still need separate products for traces and logs
- Local storage is not designed for long retention, so historical analysis needs another component
- Horizontal scale requires additional projects, which turns one binary into a stack
Best for: Any team that needs metrics and alerting without a vendor relationship, and already accepts it will source tracing and logs elsewhere.
Pricing: Free and open source with no licence cost; you pay in storage, in the components you add for long-term retention and scale, and in the time to run them — see self-hosted observability stacks.
OpenObserve
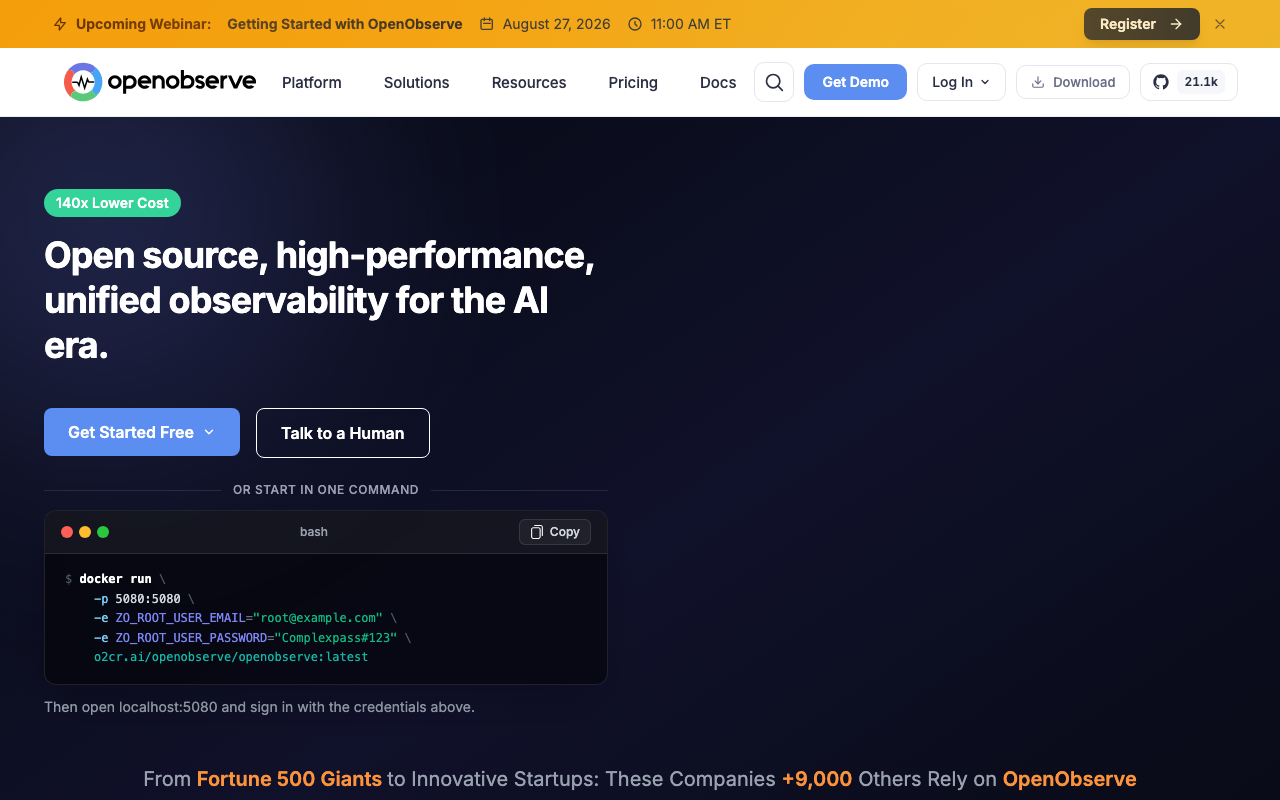
OpenObserve is a newer open-source entrant built around cheap object storage for logs, metrics and traces. The argument is straightforward: keeping observability data on object storage rather than attached disk changes the cost curve at high volume, because storage stops being the thing that constrains retention. Worth evaluating if your problem is log volume specifically.
Pros
- Object-storage-backed design makes long retention affordable at high log volume
- Covers logs, metrics and traces in a single deployment
- Low resource footprint relative to search-engine-based log stacks
- Open source with no ingestion cap on the self-hosted build
Cons
- Younger project with a smaller community and less production folklore to draw on
- Query performance against object storage has different characteristics from local disk
- Ecosystem of integrations and dashboards is still thin compared with established stacks
Best for: Teams whose binding constraint is log volume and retention cost rather than tracing depth, and who already have object storage available.
Pricing: Free and open source when self-hosted, with a managed option metered on ingested volume; the underlying cost is object storage, which is the cheapest tier available to you.
UptimeRobot
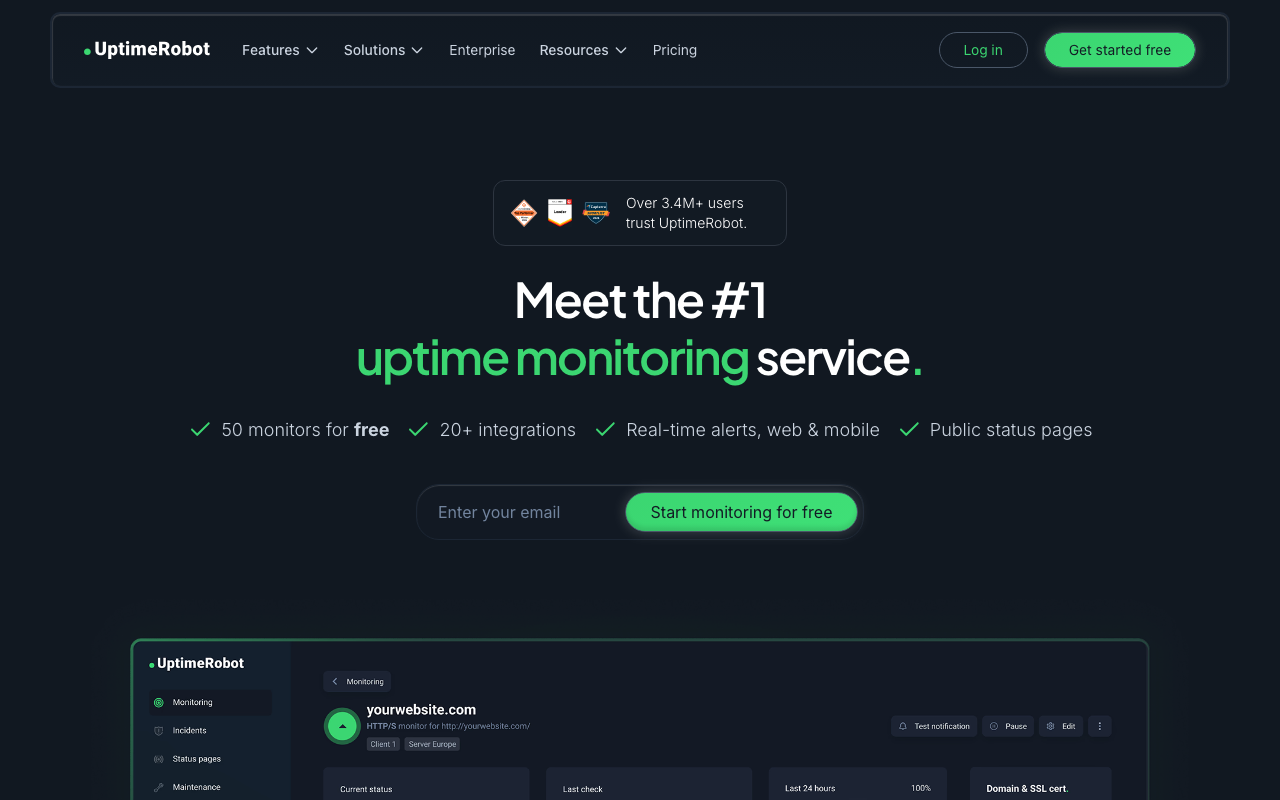
UptimeRobot is not APM and belongs on this list anyway. External uptime checking costs nothing at small scale and catches failures your own instrumentation structurally cannot report, because an application that is down cannot tell you it is down. It is the one category where the free tier is genuinely sufficient for a small production service. Broader options in uptime and synthetic monitoring.
Pros
- Catches total outages, which is the failure mode internal instrumentation cannot report
- Free tier is sufficient for a small service rather than a demonstration
- Setup takes minutes with no instrumentation or agent involved
- Status page and notification routing included, which covers the customer communication path
Cons
- Tells you something is down, never why — it is not a diagnostic tool
- Free-tier check frequency is coarse, so detection latency is measured in minutes
- Notification channel availability varies by tier, and the channel that wakes you may not be free
Best for: Every service in production, as the always-on external check that runs alongside whatever internal observability you have.
Pricing: Free tier bounded by monitor count and check interval, with paid tiers increasing both and adding notification channels and advanced check types.
New Relic
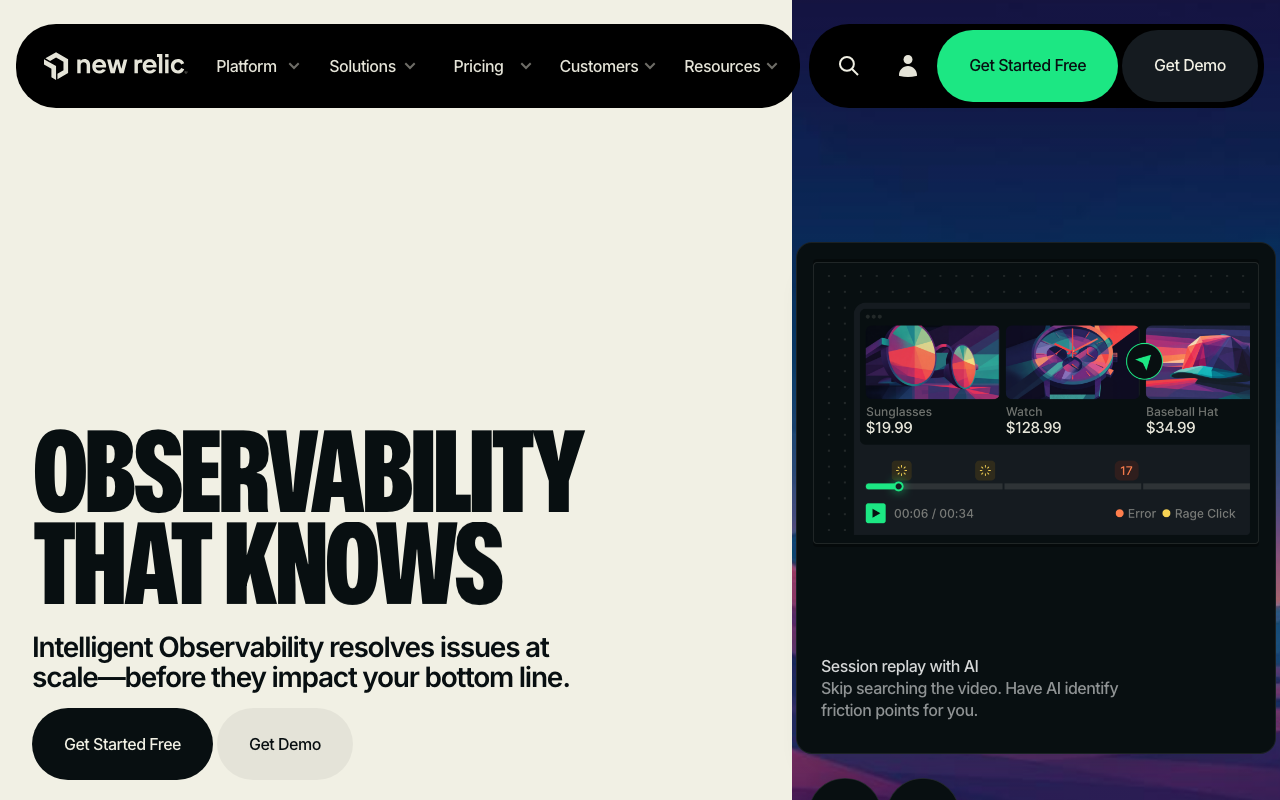
New Relic runs a free tier with an unusual shape: generous on data volume with a per-seat model over the top. That is the inverse of most free tiers, which bind on ingest or hosts and let anyone log in. Whether it suits you depends entirely on whether headcount or data grows faster in your organisation — a two-person team with heavy telemetry does well, a growing team with modest telemetry hits the wall quickly. It is also a full platform rather than a stripped entry product, so outgrowing the free tier is a plan change rather than a migration. Verify current terms directly.
Pros
- Data allowance is generous relative to free tiers that bind on ingest
- Full platform capability rather than a feature-reduced entry product
- Growing past the free tier does not require changing tools or re-instrumenting
- One query language across metrics, traces and logs
Cons
- Seat limits are exactly the wrong constraint during an incident, when more eyes help most
- Ingest-based billing above the allowance punishes verbose logging without a per-service ceiling
- Proprietary dashboards and query language, so the eventual exit cost matches any incumbent
Best for: Very small teams with a disproportionately large telemetry footprint who need full platform capability and can accept a hard cap on who logs in.
Pricing: Free allowance on data ingested with charges above it, plus per-user tiers that gate capability — headcount and data volume move the bill independently.
How to choose
Name the axis that binds you first. Cardinality if you run Kubernetes with per-pod labels, volume if you log verbosely, seats if you are growing headcount. Everything else is noise.
Rule out anything that forces head sampling if this is your production incident tool.
Test alerting before anything else. Configure one alert that pages a real phone and verify it fires. A tier you cannot be woken by is a dashboard, not a monitor.
Run the rare-error test. Generate a known-rare failure and check you can still find it an hour later.
Decide the exit before you enter. When the free tier ends, is the next step a paid plan, a self-hosted build of the same product, or a full migration? The middle option is worth a lot, and it is why open source-backed vendors are a lower-regret starting point than pure SaaS.
| Tool | What free means here | Binding restriction | Exit when it ends |
|---|---|---|---|
| Grafana | Managed free tier | Volume and retention | Self-host the identical stack |
| SigNoz | Free tier plus uncapped open source | Managed allowance only | Run the open-source build |
| Uptrace | Free tier plus uncapped open source | Managed allowance only | Run the open-source build |
| Prometheus | Fully open source | None commercially; storage and scale technically | Add long-term storage components |
| OpenObserve | Fully open source | None on self-hosted | Stay self-hosted, grow object storage |
| UptimeRobot | Free tier | Monitor count and check interval | Paid tier or a synthetic monitoring tool |
| New Relic | Free tier | Seats | Paid user tiers |
Frequently asked questions
Is a free APM tier enough for a production application?
For a small application with one or two services, often yes — provided alerting is not crippled and traces are not head-sampled. For anything where an outage costs real money, treat the free tier as a starting point with a known upgrade path rather than a permanent arrangement.
What is the catch with open-source APM being free?
The software is free; running it is not. You pay in servers, storage, upgrades and the engineer hours to keep it healthy. That trade is favourable at higher data volumes and unfavourable at low ones, which is the opposite of most people’s intuition.
How do I stop a free tier from silently dropping data?
Put an OpenTelemetry collector between your services and the backend, and configure sampling and redaction there rather than relying on vendor-side defaults. You then control what is dropped, and you can implement tail sampling that preferentially keeps errors even if the backend would not.
Which free tier should a solo developer start with?
External uptime monitoring plus one backend that handles traces and logs together. That combination catches both “it is down” and “it is slow and I do not know why”, which covers most of what actually goes wrong. The startup shortlist goes through the options in more detail.
Related reading
- Best APM tools for developers — the category map and why pricing units make comparison hard.
- Best APM tools for startups — time to first value and when the bill jumps.
- Best open source APM tools — free in the unambiguous sense, and what it costs in hours.
- Best self-hosted observability stacks — assembling the components yourself.
- Best uptime and synthetic monitoring tools — the one category you should never run without.