Every APM comparison has the same shape: twelve logos, a paragraph each, everything “powerful” and “easy to set up”, no opinion anywhere. That list is useless, because the hard part of picking an APM tool was never finding the candidates. The hard part is that four price per host, three price per gigabyte ingested, one per span, one per monthly active user, and two charge a seat fee on top. You cannot put those on a spreadsheet and compare them honestly, which is exactly why vendors like it that way.
I have run this evaluation more than once. At LoginRadius we monitored a platform serving 3,000 businesses and around 400 million end users, and the thing that decided our tooling was almost never the feature grid. It was the pricing unit, and whether the unit was something our architecture would suddenly produce a great deal more of.
So this is a map rather than a list: what the categories actually are, what OpenTelemetry did and did not change, why like-for-like pricing comparison is hard, and a decision procedure that routes you to the right article for your situation.
Key takeaways
- APM is not one category. Metrics, traces, logs, RUM and profiling have different storage economics, and vendors that are excellent at one are usually mediocre at another.
- OpenTelemetry made instrumentation portable and made storage the real lock-in. Your agent is no longer the thing that traps you; your dashboards and alert rules are.
- Vendors price on incompatible units. Normalise every quote to cost per month at your projected data volume before you compare anything else.
- The correct tool depends far more on your stage, your runtime and your compliance requirements than on any feature checklist.
APM is five different products sold under one word
“APM” originally meant tracing a request through an application and finding the slow part. It now means whatever the vendor selling it wants it to mean. Underneath the marketing there are five distinct data types, and each has its own storage cost curve.
Metrics are numeric time series: request rate, error rate, p99 latency, queue depth.
They compress extremely well. The failure mode is cardinality — every unique combination
of label values creates a new series, and one engineer adding user_id as a label can
multiply your series count by a million. Cardinality is where metrics bills explode.
Traces follow a single request across services as a tree of spans. They answer “why was this request slow”, which metrics structurally cannot. They are expensive because a busy service emits an enormous number of spans, so almost every tracing product samples — and how it samples determines whether you can find the rare broken request at all.
Logs are unstructured or semi-structured events. Cheapest to produce, most expensive to store and search, and the category where “we will just log everything” becomes a line item somebody in finance asks about.
Real user monitoring instruments the browser or mobile app: page load timing, Core Web Vitals, JavaScript errors, session replay. Different data shape, priced per session or per monthly user rather than per host, and I would treat it as a separate purchase — the dedicated RUM tools usually beat the RUM module bundled into a backend APM.
Continuous profiling samples CPU and memory at the function level in production. It is the newest of the five and the one most likely to be half-built in a product that claims full coverage.
These overlap in confusing ways. Traces can generate metrics. Logs correlate into traces by trace ID. When a vendor says “unified observability” they mean one query language and one storage engine behind all five — genuinely valuable, and also why their bill arrives as a single opaque number.
The three architectural bets vendors have made
Rather than ranking tools, it helps to see which architecture each one committed to, because that determines what they are good at and what they will always be awkward at.
The all-in-one agent platform. One vendor owns the whole pipeline. One agent collects every data type, hundreds of integrations exist on day one, and correlation across signals is somebody else’s engineering problem. Datadog, Dynatrace and New Relic sit here. You pay for it in modular pricing that compounds, and in an exit cost measured in rebuilt dashboards.
The composable open-source stack. Assemble the pieces yourself and pay for hosting rather than software. Grafana and Elastic anchor this bet. Every component is separately replaceable and the query languages are open, but you are the integrator: correlation between logs and traces works because you configured it to, not because a vendor guaranteed it.
The OpenTelemetry-native backend. Assume OpenTelemetry is the only instrumentation layer that matters and build storage and query specifically for it. SigNoz and Honeycomb are the clearest examples. No proprietary agent, no proprietary wire format, and a structurally different lock-in profile — which is why this category is growing.
Everything below is one of those three bets, plus the instrumentation standard that made the third one possible.
What OpenTelemetry changed about lock-in
Before OpenTelemetry, choosing an APM vendor meant choosing an instrumentation agent. The agent was proprietary, it was compiled or injected into your application, and switching vendors meant re-instrumenting every service. That was the lock-in, and it was effective. OpenTelemetry removed it, and three things follow that are more specific than “avoid lock-in”.
The collector is a switch, not a pipe. Once your services emit OTLP to a collector, changing backends is a config change in the collector, not a code change across twelve repositories. You can also fan out to two backends at once, which is the only sane way to run a migration — dual-write for a fortnight, compare what each shows during a real incident, then cut over.
Lock-in moved to the query layer. Your instrumentation is portable now; your dashboards, alert definitions, SLO configurations and saved queries are not. Those are written in the vendor’s query language against the vendor’s schema and represent years of institutional knowledge. Budget for rebuilding them, because nobody’s importer works as well as the demo suggested.
Semantic conventions are the real interop story. OTel does not just define a wire format, it defines what an HTTP span attribute is called — which is what makes a dashboard conceptually portable between backends. Those conventions are still evolving, so instrumentation written against different SDK versions will disagree about attribute names, and you will spend an afternoon reconciling that.
What OpenTelemetry did not change: auto-instrumentation quality still varies enormously by language. The JVM and .NET agents are mature; Go requires more manual work because the language has no runtime hooks to attach to. That difference is large enough to influence your choice, which is why the runtime-specific guides for Node.js, Python, Go, Java and .NET exist separately.
Needs first-hand data: Instrument one identical service with the OTel auto-instrumentation for each of Node.js, Python, Go, Java and .NET. Record spans produced per request out of the box, manual instrumentation lines required to reach equivalent coverage, and added p99 latency under a fixed synthetic load. This is the table that would make the runtime guides definitive.
Why like-for-like pricing comparison is genuinely hard
Here is the actual structural problem. Vendors do not price on the same unit, and the units are not convertible without knowing your architecture.
Per host or per agent scales with infrastructure count, and bites hardest on Kubernetes, autoscaling groups and estates made of many small nodes.
Per gigabyte ingested scales with log and event verbosity, and bites on chatty debug logging and high request volume.
Per span or per trace scales with request volume multiplied by service count, so it bites on microservices and deep call chains.
Per custom metric series scales with label cardinality, and bites the moment any team adds a high-cardinality label to a metric.
Per monthly active user or session scales with product usage, which is the RUM meter.
Per seat scales with headcount that has access, and bites large orgs or anyone who wants read-only viewers.
The trap is that these units respond differently to the same architectural change. Split one service into six and per-host pricing rises modestly, per-span pricing rises sharply, per-GB pricing barely moves. Move from VMs to small Kubernetes pods and per-host pricing detonates while per-GB is unaffected — the subject of Kubernetes APM. Go serverless and per-host stops making sense at all, which is why serverless observability is priced differently again.
So the only meaningful comparison is: estimate your volume in each unit for the architecture you will have in twelve months, then have each vendor quote against those numbers rather than today’s.
Needs first-hand data: For one real service, capture a week of production telemetry and measure it in every unit simultaneously — host-hours, GB of logs after compression, spans emitted, distinct metric series, active sessions. Publishing that single normalisation table would be more useful than any feature comparison, because it lets a reader convert one vendor’s quote into another’s unit.
Two further things distort every quote. Committed-use discounts are large and lock you in for a year, so the attractive number in the proposal is contingent on a volume forecast you will get wrong. And overage pricing is usually much worse than committed pricing, so the failure mode is not “we overpaid slightly”, it is “we blew through commit in October and paid list price for the rest of the year”.
OpenTelemetry: the standard underneath, not a product
OpenTelemetry is not one of the products below. It is the instrumentation standard — the SDKs, the semantic conventions and the collector — that every serious vendor now ingests. It has no dashboard, no alerting, no vendor and no bill, so ranking it against Datadog is a category error: you do not buy it instead of a backend, you run it underneath one. What the decision does determine is how reversible the backend choice is, which makes it the single highest-leverage decision in this whole exercise. Adopt it first, then choose a backend, and changing vendors becomes a config change rather than a re-instrumentation project.
What it gives you
- Instrumentation becomes portable across every backend listed here
- The collector can fan out to two backends at once, which is how you run a safe migration
- Redaction and sampling policy live in infrastructure you control, before data leaves your network
- Semantic conventions make dashboards conceptually portable, not just the raw data
What it does not do
- Auto-instrumentation maturity varies sharply by runtime; Go in particular needs manual work
- Semantic conventions are still evolving, so different SDK versions disagree on attribute names
- It stores nothing and displays nothing, so you still choose and pay for one of the backends below
- Running a collector fleet is real infrastructure you now own and must keep healthy
- It carries no licence cost but is not free: the expense is that collector infrastructure, the engineering time to keep instrumentation current with the conventions, and the backend bill underneath it all
Datadog

Datadog is the reference implementation of the all-in-one agent platform: one agent, every data type, several hundred integrations, and a UI that assumes you will buy all of it. The pitch is real — correlation across signals is easier when one vendor owns the whole pipeline, and the integration catalogue means your Postgres and Redis dashboards exist on day one instead of week three. The architectural consequence is that its commercial model mirrors its product model: each capability is a separate module with a separate meter.
Pros
- The broadest integration catalogue in the category, so most infrastructure is monitored the day you install the agent
- Genuine cross-signal correlation because metrics, traces, logs and RUM share one storage and query layer
- Deep operational maturity — the features shown in the demo are the features you get, in every region
- Enormous installed base, so your engineers likely already know the query syntax
Cons
- Modular pricing compounds; every module you enable adds another multiplier to the same bill
- Per-host billing punishes exactly the architectural changes teams make as they grow (more services, more and smaller pods)
- Exit cost is real and lives in your dashboards and monitors, not your instrumentation
Best for: Well-funded teams who want one vendor for everything and would rather pay an invoice than spend engineering weeks assembling and correlating a stack themselves.
Pricing: Per-host subscription with separate meters layered on top — infrastructure, APM, logs by volume ingested, custom metric series, RUM by session. Annual commitments discount the rate, and overage on any single meter can dominate the total. If the number is growing faster than your traffic, the Datadog alternatives piece is the migration-shaped version of this article.
Dynatrace
Dynatrace takes the same all-in-one position as Datadog but leans much harder on automation. Its agent performs dependency discovery itself, building a topology of your estate without you describing it, and its root-cause engine tries to hand you a single answer rather than a dashboard to interpret. That works well in large heterogeneous estates where nobody holds a complete mental model of the system — exactly the enterprise Java and .NET shop it sells into. It works less well if you want to define your own instrumentation semantics; the automation is the product, and fighting it is unrewarding.
Pros
- Automatic topology and dependency discovery does real work in estates with thousands of services
- Root-cause analysis surfaces a candidate answer rather than leaving you to correlate dashboards
- Strongest managed on-premise story among the large SaaS platforms
- Mature agents for the legacy-adjacent runtimes cloud-native vendors treat as an afterthought
Cons
- Highly opinionated agent — you get the vendor’s model of your system, not yours
- Custom instrumentation semantics fight the automation rather than extending it
- Enterprise-shaped commercially, which means a sales cycle before you can evaluate seriously
Best for: Large, partly legacy estates where the dependency graph exceeds any one person’s understanding and automated root-cause analysis is worth more than query flexibility.
Pricing: Consumption-based across separate meters for full-stack monitoring, infra-only hosts, log ingest and retention, and synthetic checks, sold on annual commitments. The practical variable is how many hosts fall into full-stack versus infra-only.
New Relic
New Relic sits in the same all-in-one bracket as Datadog and Dynatrace but with a different pricing philosophy: rather than metering each capability separately, it charges principally on data ingested and on the humans who log in. That single structural choice changes which teams it suits — a team with heavy telemetry and few engineers experiences it very differently from a team with modest telemetry and a large headcount. The product itself covers the full spread of metrics, traces, logs and browser monitoring, with a query language over a single underlying data store. The three-way comparison is worth reading before any of these three reach procurement.
Pros
- Ingest-plus-seat model is far easier to forecast than a stack of per-capability meters
- All capabilities available on every plan rather than gated behind product SKUs
- One query language across every telemetry type, so skills transfer across signals
- Unusually usable entry tier, which makes hands-on evaluation cheap
Cons
- Per-seat charging is a poor fit for large orgs that want everyone to be able to look during an incident
- Ingest-based billing makes verbose logging expensive with no per-service ceiling
- Proprietary query language and dashboard format, so the exit cost is the same as any all-in-one platform
Best for: Teams with a large data footprint and a small number of engineers who need full access, where per-host metering would be punishing but seat count stays contained.
Pricing: Charged on data ingested plus a per-user tier, with different user tiers granting different capability levels. Data volume and headcount growth are the two independent variables that move the bill.
Grafana
Grafana is the centre of gravity for the composable stack — Grafana for visualisation, Prometheus or Mimir for metrics, Loki for logs, Tempo for traces, Pyroscope for profiles. Every piece is separately replaceable, the query languages are open, and you can run the identical stack yourself or buy Grafana Cloud and skip the operations. That optionality is the whole point: the managed product and the self-hosted product are the same software, so changing your mind later is a hosting decision rather than a migration.
Pros
- The same stack runs managed or self-hosted, with the same queries and dashboards either way
- Component-level replaceability — swap the metrics backend without touching visualisation
- Open query languages (PromQL, LogQL, TraceQL) with skills that transfer outside the vendor
- Enormous dashboard and plugin ecosystem, including for infrastructure the vendors ignore
Cons
- You are the integrator; log-to-trace correlation exists because you wired it, not by default
- Multiple components means multiple things to operate, upgrade and reason about when self-hosted
- Metric cardinality is your problem to control, and it is the fastest way to a surprise bill
Best for: Teams that want the option to leave without re-instrumenting or rebuilding dashboards, and can accept doing the integration work themselves in exchange.
Pricing: Managed tiers meter metric series, log and trace volume ingested, and retention independently, with a usage-based model above an included allowance; self-hosting converts all of it into hardware and engineer time. If you are weighing the managed version against the incumbent, see Grafana Cloud vs Datadog.
Elastic
Elastic is the other long-standing composable option, arriving at observability from the log-search side rather than the metrics side. The whole stack sits on Elasticsearch, which means full-text search over telemetry is a first-class operation rather than a bolt-on, and it means anyone who already runs Elasticsearch for product search can transfer their operational knowledge directly. The counterpoint is that Elasticsearch’s storage model was built for full-text search, not time series, and running it at observability volume is a specialist skill.
Pros
- Full-text search over logs is genuinely stronger than in metrics-first platforms
- Runs self-managed, including air-gapped, with the same features as the hosted offering
- Existing Elasticsearch operational knowledge transfers with no relearning
- One stack covers observability and security analytics, which shortens an internal sell
Cons
- Operating Elasticsearch at observability volume is a specialist role with a salary attached
- Storage model is search-shaped rather than time-series-shaped, so metrics are the weaker signal
- Cluster sizing and index lifecycle management are ongoing work, not a one-time setup
Best for: Organisations already running Elasticsearch competently, or anyone whose hard requirement is a self-managed or air-gapped deployment with feature parity.
Pricing: Resource-based for the hosted tiers — you pay for the compute and storage the cluster consumes, by deployment size and retention tier — while self-managed shifts the cost entirely into hardware and the people who operate it.
SigNoz
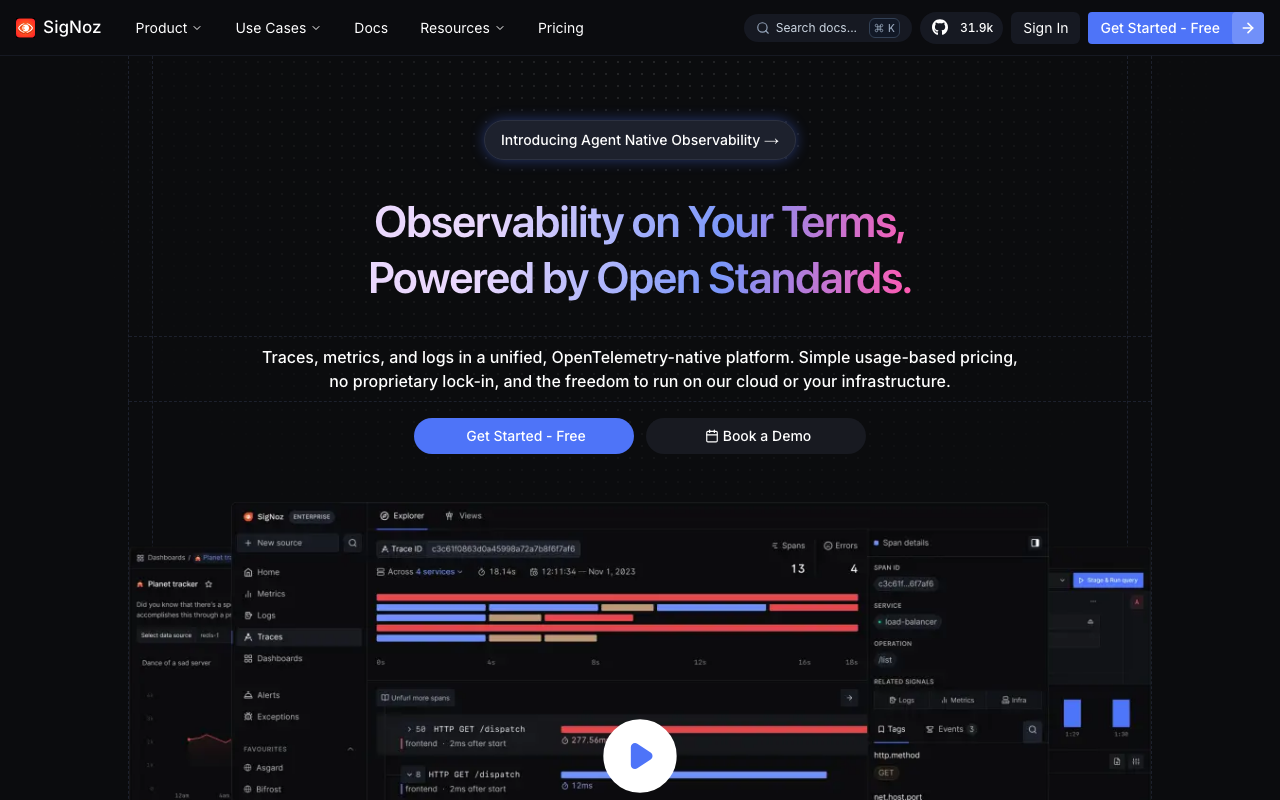
SigNoz is the clearest example of the OpenTelemetry-native backend: one open-source product covering metrics, traces and logs, ingesting OTLP natively with no proprietary agent anywhere in the path. Because OTLP is the ingestion format rather than a translation layer, there is no proprietary format to migrate off later — a structurally different lock-in profile from the all-in-one platforms. It runs self-hosted or as a managed service, and it is the same product either way. The OpenTelemetry-native platforms article covers who is genuinely OTel-native versus who accepts OTLP at the door and converts it to something proprietary underneath.
Pros
- Native OTLP ingestion means no vendor agent and no re-instrumentation if you move
- Metrics, traces and logs in one backend without integrating three products
- Self-hosted and managed are the same build, so the exit is a hosting change
- Small enough operationally to run on a single machine for a small estate
Cons
- Smaller integration catalogue than the incumbents, so infrastructure dashboards are more DIY
- Younger product, which shows in the depth of the more advanced query and alerting features
- Self-hosting at volume means owning a columnar store you did not previously operate
Best for: Teams already committed to OpenTelemetry who want one backend for all three signals and want the option to self-host without changing products.
Pricing: Managed tiers meter ingested data by signal with retention as a separate dimension; the open-source build has no licence cost and no ingestion ceiling, moving the whole cost into infrastructure you run.
Honeycomb
Honeycomb belongs in the OTel-native group but made a different bet about querying. Rather than storing pre-aggregated metrics and expecting you to build dashboards in advance, it stores wide, high-cardinality events and expects you to explore them interactively — slicing by any attribute, including ones nobody anticipated. If your incidents are mostly “this is broken for one customer on one code path and no dashboard shows it”, that model finds the answer faster than anything dashboard-first. If your incidents are mostly “the host ran out of disk”, you are paying for a capability you will not use.
Pros
- High-cardinality attributes are free to query rather than the thing that breaks your bill
- Interactive exploration finds unanticipated failure modes that predefined dashboards miss
- Event volume is the single meter, so cost is predictable from request volume alone
- Strong tail-sampling story, which keeps the rare error rather than a random fraction
Cons
- Weak fit for classic infrastructure monitoring; it is not where you watch disk and CPU
- The query-first workflow needs teams to learn a different investigative habit
- Narrower product surface than the all-in-ones, so it usually sits alongside something else
Best for: Teams debugging complex, per-customer or per-code-path behaviour in distributed systems, who already have infrastructure monitoring handled elsewhere.
Pricing: Metered on events ingested, with retention tiers, and no separate per-host or per-seat charge — so cost tracks request volume and sampling policy rather than infrastructure count. I would not pick Honeycomb as a team’s first observability tool, and I would seriously consider it as their second.
How to choose
Run this in a week, not a quarter.
Day one — write down your pricing unit exposure. Hosts or pods, GB of logs a day, spans per second at peak, distinct metric series. If you cannot answer these, that is your first task regardless of which vendor you pick.
Day two — eliminate on constraints, not features. Do you need SSO, RBAC, regional data residency, audit logs, or an on-prem option? If yes, most of the market is already gone and you should be reading APM for enterprise. If no, and you need something running before your next incident, start with APM for startups.
Day three — instrument one service with OpenTelemetry, not the vendor’s agent. That gives you a portable baseline you can point at multiple backends without redoing work.
Days four and five — send the same data to two or three candidates. Free tiers are sufficient, and knowing what a free tier actually costs you in retention and sampling is part of the evaluation.
Then run one real debugging session in each. Take a bug you already understand and time how long each tool takes to lead you to the cause. That separates candidates better than any feature matrix, because it tests the query experience you will live in.
| Tool | Architectural bet | Meter that decides your bill | Picks itself when |
|---|---|---|---|
| Datadog | All-in-one agent platform | Hosts, plus a meter per module | You want one vendor for everything and can absorb modular pricing |
| Dynatrace | All-in-one, automation-first | Full-stack host hours | Nobody understands the dependency graph any more |
| New Relic | All-in-one, ingest-priced | Data ingested plus seats | Telemetry is large and the engineering team is small |
| Grafana | Composable open-source | Series, volume and retention | Keeping the option to self-host is worth doing integration work |
| Elastic | Composable, search-first | Cluster resources consumed | Self-managed or air-gapped is a hard requirement |
| SigNoz | OpenTelemetry-native | Ingested data per signal | You are already on OTel and want one backend for all signals |
| Honeycomb | OTel-native, query-first | Events ingested | Incidents are per-customer, per-code-path mysteries |
If the answer comes back “everything is too expensive at our volume”, run it yourself. Open source APM and self-hosted observability stacks cover what that costs in engineer time — the number people forget to count.
Frequently asked questions
Is APM the same thing as observability?
No. APM means application-level performance monitoring — instrument the app, trace requests, find slow code. Observability is the broader property of being able to ask new questions of your system without shipping new instrumentation. In practice most vendors sell the former and call it the latter.
Do I still need a separate uptime monitor if I have APM?
Usually yes. APM tells you what is happening inside your application, which is no help when the application is unreachable or DNS is broken. External checks run from outside your infrastructure and catch failures your own agents cannot report, which is why uptime and synthetic monitoring stays a separate line item.
Should I use OpenTelemetry even if my vendor has its own agent?
For most teams, yes. The vendor agent is often easier on day one and occasionally captures more detail for that vendor’s specific features. OpenTelemetry costs you a little more setup and buys you the ability to change your mind later without re-instrumenting every service. Given how often observability bills force a re-evaluation, that optionality is worth the extra day.
What is the single biggest mistake teams make choosing APM?
Evaluating on the demo dataset. The vendor’s demo environment is clean, well-instrumented and small. Your environment is none of those things. Always evaluate with your own telemetry, at something close to your own volume, on a bug you already know the answer to.
Related reading
- Best APM tools for startups — free tiers, time to first value, and exactly when they stop being free.
- Best APM tools for enterprise — SSO, RBAC, data residency and the procurement blockers that eliminate most of the market.
- Best free APM tools — the anatomy of a free tier and what it silently drops.
- Best open source APM tools — when running it yourself is cheaper than the invoice, and when it is not.
- Best OpenTelemetry-native platforms — who ingests OTLP natively versus who converts it internally.
- Datadog vs New Relic vs Dynatrace — the three all-in-one platforms, compared on pricing model rather than features.