Every comparison of these three ends up as a feature grid, and every feature grid concludes that all three do distributed tracing, infrastructure metrics, logs, RUM, and synthetics. True and useless. All three will show you a flame graph of a slow request. The difference is what they assume about your organization, and what they charge you as you grow into that assumption.
I’ve run observability procurement twice and inherited it once. The pattern repeats: a team picks on the demo, and eighteen months later they’re negotiating a renewal against a bill nobody modeled. The bill follows from the pricing model, and the pricing model follows from each vendor’s architecture. That’s what this comparison is about.
Short version: Datadog is a wide catalog of separately-priced products with unbeatable integration coverage. New Relic is one platform with one consumption meter and a per-user component. Dynatrace is a deeply automated agent that wants ownership of the host and pays you back with dependency mapping and root cause analysis you never configured.
Key takeaways
- Datadog bills per product per host, so cost grows with how many of its modules you adopt, not just how much you run.
- New Relic bills on data ingested plus billable users, which makes it cheap to instrument broadly and expensive to give everyone access.
- Dynatrace’s OneAgent auto-discovers processes and dependencies, which is the fastest path to a working map — if your platform team will let an agent run privileged on every host.
- Onboarding effort and steady-state cost point in opposite directions across these three. Decide which one you can afford to be wrong about.
Three different bets, not three implementations
Treat these as three different bets on how observability should be sold and operated.
Datadog bets on catalog. Once your infrastructure metrics live in one place, adding the next module beats evaluating a second vendor — so it ships modules faster than anyone and prices each one separately.
New Relic bets on consolidation. One telemetry database, one query language, one meter on data ingested. The bet is that you’d rather reason about a single number — how much telemetry am I sending? — than about which modules are enabled on which hosts.
Dynatrace bets on automation. The expensive part of observability isn’t the data, it’s the human minutes spent assembling a mental model during an incident, so pay for automation that assembles it in advance.
Three bets, three different failure modes. That’s the useful part, and it shows up most clearly in the shape of the meter.
Pricing models, not prices
Don’t compare list prices. Compare the shape of the meter, because that’s what determines whether your bill tracks your business or surprises you.
Datadog’s model punishes breadth in two directions at once. Every product you enable multiplies against host count, and custom metrics are billed on unique time series — so an engineer who adds a user_id or request_id tag to a metric can move the bill without changing traffic at all. That’s the most common cost incident I’ve seen, and it isn’t a billing bug, it’s the model working as designed. If you’re living this, the Datadog alternatives breakdown segments replacements by which part of the bill hurt.
New Relic’s model is easier to forecast on the data side and harder on the people side. Ingest scales with log verbosity, so a service that starts logging every request at DEBUG shows up on the invoice. The more common surprise is organizational: giving every engineer, SRE, and support person a login is priced, so access policy becomes a budget decision. That tension drives most searches for New Relic alternatives.
Dynatrace’s model tracks the host, sized by memory. Predictable for stable fleets of long-lived VMs, less so for Kubernetes clusters that scale nodes up and down or a few memory-heavy JVM hosts. The Kubernetes APM guide covers per-host billing against elastic infrastructure in more depth.
Needs first-hand data: Take one representative service — same host count, same traffic, same log volume — and get a written quote from all three for a 12-month term. Record the effective monthly cost and, more importantly, the modeled cost at 3x host count and 3x log volume. The slope matters more than the intercept.
Onboarding: automatic, guided, and assembled
Dynatrace gets you to a working dependency map fastest, Datadog gets you to a working dashboard fastest, and New Relic sits between them.
Install OneAgent on the host and it injects into supported runtimes, discovers what’s running, and draws the service topology. You did not write a config file listing your services. For a brownfield estate where nobody has a current architecture diagram, that’s the differentiator — the map is often the first accurate picture the team has had in years. The cost: the agent runs with real privileges and touches your processes, which is a conversation with platform and security before it’s a technical task. In locked-down environments that conversation outlasts the evaluation.
Datadog’s onboarding is a different kind of fast: install the Agent, enable integrations by name, get well-designed out-of-box dashboards for Postgres, Redis, Kafka, nginx, RDS, and hundreds of others. Nothing is inferred for you the way Dynatrace infers it, but almost nothing is missing from the catalog either. For a heterogeneous stack with lots of managed services, the integration library is the reason to pick it.
New Relic’s onboarding is agent-per-language plus a guided install that detects common services. Its instrumentation quality for mainstream runtimes is solid and has been for a long time. What you get at the end is one place where everything landed — more useful than it sounds if you’re currently stitching four tools together during incidents.
All three ingest OpenTelemetry data, which changes the calculus: instrument your applications once with vendor-neutral SDKs and the vendor decision stays reversible. If that’s your priority, start from the OpenTelemetry-native platforms angle instead.
Needs first-hand data: Time onboarding on one non-trivial service per vendor — account creation to a trace that crosses two services with database spans attached. Record wall-clock hours, split between approvals and configuration.
Datadog

Datadog is a catalog company. It has an integration for nearly everything you run and ships new products at a rate no competitor matches — infrastructure, APM, logs, RUM, synthetics, database monitoring, security, CI visibility, LLM observability. Each is strong, and each is also a separate SKU. Collection is agent-based with an enormous library of named integrations, so the path to a working dashboard is enabling a checkbox rather than writing collector config. Architecturally that means the value compounds with adoption, and so does the bill.
Pros
- The largest first-party integration catalog in the category, each shipping a curated dashboard and sensible default monitors
- Cross-product navigation works with no configuration — infrastructure spike to traces in that window to the logs of that container
- Product velocity: new categories arrive as first-party modules rather than as third-party bolt-ons
- Alerting is mature, with composite monitors, anomaly detection, and reasonable no-data and flapping defaults
Cons
- Cost governance is a permanent job, not a setup task; custom metric cardinality and log indexing both need active management
- Every module is a separate SKU multiplied by host count, so breadth of adoption and breadth of fleet compound
- Dashboards, monitors, and query syntax are Datadog-only, so an exit is a rebuild rather than a migration
Best for: Broad, heterogeneous estates with many managed cloud services, where someone will own cost governance as an ongoing responsibility.
Pricing: Per-host subscription charged separately per product, with additional meters for custom metrics billed by unique time series, indexed log events, APM spans, and container counts. Annual commitments discount the base, but a single meter — usually cardinality or log indexing — can dominate the invoice.
New Relic
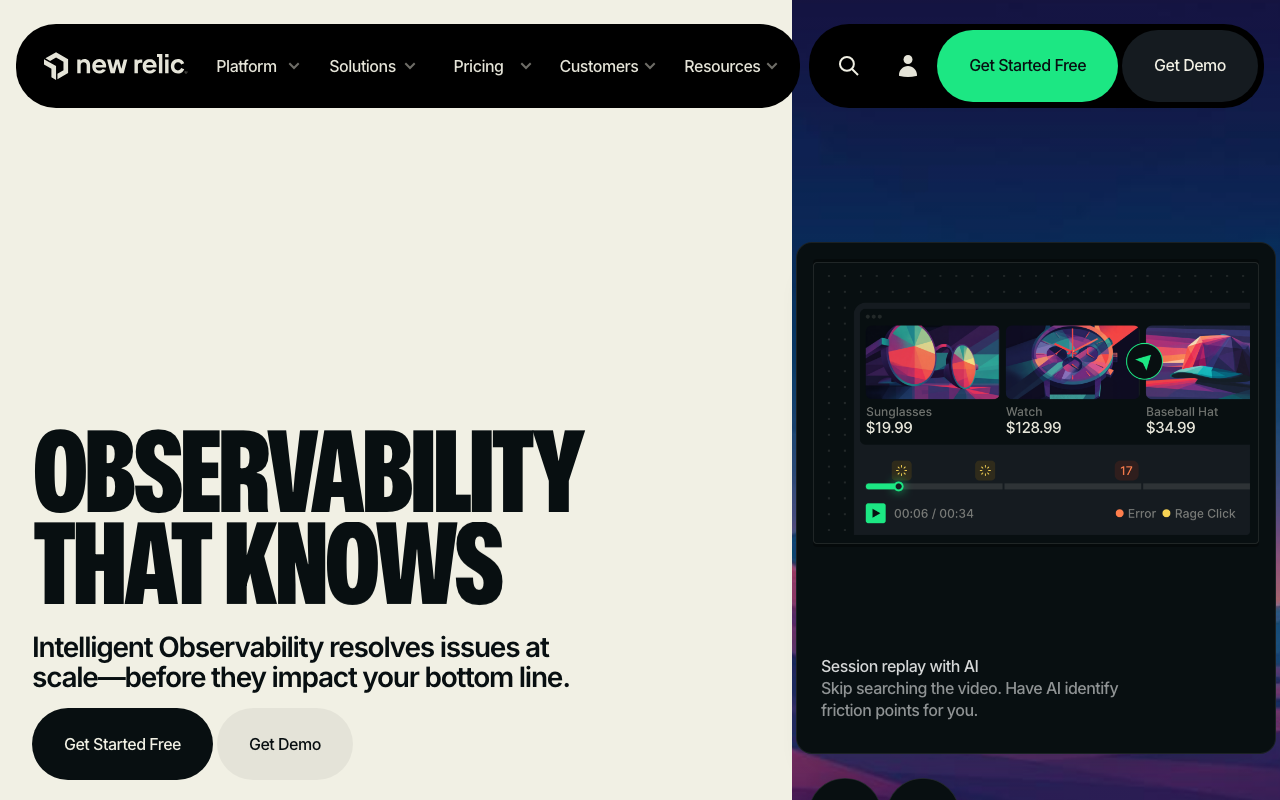
New Relic is a consolidation company. Instead of a catalog of priced products, it sells one platform with one telemetry database underneath, and the meter runs on data ingested. Traces, logs, metrics, events, and browser data all land in the same store and are queried with the same language. Collection is agent-per-language plus a guided install that detects common services, with OTLP accepted as a first-class input. The architectural consequence is that instrumenting broadly is cheap and granting access broadly is not, because full-platform access carries its own per-user meter.
Pros
- One datastore and one query language across every signal, so correlation does not need configuring
- Ingest-based billing is easy to model against a known telemetry volume, independent of host count
- Instrumenting an additional service adds only its data volume, which encourages broad coverage
- Long-standing, solid language agents for mainstream runtimes
Cons
- Per-seat pricing for full-platform access turns access policy into a budget decision, and rationed logins undermine the tool during incidents
- Ingest billing is a function of code behavior — a service switched to DEBUG logging moves the invoice without any deliberate change
- Depth in individual categories trails specialists; it is one good platform rather than best-in-class per signal
Best for: Mid-size teams that want consolidation and predictable data-side billing, and are small enough that per-user pricing isn’t the dominant term.
Pricing: Consumption pricing on data ingested across all signal types, plus a separate meter for billable full-platform users. The data side scales with log verbosity and telemetry volume; the people side scales with how many humans you let in.
Dynatrace
Dynatrace is an automation company. Its OneAgent installs once per host and then discovers processes, containers, services, and the calls between them without you writing instrumentation config. On top of that map sits Davis, its causal analysis engine, designed to collapse a storm of correlated alerts into one root cause finding. Because collection is host-level and privileged, the agent sees what a per-language SDK cannot — but for the same reason it needs a platform and security conversation before it needs a technical one.
Pros
- Automatic discovery produces a service topology without a config file listing your services, often the first accurate architecture picture a brownfield team has had
- Davis root cause analysis genuinely cuts incident time-to-understanding rather than just grouping alerts
- One agent per host covers multiple runtimes, so coverage does not degrade as language choices diverge
- Strong fit for large estates where nobody holds the whole system in their head
Cons
- OneAgent runs privileged and injects into your processes, which is a hard blocker in locked-down or heavily regulated environments
- Host-hour billing sized by memory behaves badly against elastic Kubernetes nodes and memory-heavy JVM hosts
- The most procurement-shaped of the three: significant capability, significant commercial process
Best for: Large estates of long-lived hosts where understanding an under-documented system is the hardest part of the job, and you have the standing to install a privileged agent everywhere.
Pricing: Host-hour billing sized by host memory, with consumption units for capabilities beyond core monitoring, and separate meters for log and event ingest and session volume. Predictable for stable fleets; volatile for short-lived, autoscaled nodes.
How to choose
Start from the meter, not the feature list.
| Primary meter | Secondary meters that bite | Where it gets expensive | |
|---|---|---|---|
| Datadog | Per host, per product | Custom metrics by cardinality, indexed log events, APM spans, per-container surcharges | Adding modules and adding dimensions to metrics |
| New Relic | Data ingested | Billable full-platform users | Chatty debug logging, and org-wide access |
| Dynatrace | Host-hour by memory size, consumption units for other capabilities | Log and event ingest, session volume | Large-memory hosts and short-lived nodes |
Head to head, the split is clean. Datadog wins when your estate is mostly managed cloud services that no agent will ever run on, because the catalog covers them and nobody else’s does. Dynatrace wins when your estate is mostly your own processes on your own hosts, because that’s where automatic discovery has something to discover. New Relic wins the middle: you want one platform and one query surface, your data volume is knowable, and your headcount is small enough that seats aren’t the dominant term.
Pick none of them if your real problem is three engineers and a bill you can’t justify — APM tools for startups covers where free tiers stop being free.
Then run this in a week, not a quarter.
- Write down your host count, container count, monthly log GB, and monthly custom metric time series. If you can’t produce these numbers, that’s your first finding — get them before you talk to any vendor.
- Decide the access question up front. How many humans need to log in? If the answer is “everyone,” per-seat pricing is a first-order term and you should say so in every sales conversation.
- Pick one service that is genuinely hard to debug. Instrument it in all three trials. Do not use a hello-world app; the whole point is to see how each handles your actual mess.
- Simulate a real incident during the trial. Break something, page someone, and time how long each tool takes to get you to the root cause. This is the only benchmark that matters.
- Ask each vendor to model your bill at 3x current scale in writing, and specifically what happens when a metric gains a high-cardinality tag.
- Check the exit. Can you export dashboards and alerts as code? Is your instrumentation OpenTelemetry or vendor SDK? A migration you can describe is a negotiating position.
Needs first-hand data: During the trial incident simulation, record time-to-first-useful-signal and time-to-root-cause for each tool with the same engineer driving. Those two numbers justify or kill a price difference better than any feature list.
Frequently asked questions
Is Dynatrace’s automatic discovery actually better than Datadog’s?
For dependency mapping on hosts where OneAgent can install, yes — it infers service relationships without configuration, and that’s its core design goal. Datadog’s strength is different: a larger catalog of integrations for managed and third-party services where no agent will ever run. If your estate is mostly your own processes on your own hosts, Dynatrace’s automation wins. If it’s mostly managed cloud services, Datadog’s catalog wins.
Which one is cheapest?
None of them, reliably. It depends on your shape: many small hosts favors ingest pricing, few large hosts favors per-host pricing, a big engineering org disfavors per-seat pricing. Teams get burned by comparing quoted prices instead of comparing meters against their own growth curve.
Can I use OpenTelemetry with all three?
Yes, all three ingest OpenTelemetry data, though each has vendor agents that collect things OTel doesn’t cover as deeply. The practical approach is to instrument applications with OpenTelemetry and use vendor agents for infrastructure. That keeps the expensive part — your application instrumentation — portable.
What about self-hosting instead?
It’s a real option and a real cost transfer: you trade a vendor invoice for engineering time and on-call responsibility for your own observability stack. It makes sense when data volumes are large enough that vendor pricing dominates, and it doesn’t when your team is small. The self-hosted observability stacks guide covers what you’re signing up for.
Related reading
- Best APM tools for developers — the full landscape, and where each category fits.
- Datadog alternatives — replacements segmented by which part of the bill drove you out.
- New Relic alternatives — what you lose when you leave an all-in-one platform.
- Grafana Cloud vs Datadog — the same decision framed as open standards versus managed polish.
- Best APM tools for enterprise — procurement, RBAC, and compliance requirements.
- Best OpenTelemetry-native observability platforms — how to keep the vendor decision reversible.