The New Relic complaint I hear most often isn’t about the product. It’s about the forecast. Consumption pricing on data ingested sounds fair — you pay for what you send — right up until a service starts logging at DEBUG in production and the month’s bill has a shape nobody predicted. Add a per-user component on top, and the two levers that move your invoice are the two things engineering managers have the least direct control over: how chatty the code is, and how many people need to log in.
That second lever is the one that quietly corrupts the tool. When full-platform access is priced per seat, teams start rationing logins. The support engineer doesn’t get one. The backend developer who only occasionally debugs production doesn’t get one. And then during an incident, the three people who could actually help are watching over one person’s shoulder. An observability tool that not everyone can open is doing half its job.
So teams start looking. The right shortlist depends entirely on which of those two things is driving you — and on whether you’re willing to trade one integrated platform for a set of separate tools, which is what most of these moves actually mean.
Key takeaways
- Ingest-based billing and per-user billing are different problems; fix the one that’s actually moving your invoice.
- Leaving an all-in-one platform usually means replacing one bill with three tools and three onboarding curves.
- Migrate instrumentation to OpenTelemetry before you migrate vendors — it’s the reversible step and it de-risks everything after.
- Historical data does not come with you. Plan a parallel-run window or accept a gap in the record.
Sort your motivation first
There are three distinct reasons teams leave, and each points at a different replacement.
You can’t forecast the bill. Consumption pricing means the invoice is a function of code behavior. A retry storm, a verbose third-party SDK, or a new service with default log levels all move it. If this is you, look for pricing that’s predictable in the dimension you can control, or for a stack where you own the storage and the ceiling is hardware you already bought.
Per-user pricing is the dominant term. If your data volume is modest but your engineering org is large, the seat count is your bill. The fix is a tool that doesn’t price observation per human — most open source and self-hosted options don’t, and several managed vendors price only on data.
You want something you can self-host. Regulatory constraints, data residency, air-gapped environments, or plain distrust of vendor renewals. This one isn’t about price at all, and the shortlist is short.
Be specific about which you are. Moving from one consumption-priced SaaS to another consumption-priced SaaS because the current one feels expensive is how teams end up doing this migration twice.
Needs first-hand data: Split your last twelve invoices into ingest cost and user cost. If seats are under a quarter of the total, per-user pricing is not your problem and you should stop optimizing for it.
What you lose leaving an all-in-one platform
One bill becomes three tools. This is the part nobody budgets for, and it’s the reason a lot of these migrations stall halfway.
An integrated platform gives you a single query surface over every signal, one alerting system, one authentication and permissions model, one vendor to call at 2am, and one place where an engineer’s muscle memory lives. When you replace it with a metrics backend, a logs backend, and a tracing backend — even three good ones — you’ve taken on the job of correlating them.
Correlation is the specific thing that degrades. In an integrated platform, jumping from a slow trace to the logs of that request is a click because the trace ID is already threaded through. In an assembled stack it works, but only if someone configured the trace-ID linking, made sure the log pipeline preserves the field, and set up the data source links in the dashboard. That’s a real project, and if it’s not done, on-call engineers end up copy-pasting IDs between browser tabs during an incident.
You also lose defaults. All-in-one platforms ship opinionated dashboards and alert conditions. Assembled stacks ship primitives. Both end up in the same place eventually; only one of them gets there in week one.
Count the tax honestly: more onboarding, more vendor relationships, more integration surface, more things that can be misconfigured. Sometimes it’s clearly worth it. It’s never free.
Migration mechanics
The order of operations matters more than the destination.
Instrument with OpenTelemetry first, while still on New Relic. New Relic ingests OTLP, so you can replace vendor agents with OpenTelemetry SDKs and verify traces still look correct before changing anything else. This is the single highest-leverage step because it’s reversible and it converts the vendor decision from a code change into a collector config change. The OpenTelemetry-native platforms guide covers which backends handle OTLP as a first-class citizen rather than a translation layer.
Then dual-ship. Point the collector at both backends and run in parallel for at least one full billing cycle. This is where you find out that a signal you assumed was there isn’t.
Agent removal is not just uninstalling a package. Language agents get wired in through auto-instrumentation hooks, NEW_RELIC_* environment variables, config files baked into container images, and sometimes an APM-specific startup flag in a Dockerfile or systemd unit. Grep for the vendor name across your infrastructure repos, not just your application repos, or you’ll find a straggler months later still shipping data and still billing.
Dashboards get rebuilt, not converted. Queries written in a vendor query language don’t translate mechanically to PromQL or ClickHouse SQL. The pragmatic approach is to not port everything: audit which dashboards were opened in the last 90 days, rebuild those, and let the rest die. Most teams find the majority are dead.
Alert rules need translating, and the semantics differ. Threshold, duration, and evaluation windows usually map. What doesn’t map cleanly is no-data behavior, flapping suppression, and grouping. Translate the rule, then deliberately test it by breaking something, because a silently non-firing alert is worse than no alert.
Historical data does not come with you. There is no export that reconstructs your telemetry history in a new tool’s storage. Your options are running both until the old retention window rolls off, or exporting a narrow slice you genuinely need for capacity planning and accepting the gap.
Needs first-hand data: Before cutover, list every dashboard opened in the last 90 days and every alert that fired in the last 90 days. Those two lists are the real migration scope, and they are usually a fraction of what exists.
New Relic
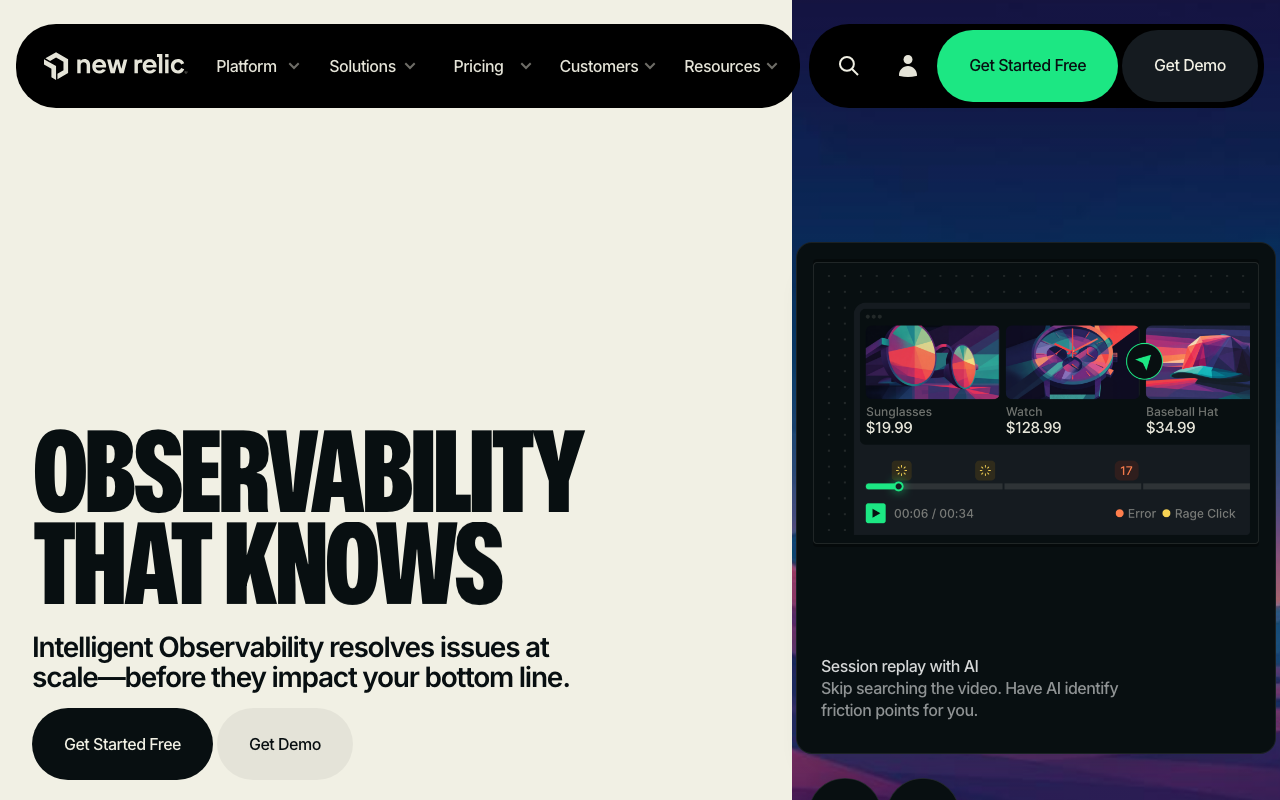
The incumbent, stated plainly so the comparison is honest. New Relic is a consolidation platform: one telemetry database underneath every signal, one query language over it, and agents per language plus OTLP ingest feeding it. Traces, logs, metrics, events, and browser data all land in the same store, which is why correlation across signals needs no configuration. The meter runs on data ingested, with a second meter on billable full-platform users — and it’s that second meter, not the product, that generates most of the searches that lead here.
Pros
- One datastore and one query language across all signals, so cross-signal correlation is implicit rather than configured
- Instrumenting an additional service costs only its data volume, which encourages broad coverage
- Mature language agents for mainstream runtimes, with a long track record
- Accepts OpenTelemetry, so you can migrate instrumentation without leaving the platform
Cons
- Per-seat pricing for full-platform access turns access policy into a budget decision, and rationed logins actively degrade incident response
- Ingest billing is a function of code behavior, so a log-level change moves the invoice without any deliberate decision
- Depth in individual categories trails specialists; it’s one good platform rather than best-in-class per signal
Best for: Teams that value one consolidated query surface over per-category depth, with modest telemetry volume and a headcount small enough that seats aren’t the dominant term.
Pricing: Consumption pricing on data ingested across all signal types, plus a separate meter for billable full-platform users. The data side scales with log verbosity; the people side scales with how many humans you let in.
SigNoz
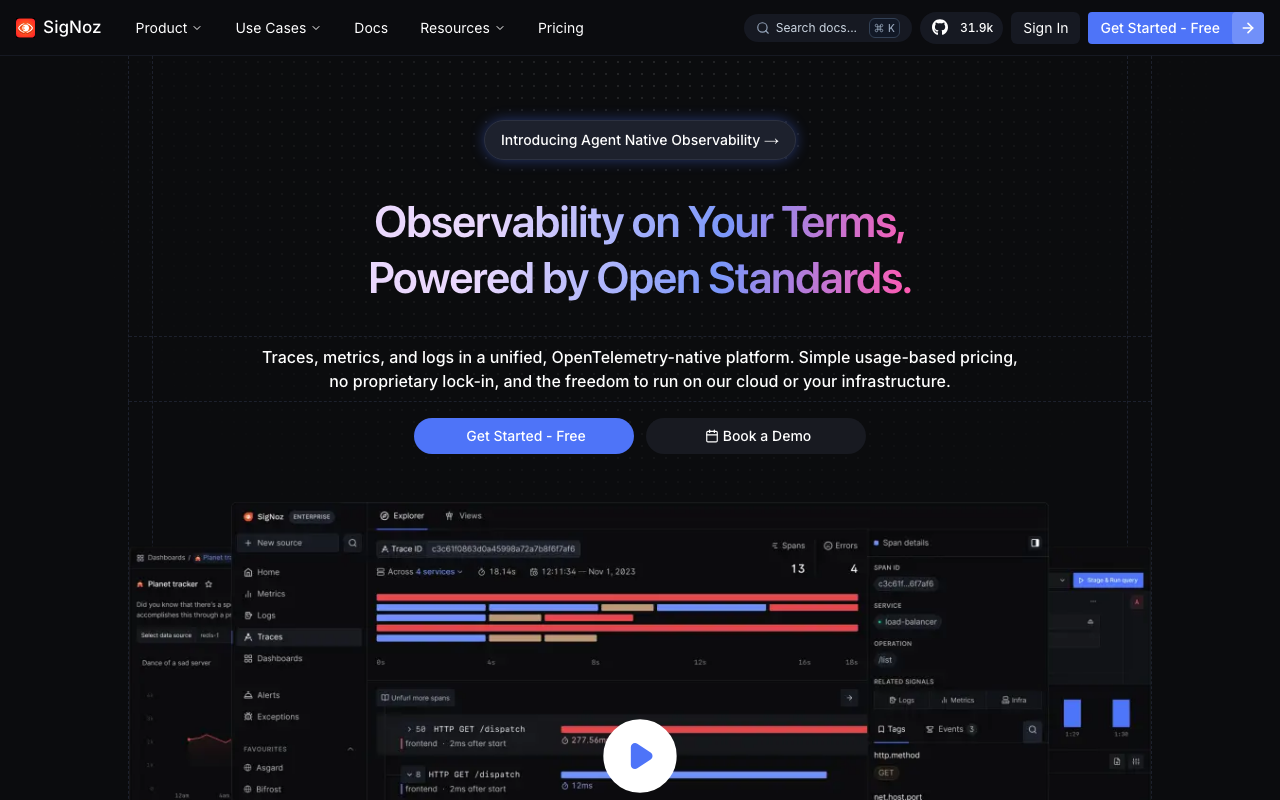
SigNoz is the most direct answer for a team that wants one tool covering traces, metrics, and logs without seat pricing. It’s OpenTelemetry-native, open source, backed by ClickHouse, and available as either managed cloud or self-hosted. If your reason for leaving is “the platform is fine but the model isn’t,” this is the closest philosophical replacement: still one place for everything, different economics, and a self-host path that puts the ceiling on hardware rather than headcount.
Pros
- One platform for all three signals, so you don’t split one bill into three tools and three correlation problems
- No per-user meter, so everyone who might help during an incident can actually log in
- OpenTelemetry-native by design, keeping your instrumentation portable after the move
- Same software managed or self-hosted, so the deployment decision stays reversible
Cons
- Narrower breadth than a mature commercial platform — synthetics, mobile, and security signals are thin or absent
- Self-hosting means owning ClickHouse capacity, retention, and upgrades
- Smaller integration library, so managed cloud services take exporter work
Best for: Teams leaving over seat pricing or forecast volatility who want to keep the one-platform shape rather than assemble a stack.
Pricing: Usage-based on ingested telemetry volume and retention for managed cloud, with no per-seat component; self-hosting converts the invoice into infrastructure and operations time.
Grafana Cloud
Grafana Cloud replaces the all-in-one with an assembled stack — Mimir for metrics, Loki for logs, Tempo for traces, Grafana for dashboards. It costs more engineering time to set up and gives you portability in return, since every component is open source and self-hostable with the same queries. Worth reading the Grafana Cloud versus Datadog framing, because the lock-in argument there applies equally here: what you build is PromQL over Prometheus data, and it runs unchanged on your own hardware.
Pros
- Every component is open source and self-hostable, so the next migration is a data-transfer project rather than a rebuild
- PromQL and LogQL are transferable skills that engineers carry between employers
- Loki’s index-light log design behaves very differently at volume from indexed-event pricing
- Native fit for Prometheus-emitting Kubernetes infrastructure
Cons
- Assembled, not integrated: trace-to-log correlation is configuration work you now own
- Community exporters and dashboards vary in quality and staleness, and maintaining them is ongoing
- Needs a named platform owner with time, not just someone theoretically capable
Best for: Prometheus-native teams with platform engineering capacity who want portability enough to spend engineering hours on it.
Pricing: Usage-based on metric series, log and trace ingest, and retention tier. The real cost line is off-invoice engineering time to assemble and maintain the stack.
Uptrace
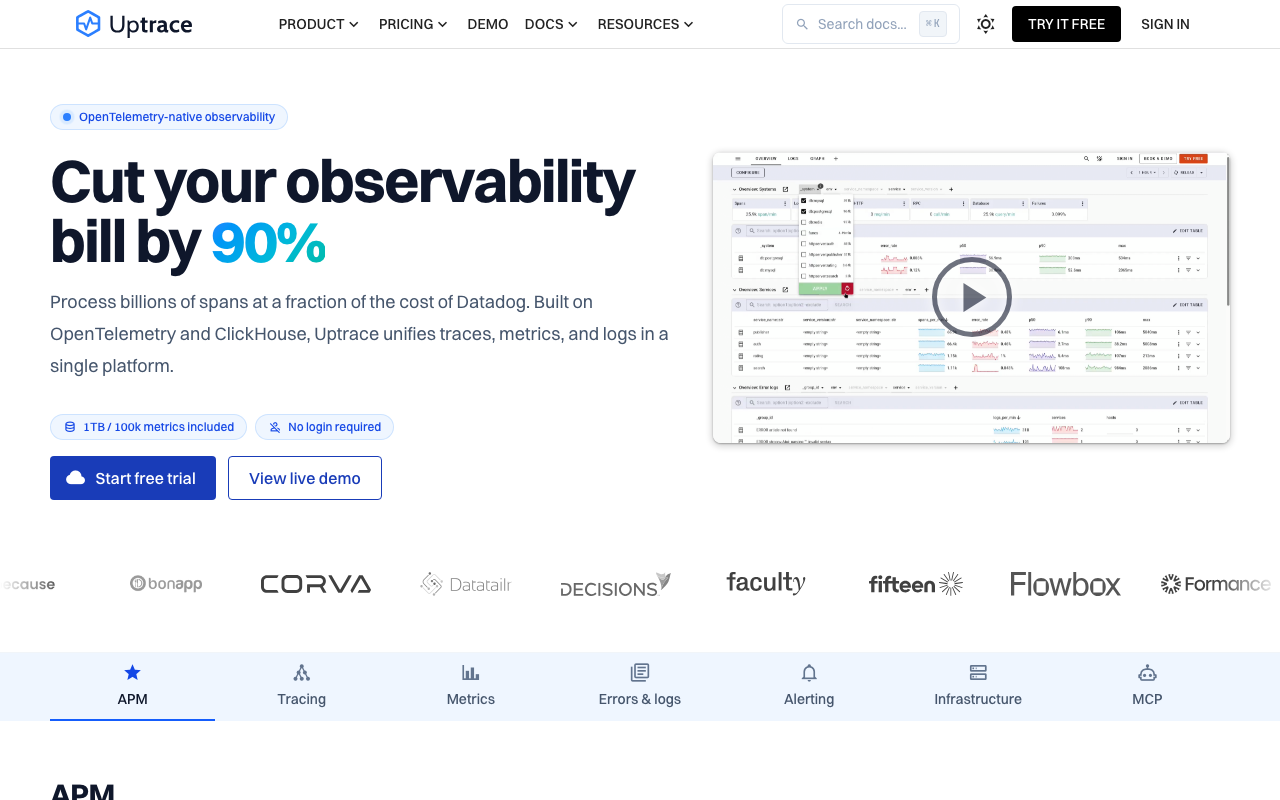
Uptrace targets the “OpenTelemetry-native, run it yourself or let us run it, don’t charge per human” segment. It covers traces, metrics, and logs and is deliberately lighter to operate than a full Grafana stack, and correspondingly less broad. For a team of ten to fifty engineers whose main complaint is seat pricing, it’s a serious candidate precisely because the operational commitment is small.
Pros
- OTLP-first ingest, so migrating instrumentation is a collector config change
- Far lighter to self-host than Mimir plus Loki plus Tempo
- No per-user pricing, which is the whole point if seats dominate your bill
Cons
- Smaller feature surface and ecosystem than established platforms
- Few curated integrations, so managed-service coverage is exporter work
- Thin on governance, RBAC depth, and the things large organizations ask about in procurement
Best for: Ten-to-fifty-engineer teams whose bill is dominated by seats and who want a self-hostable backend without adopting a full stack.
Pricing: Usage-based on ingested spans, metrics, and logs for the managed service, with no seat meter; self-hosting shifts cost to infrastructure.
OpenObserve
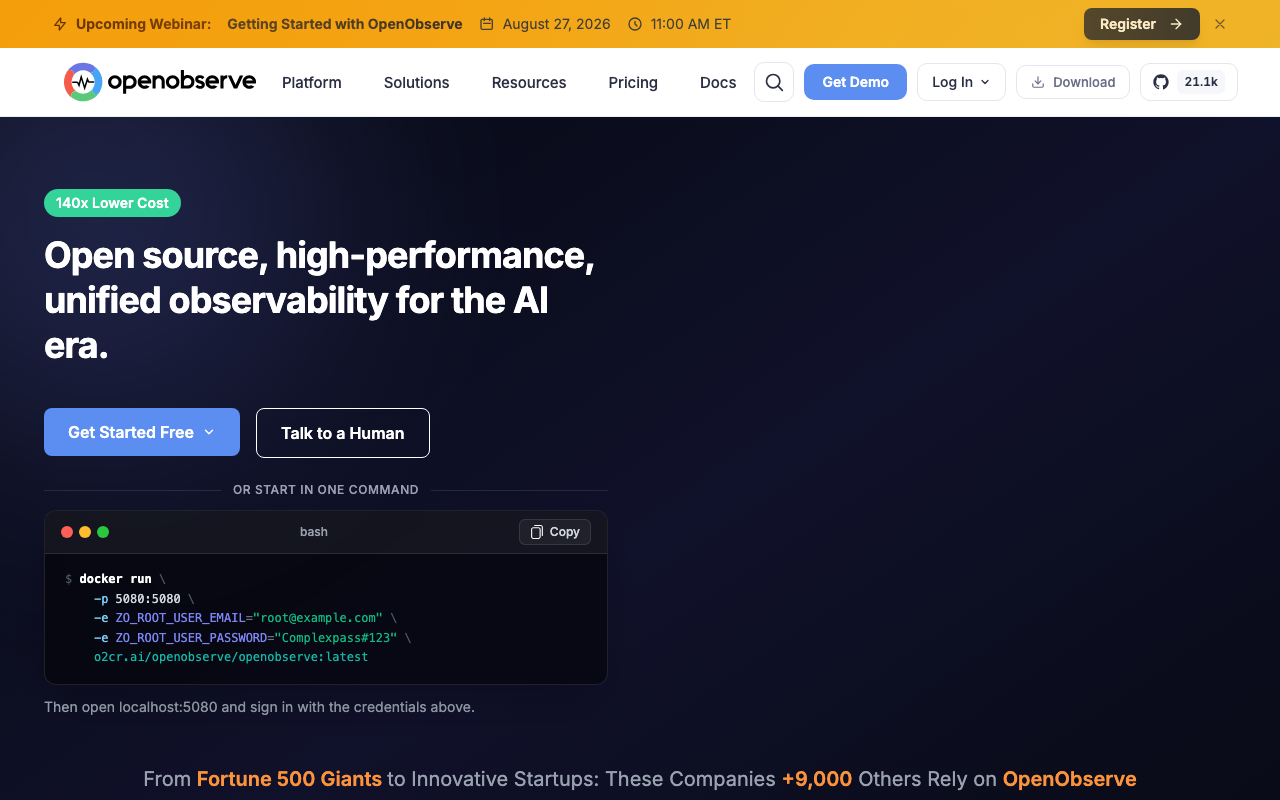
OpenObserve sits in the same segment — OpenTelemetry-native, self-hostable or managed, priced on data rather than people. Its design emphasis is on cheap storage for high-volume logs and telemetry, which matters if the thing that broke your New Relic forecast was log verbosity rather than trace volume.
Pros
- Storage design aimed at high-volume log retention without indexed-event economics
- Self-hostable, so data residency and cost ceiling are both under your control
- OpenTelemetry ingest keeps the instrumentation decision reversible
- Light operational footprint relative to a full assembled stack
Cons
- Younger project with a smaller ecosystem and fewer battle-tested large deployments
- APM depth trails dedicated tracing platforms
- Fewer prebuilt dashboards and integrations, so early setup is hands-on
Best for: Log-heavy teams that want retention they control and a meter that ignores headcount entirely.
Pricing: Usage-based on ingested volume and retention for managed; self-hosted cost is object storage plus compute you provision.
Elastic
Elastic is the option when logs dominate your volume and you already have Elasticsearch expertise in-house. You get APM, logs, and search in one platform you can run yourself. You also get Elasticsearch’s operational profile, which is not a small commitment — cluster sizing, shard management, and upgrades become someone’s job, and that person’s time is the real price.
Pros
- Fully self-hostable, satisfying data residency, air-gapped, and regulatory constraints
- Logs, APM, and search in one query surface many teams already know
- Strong fit when log volume is the dominant signal and the expertise already exists internally
Cons
- Elasticsearch operations are an ongoing job, not a one-time setup
- Heavier to run than purpose-built columnar backends at comparable volumes
- APM tracing ergonomics trail dedicated APM vendors
Best for: Regulated or self-host-motivated teams with existing Elasticsearch expertise and log volume large enough to justify owning the cluster.
Pricing: Subscription tiers for managed deployments based on size and retention; self-managed shifts cost entirely to infrastructure and the headcount running it.
Datadog

Datadog belongs on the list for honesty’s sake, but not for cost reasons. Teams move from New Relic to Datadog for integration breadth and product depth, not to save money — the per-host, per-product model can easily land higher than what you’re leaving. It’s the right move when your complaint is capability rather than price: a wider first-party catalog, deeper adjacent products, and correlation across all of them without configuration.
Pros
- The largest curated first-party integration catalog, with dashboards and default monitors already opinionated
- Zero-configuration navigation between infrastructure, traces, and logs
- Deep adjacent products — synthetics, RUM, security, CI visibility — under one login
- Mature alerting with composite monitors and sensible no-data and flapping defaults
Cons
- Not a cost move: per-host, per-product billing frequently lands above consumption pricing
- Custom metric cardinality and log indexing need permanent active governance
- Proprietary throughout, so you’re trading one lock-in for a deeper one
Best for: Teams whose reason for leaving is capability and integration breadth, with budget and a named owner for cost governance.
Pricing: Per-host subscription charged separately per enabled product, with additional meters for custom metrics by unique series, indexed log events, and APM spans.
How to choose
Split the invoice first. The bigger line decides the category.
| What’s driving you out | What to look for | Where to start |
|---|---|---|
| Unforecastable ingest bills | A meter you can control, or storage you own outright | SigNoz, OpenObserve, Grafana Cloud |
| Per-user pricing dominates | Any tool that doesn’t price observation per human | SigNoz, Uptrace, OpenObserve |
| Must self-host | Open source backend you can run in your own environment | SigNoz, Grafana stack, Elastic |
| Capability gap, not price | Breadth, catalog depth, and adjacent products | Datadog |
Then work the order of operations.
- Split the invoice into ingest and seats. Optimize the bigger one.
- If seats dominate, shortlist tools that don’t price per human. If ingest dominates, shortlist by storage economics and check whether self-hosting changes the math.
- Move instrumentation to OpenTelemetry now, regardless of destination. It’s useful even if you stay.
- Inventory live dashboards and alerts that actually fired. That’s your scope, not the full asset count.
- Dual-ship one real service for a full billing cycle and resolve one real incident on the new tool before committing.
- Write down what you’re giving up. If you can’t name the losses, you haven’t looked hard enough.
Frequently asked questions
Is there a like-for-like replacement for New Relic?
SigNoz is the closest in shape — one platform, all three signals, one query surface — with different economics and a self-host option. It doesn’t match the breadth of a mature commercial platform across synthetics, mobile, and security, so check that your must-haves are covered before assuming parity.
Can I keep my instrumentation when I move?
Only if it’s OpenTelemetry. Vendor-agent instrumentation is tied to that vendor’s SDK and does not port. Migrating to OpenTelemetry while still on your current platform is the step that makes everything after it cheap.
Will I actually save money?
If seats are a large share of your bill and you move to something that doesn’t price per user, yes, and the saving is immediate. If ingest dominates, the answer depends on volume and whether you self-host — and self-hosting trades invoice for engineering time, which is not always a saving. Model both.
How long does the migration take?
It’s governed by the dashboard and alert inventory, not the data pipeline. Repointing telemetry is days. Rebuilding what people actually use, translating alerts, and building organizational trust in the new tool is the long pole. Plan for a parallel run measured in months, not weeks.
Related reading
- Best APM tools for developers — the full landscape and where each category fits.
- Datadog vs New Relic vs Dynatrace — how the three big platforms differ on pricing model.
- Datadog alternatives — the same exercise for teams leaving per-host, per-product billing.
- Best OpenTelemetry-native observability platforms — how to make the backend decision reversible.
- Best self-hosted observability stacks — what running it yourself actually costs.
- Best open source APM and observability tools — what the open ecosystem covers and where it stops.