The pitch for open source APM is that the licence is free. That is true and mostly irrelevant. The line item that matters never appears on any invoice: the fraction of an engineer’s month that goes into keeping the thing alive. Cluster upgrades, disk pressure at 2am, a schema migration that locks ingestion, a retention policy nobody tuned until the volume filled up.
At LoginRadius we self-hosted a good chunk of our monitoring because the vendor bill for 400 million end users’ worth of telemetry was absurd, and we had the headcount to absorb the operational load. That second condition is the one teams skip when they do the maths.
So this compares the genuinely open projects on the thing that determines production behaviour: the storage engine underneath. Query language, dashboard polish and onboarding are all downstream of that choice. It is also explicit about open core — which projects hand you the full product, and which hand you most of it with SSO, RBAC and long retention parked behind an enterprise agreement.
Key takeaways
- The real cost of open source observability is engineer-hours per month, not the licence. Budget it explicitly before you commit.
- Storage architecture predicts failure mode. Columnar stores handle high-cardinality traces; TSDBs handle metrics; conflating the two is how stacks fall over.
- “Open source” and “open core” are different products. Check where SSO, RBAC and long-term retention sit before you standardise on one.
- The single-binary projects trade some scale ceiling for a dramatic reduction in assembly work. For most teams that is the right trade.
The licence is free; the operations are not
Open source shifts cost from a vendor invoice to your payroll. That is a real saving when your telemetry volume is large and your team is big enough that one more system does not break anyone. It is a bad trade when you are eight engineers and every hour spent on ClickHouse compaction settings is an hour not spent on the product.
The work is not evenly distributed either. It arrives in bursts: a major version upgrade, a disk that fills, a cardinality explosion from a bad label, an incident where the monitoring system is the thing that is down. The steady state is quiet, which is exactly what lulls teams into under-budgeting it.
Before you self-host, write down who owns the stack when it breaks and what happens if that person is on holiday. If you cannot answer that, you want a hosted tier — and several of the projects below sell one. The trade-offs are covered in more depth in self-hosted observability stacks.
Needs first-hand data: Track engineer-hours spent on stack maintenance for one quarter — upgrades, incident response on the monitoring stack itself, capacity work — and divide by the team’s fully loaded hourly cost. Compare against a hosted quote for the same ingest volume.
Open core: read the boundary before you build
Almost every project here has a commercial arm, and the features that get held back are predictable: single sign-on, fine-grained RBAC, long-term retention, clustering, and support with a response time attached.
That is not a criticism — those companies need revenue and the pattern is honest when stated plainly. The failure mode is a team standardising on the community edition, getting eighteen months in, then hitting a SOC 2 requirement for SSO and discovering it is a commercial conversation. Check the boundary at evaluation time, not at audit time.
The same applies to relicensing. Several infrastructure projects have changed licences under commercial pressure. If your business depends on the current terms, know who controls them.
SigNoz
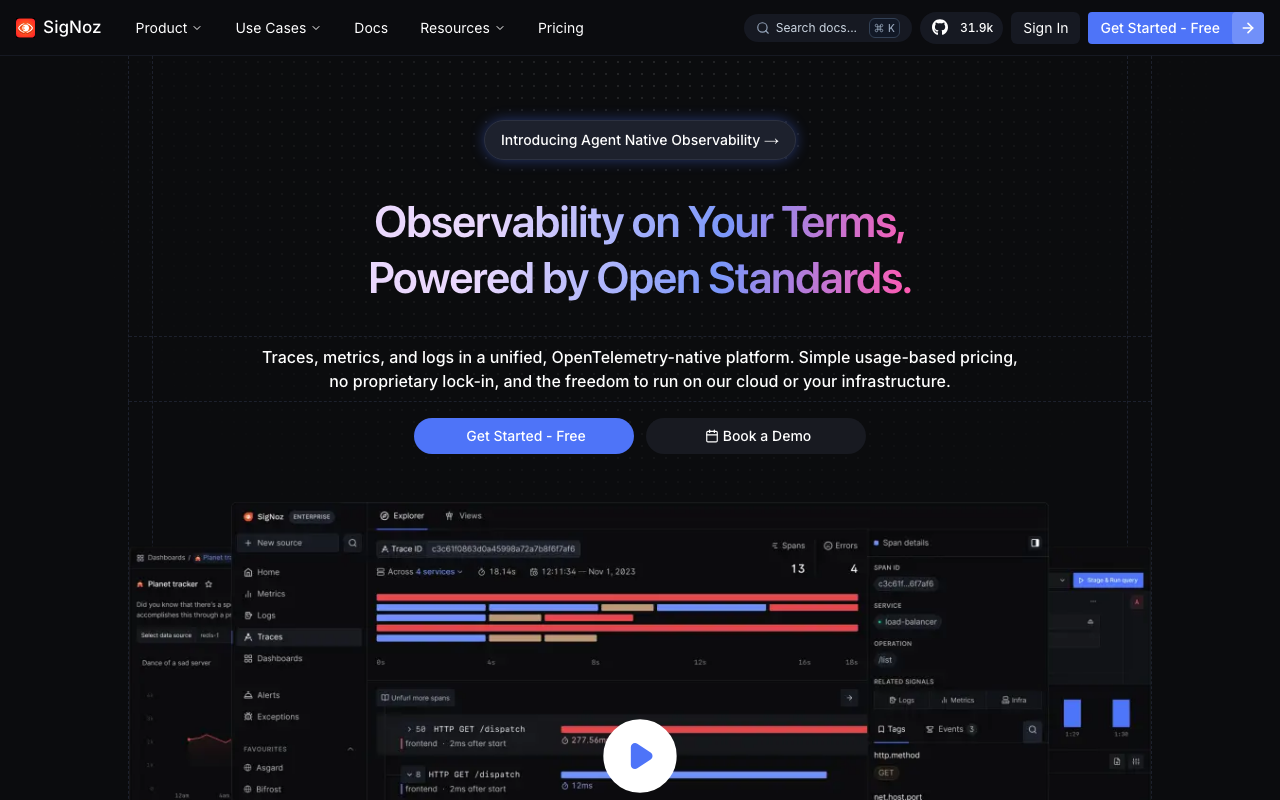
SigNoz is the closest thing in the open ecosystem to a drop-in replacement for a commercial APM. It stores metrics, traces and logs in ClickHouse and ships a unified UI over all three, so you can jump from a slow endpoint to the trace to the logs emitted inside that trace without changing tools. ClickHouse is the reason it works: columnar storage compresses trace and log data hard and answers wide analytical queries fast, which is exactly the shape of “show me p99 by customer_id for this endpoint”. That is a genuinely different engine from a Prometheus-style TSDB, and it is why SigNoz handles high-cardinality attributes that would make a metrics store fall over.
Pros
- One product covering metrics, traces and logs, with correlation between them for free because they share a store
- ClickHouse handles high-cardinality attributes that break TSDB-based metrics stacks
- OpenTelemetry-native ingestion, so instrumentation stays portable if you later leave
- The community edition is substantial rather than a crippled demo
Cons
- ClickHouse is a real database with real operational demands — sizing, replication, merges and disk layout all become your problem at scale
- Open core: SSO and some access-control features sit in the commercial tiers, which matters if compliance requires them
- Breadth of integrations and prebuilt dashboards is far behind the large commercial vendors
Best for: Teams with someone willing to own a ClickHouse deployment who want a single unified product instead of assembling four components.
Pricing: Free open source licence for the community edition; a commercial cloud and enterprise tier gates SSO, some access control and support response times. Your real cost is engineer hours operating ClickHouse plus the compute and disk underneath it.
Uptrace
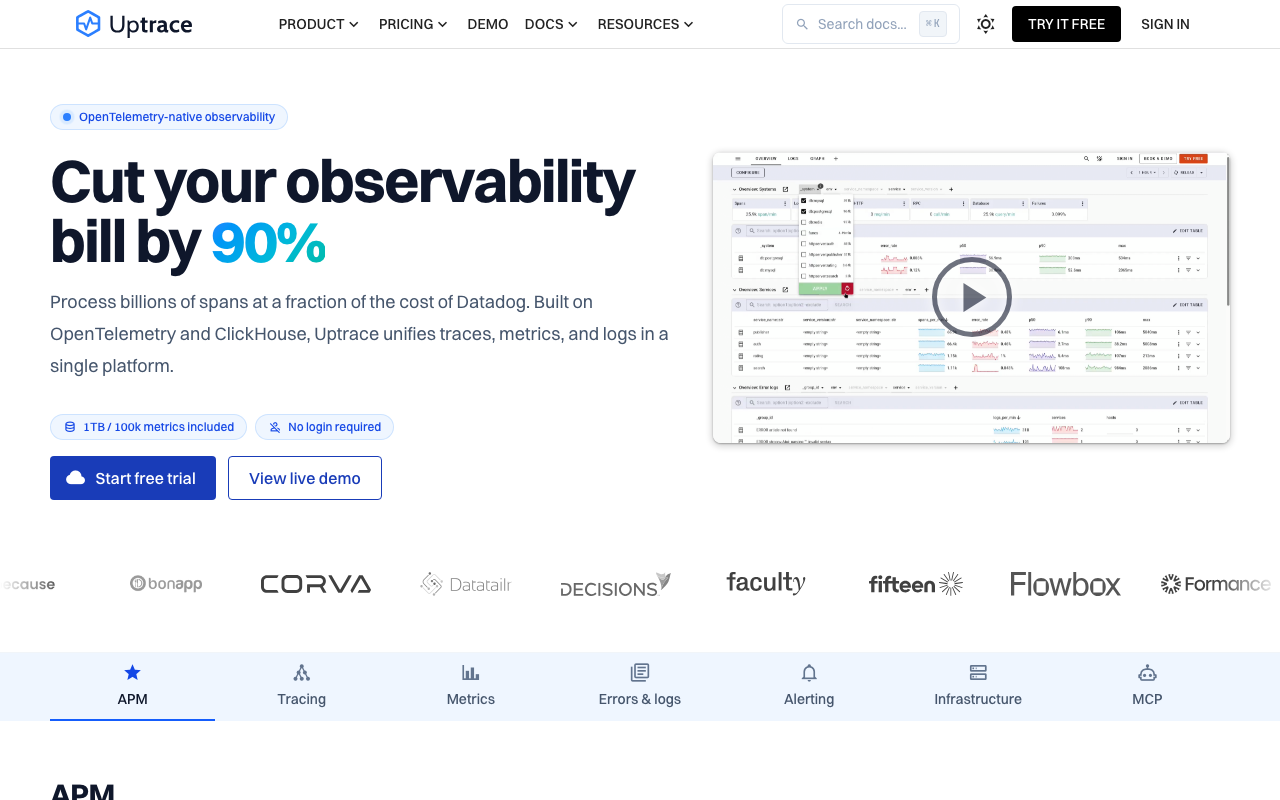
Uptrace makes the same architectural call as SigNoz — ClickHouse, OpenTelemetry-native, one UI over traces, metrics and logs — with a smaller and simpler product around it. That smallness is a feature if you want something you can read end to end and reason about. It is a limitation if you expected the breadth of dashboards, alert integrations and pre-built views a larger project accumulates.
Pros
- Small enough to understand completely, which shortens debugging when the stack itself misbehaves
- Same ClickHouse and OTLP architecture as SigNoz, so the portability story is identical
- Lower assembly effort than a component-based stack for all three signals
Cons
- Narrower feature surface: fewer prebuilt dashboards, fewer alert integrations
- Smaller community, so fewer production war stories when you hit an edge case
- Still carries the ClickHouse operational burden despite the simpler product around it
Best for: Small platform teams who value a comprehensible system over feature count and are already committed to OpenTelemetry instrumentation.
Pricing: Open source licence with a hosted commercial option; some capabilities sit on the paid side. Self-hosting cost is dominated by ClickHouse infrastructure and the engineer time to maintain it.
OpenObserve
OpenObserve attacks the cost problem from a different angle. It is built to keep data in object storage — S3 and equivalents — rather than on attached disks, which changes the economics of long retention substantially. Storing a year of logs on SSD is expensive. Storing a year of logs in an object bucket is not. The trade is latency: queries against cold object storage are slower, and patterns that scan wide time ranges feel it. For retention driven by compliance rather than debugging, that trade is almost always correct.
Pros
- Object storage as the primary tier makes long retention dramatically cheaper than disk-based stores
- Consolidates logs, metrics and traces into one deployable product
- Storage scales independently of compute, so a retention increase is not a node resize
Cons
- Query latency on cold data is worse than local-disk stacks, which hurts interactive debugging
- Object storage introduces its own failure modes — throttling, egress charges, eventual consistency edges
- Younger project with a thinner ecosystem than the Prometheus or Grafana worlds
Best for: Teams whose log and trace bill is dominated by retention requirements they cannot negotiate away, and who query old data rarely.
Pricing: Free open source licence plus a hosted commercial tier. Self-hosted cost is object storage capacity and request charges plus the engineer time to run the query layer — the retention economics are the point, so model bucket costs rather than disk costs.
Needs first-hand data: Run the same query — a 30-day full-text search over your log volume — against a local-disk stack and an object-storage-backed one. Record wall-clock query time and the monthly storage cost for both.
HyperDX
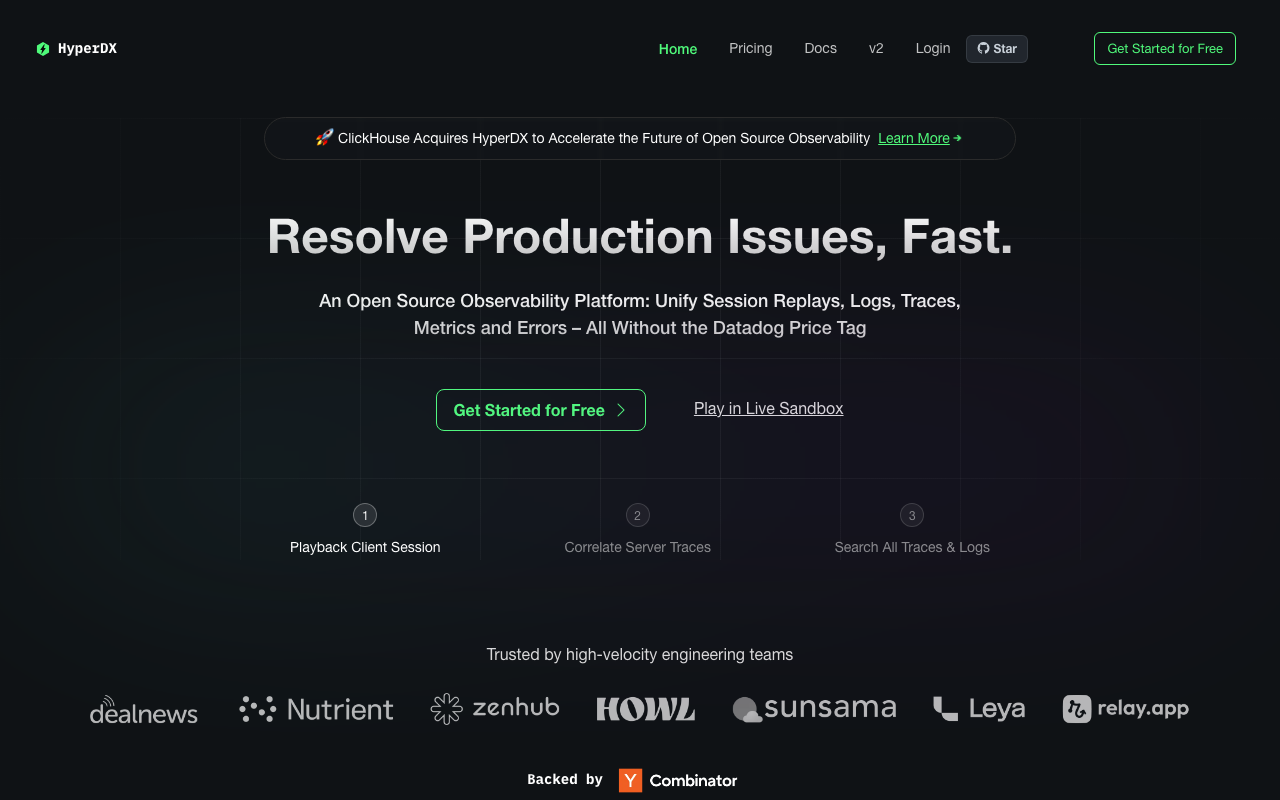
HyperDX sits on ClickHouse too, but its distinguishing move is session replay and log search stitched into the same view as traces. If you already operate ClickHouse for analytics, pointing an observability UI at it is a much cheaper proposition than standing up a new storage tier. The caveat is maturity relative to the older projects: it is a smaller ecosystem and a smaller body of production war stories, which matters when you hit an edge case at 3am and need someone to have hit it first.
Pros
- Reuses an existing ClickHouse deployment rather than demanding a new storage tier
- Session replay alongside traces and logs in one view, which is unusual in the open ecosystem
- OTLP ingestion keeps instrumentation portable
Cons
- Youngest of the ClickHouse-backed projects, with the thinnest body of production experience
- Feature depth in alerting and dashboards trails the larger projects
- Session replay adds storage volume and privacy obligations that logs alone do not
Best for: Teams already operating ClickHouse who want front-end session context sitting next to backend traces without buying a second product.
Pricing: Open source licence with a commercial hosted tier. Running it yourself costs ClickHouse capacity — meaningfully more once session replay data lands in it — plus the engineer time to keep both the UI and the database healthy.
Prometheus
Prometheus is not an APM and pretending otherwise causes most of the disappointment around it. It is a metrics database with a pull model, a local TSDB and PromQL, and it is the de facto standard for infrastructure and application metrics. What it does well: numeric time series with bounded label sets, alerting rules, and a query language that is genuinely expressive once you stop fighting it. What it does badly: anything high-cardinality. Put a user ID or a request ID in a label and you will learn about series churn the hard way.
Pros
- The default metrics store, with an enormous exporter ecosystem for anything you might run
- PromQL is expressive and portable across several compatible backends
- Pull model plus local storage makes a single instance genuinely simple to operate
- Alerting rules live next to the data, in version-controllable config
Cons
- No traces, no logs, and no native long-term storage — those are separate systems by design
- Cardinality is an unguarded failure mode: a code change adding an unbounded label can take the instance down
- A single node has a hard ceiling; going past it means remote write and a second system
Best for: Any team that needs infrastructure and application metrics with bounded label sets, as the metrics leg of a larger stack rather than a complete product.
Pricing: Fully open source under a permissive licence with no enterprise edition and no gated features — genuinely open rather than open core. Cost is the node it runs on plus the engineer time to manage retention, cardinality and upgrades.
VictoriaMetrics
VictoriaMetrics is the usual answer to Prometheus’ two structural limits: memory pressure at high series counts and the absence of a long-term storage story. It speaks PromQL, ingests Prometheus data via remote write, and uses a storage engine designed for better compression and lower memory pressure. Treat it as the drop-in you reach for when a single Prometheus stops fitting in memory or when you need retention measured in quarters rather than weeks.
Pros
- Drop-in for Prometheus remote write and PromQL, so dashboards and alerts port unchanged
- Materially lower memory footprint and better compression at high series counts
- Far less operational surface than Thanos or Cortex for the same long-retention outcome
- Single-node build covers a surprisingly large fraction of teams
Cons
- Metrics only — no traces or logs, so it is one leg of a stack rather than a product
- The clustered version and some enterprise features sit behind a commercial licence
- PromQL compatibility is very close but not identical, so exotic queries need verification
Best for: Metrics-heavy teams who have outgrown a single Prometheus and need long retention without adopting a distributed storage project.
Pricing: Open source single-node build under a free licence; clustering and some enterprise capabilities require a commercial agreement. Self-hosted cost is storage and memory plus the engineer time to run it — considerably less per month than the alternatives it replaces.
Jaeger
Jaeger is the CNCF distributed tracing project. It ingests spans, stores them in a pluggable backend, and gives you trace search and a service dependency graph. It is deliberately narrow: no metrics store, no log search, no alerting engine. Fine if you already have Prometheus and a log system and need the third leg; not fine if you expected a product. The storage backend choice — Cassandra, Elasticsearch or OpenSearch — is where the operational weight lands, and it is a bigger decision than picking Jaeger itself.
Pros
- Mature CNCF project with a long production track record and broad OTLP support
- Rich trace search as a first-class workflow, not just trace-ID lookup
- Pluggable storage lets you reuse a database your team already operates
Cons
- Traces only — you still need separate metrics and log systems and must correlate them yourself
- The real operational cost is the backing store: Cassandra or Elasticsearch is the system you actually end up running
- No alerting engine, so trace-derived alerts require another component
Best for: Teams who already run Prometheus and a log store, need proper trace search, and have existing Cassandra or Elasticsearch operational expertise.
Pricing: Fully open source with no commercial tier from the project itself. Cost is almost entirely the storage backend’s infrastructure and the engineer time to operate it, which dwarfs Jaeger’s own footprint.
Grafana
Grafana is where most self-hosted stacks put their front door: dashboards over Prometheus, Loki, Tempo, ClickHouse and dozens of other sources, plus alerting and on-call in the broader ecosystem. Be precise about what it is — a visualisation and alerting layer that queries other people’s databases. It solves the “one pane of glass” problem and none of the storage problems.
Pros
- Queries almost any backend, so it survives changes underneath it
- Dashboards and alert rules can be provisioned as code and kept in version control
- Unified alerting means one notification pipeline across metrics, logs and traces
- Enormous library of community dashboards for common exporters
Cons
- Stores nothing — every storage and retention problem remains entirely yours
- The licence position has shifted over the years and some capabilities are Enterprise-only
- Dashboard sprawl is the default outcome without deliberate governance
Best for: Any self-hosted stack that needs a single interface over several storage systems, especially where dashboards-as-code is the working model.
Pricing: Open core — the core is free to self-host, with specific features reserved for Enterprise and a hosted cloud tier alongside. Verify the specific features you depend on sit on the open side before standardising. Self-hosted cost is small compute plus the engineer time to manage dashboards and upgrades.
How to choose
Day one: write down your telemetry volume, your required retention, and who owns the stack operationally. If the owner column is empty, stop and evaluate hosted options instead — including the hosted tiers of these same projects.
Day two: pick based on what you already run. Already have Prometheus and Grafana and just need traces? Add Jaeger or Tempo. Have nothing and want one product? SigNoz or Uptrace. Drowning in log costs? OpenObserve. Already operating ClickHouse? HyperDX or SigNoz.
Day three to five: deploy the shortlist against a real service — not a demo app — with production-shaped traffic, watching resource consumption under load rather than at idle. Then check the open-core boundary against your compliance list: SSO, RBAC, audit logs, retention.
| Project | Storage engine | Strongest at | Falls over when |
|---|---|---|---|
| SigNoz | ClickHouse | Unified traces, logs, metrics | ClickHouse ops are unowned |
| Uptrace | ClickHouse | Small, readable OTel stack | You need broad feature coverage |
| OpenObserve | Object storage | Cheap long retention | Queries need low latency on cold data |
| HyperDX | ClickHouse | Sessions plus traces in one view | You need a long production track record |
| Prometheus | Local TSDB | Bounded-cardinality metrics | Labels carry unbounded values |
| VictoriaMetrics | Custom TSDB | High series counts, long retention | You wanted traces and logs too |
| Jaeger | Cassandra / Elasticsearch | Trace search and service graphs | You expected a full APM |
| Grafana | None — queries others | Unified dashboards and alerting | You thought it stored anything |
Frequently asked questions
Is open source APM actually cheaper than a vendor?
At high telemetry volume with an existing platform team, usually yes. At low volume with a small team, usually no, once you price the engineer time honestly. The crossover point depends on your ingest volume and your loaded engineering cost, so calculate it rather than assuming. Free APM tiers are often the better starting point for small teams.
What is the difference between open source and open core?
Open source means the product you can run is the whole product. Open core means a capable free edition with specific features — typically SSO, RBAC, clustering and long retention — reserved for paid tiers. Most observability projects with a company behind them are open core.
Can I replace Datadog with SigNoz?
For metrics, traces and logs on OpenTelemetry instrumentation, the functional gap is smaller than most people expect. The gaps are in breadth: integrations, security monitoring, RUM depth and the long tail of pre-built dashboards. See Datadog alternatives for the full comparison.
Which of these is most portable if I change my mind?
Anything built on OpenTelemetry instrumentation. The instrumentation is the expensive part of any migration; if your services emit OTLP, swapping the backend is a collector config change. That principle is the subject of OpenTelemetry-native platforms.
Related reading
- Best APM tools for developers — the full landscape, commercial and open.
- Best self-hosted observability stacks — assembling Prometheus, Loki, Tempo and Grafana end to end.
- Best OpenTelemetry-native observability platforms — native OTLP ingestion versus proprietary agents.
- Best free APM tools — where free tiers stop being free.
- Best APM for Kubernetes workloads — why the bill scales with pods, not traffic.
- Datadog alternatives — what teams actually move to and why.