Every observability vendor now says they support OpenTelemetry. Almost all of them are telling the truth in a technically-correct, commercially-convenient way. The phrase covers two completely different products, and the difference decides whether you can change vendors in an afternoon or in a quarter.
One kind accepts OTLP directly. You instrument with OpenTelemetry SDKs, point the collector at an endpoint, and the vendor stores what you sent. The other kind ships a proprietary agent that happens to read OpenTelemetry data, enriches it with vendor-specific attributes, and stores it in a proprietary shape. Both truthfully claim OTel support. Only one leaves you able to walk.
I have run a vendor migration on a platform with meaningful telemetry volume, and the instrumentation is always the expensive part. Rewriting dashboards is annoying. Rewriting instrumentation across dozens of services is a quarter of engineering time nobody budgeted. That asymmetry is the whole reason this distinction matters.
Key takeaways
- Native OTLP ingestion means your instrumentation is vendor-independent. A proprietary agent that reads OTel data does not give you that.
- The OpenTelemetry Collector is the portability layer. Route everything through it even with a single backend.
- Dual-export makes migrations low-risk: send to both vendors, compare, then cut over.
- OTel is still uneven — profiling is the newest signal, SDK maturity varies by language, and auto-instrumentation coverage is not uniform.
The test that separates native from wrapped
Ask a vendor one question: can I send data to your platform using only the upstream OpenTelemetry SDKs and the upstream Collector, with no vendor-supplied agent, library or SDK distribution, and get the full product?
If the answer requires a caveat — “you’ll want our distro for full feature parity”, “some features need our agent”, “our profiler is separate” — you are on the wrapped side. That is not automatically disqualifying. It means the migration cost is paid in instrumentation, and you should price that in from day one.
The second test: does the vendor store OpenTelemetry semantic conventions, or does it
remap them into a proprietary schema? If your db.system becomes
vendor.database.type on the way in, your dashboards and alerts are written against the
vendor’s vocabulary, not OTel’s. Queries do not port even if the data does.
The third test, and the honest one: does the vendor let you export your data out in OTLP? Almost nobody makes this easy. Assume historical data does not move and plan the migration as an overlap period rather than a cutover.
The Collector is the portability layer
The OpenTelemetry Collector is the single most valuable piece of this ecosystem and the one teams most often skip because it looks like an unnecessary hop.
Run it. Your services emit OTLP to the collector; the collector decides where it goes. That indirection is what makes the backend a configuration change instead of a deploy. Without it, the vendor endpoint is baked into every service and switching means touching every service.
It also gives you the operations you will eventually need anyway: tail-based sampling so you keep the slow and errored traces and drop the boring ones, attribute processors to redact PII before it leaves your network, batching to reduce egress, and resource detection so every span carries consistent service and environment attributes.
Deploy it two ways at once. An agent per node or sidecar handles local collection and host metadata; a gateway behind it handles sampling decisions that need a complete trace, plus centralised routing. That two-tier shape survives growth.
Dual-export is how you migrate without risk
The collector supports multiple exporters on the same pipeline. That single fact turns vendor migration from a leap into a controlled comparison.
Configure both the incumbent and the candidate as exporters. Run for two to four weeks. Now you have the same telemetry in both systems and you can answer real questions: do the service maps match, are the latency percentiles the same, does the candidate’s alerting catch what the incumbent caught, what does the candidate’s bill look like on your actual volume rather than a sales estimate.
Needs first-hand data: During dual-export, record the ingested volume each vendor reports for identical traffic. Vendors count spans, custom metrics and log bytes differently, and the gap between the two numbers is the part that surprises people at invoice time.
Then cut over by removing an exporter. Keep the old vendor’s contract running long enough to cover the historical window you actually query — usually thirty days is plenty.
The cost of dual-export is egress and duplicate ingest for the overlap period. That is a small, bounded, known cost against an unbounded unknown. Take it every time.
Semantic conventions are the part that makes data portable
Data portability is not just wire format. If two systems both accept OTLP but you named your attributes differently in each, nothing ports.
OpenTelemetry semantic conventions define standard attribute names for HTTP, database,
messaging, RPC and infrastructure. Use them. http.request.method, http.route,
http.response.status_code, db.system, server.address, messaging.system — these
are boring and that is the point. A dashboard written against semantic conventions works
on any backend that stores them; one written against vendor.http.verb works nowhere
else.
Two rules. Never invent an attribute name where a convention exists — check first. And put your own attributes under a clear prefix so custom and standard stay visually separable.
Conventions have churned. Several areas moved from experimental to stable and attribute names changed along the way. Pin your SDK versions and upgrade deliberately rather than discovering renamed attributes through broken dashboards.
Where OpenTelemetry is still weak
Anyone telling you OTel is finished is selling something.
Profiling is the newest signal. Continuous profiling arrived long after traces, metrics and logs and the ecosystem around it is correspondingly thinner. If continuous profiling is a core requirement today, expect a vendor-specific solution and expect it to be the least portable part of your stack.
Language SDK maturity is uneven. Java, Go, Python, .NET and Node.js are in good shape. Move outside that set and you find components at different stability levels, features that exist in one language and not another, and documentation that assumes you already know the gap. Check the specific signals you need in the specific languages you run — not the general project status.
Auto-instrumentation coverage is not uniform. The JVM agent is excellent. Node.js and Python are good for common libraries. But every language has frameworks and drivers with no instrumentation, and the gap always shows up somewhere load-bearing — an internal RPC layer, an ORM, a message queue client. Budget for manual spans.
The collector is a system you now operate. It needs capacity, monitoring and upgrades. Its config format is expressive and easy to get subtly wrong. It is worth it, but it is not free, which is the same honest accounting that applies to self-hosted observability stacks generally.
Needs first-hand data: For each language in your estate, list which OTel signals are stable, which auto-instrumentation packages cover your actual frameworks, and where you had to write manual spans. That inventory is your real OTel readiness score.
SigNoz
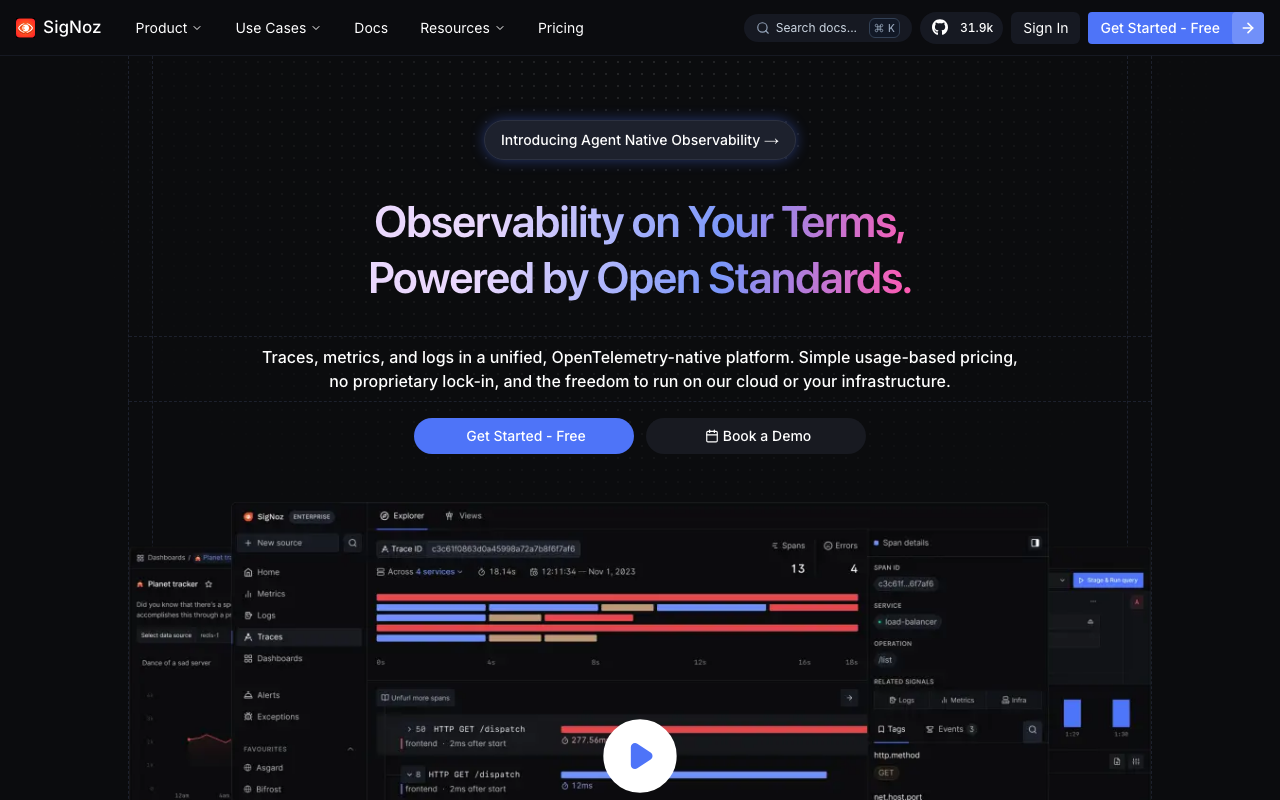
SigNoz is OpenTelemetry-native by construction rather than by retrofit. It accepts OTLP directly, stores signals in ClickHouse, and there is no proprietary agent to install. If portability is your primary criterion, this is the architecture you are describing: the data you send is the data it stores, semantic conventions intact, and the escape hatch is a collector config change rather than a re-instrumentation project.
Pros
- No proprietary agent anywhere in the path, so instrumentation is genuinely vendor-independent
- Stores OTel semantic conventions rather than remapping them, so queries and dashboards port
- ClickHouse handles the high-cardinality span attributes OTel encourages you to attach
- Self-hostable, which means the exit option does not depend on the vendor’s goodwill
Cons
- Integration breadth and prebuilt content are far behind the large commercial platforms
- Self-hosting means owning ClickHouse; the hosted tier removes that but costs the control
- Open core — SSO and some access control belong to the paid tiers
Best for: Teams who have already committed to OpenTelemetry instrumentation and rank exit velocity above product breadth.
Pricing: Free open source community edition alongside a usage-based hosted tier; enterprise features such as SSO and support response times are gated. Self-hosting shifts the cost to ClickHouse infrastructure and engineer hours.
Uptrace
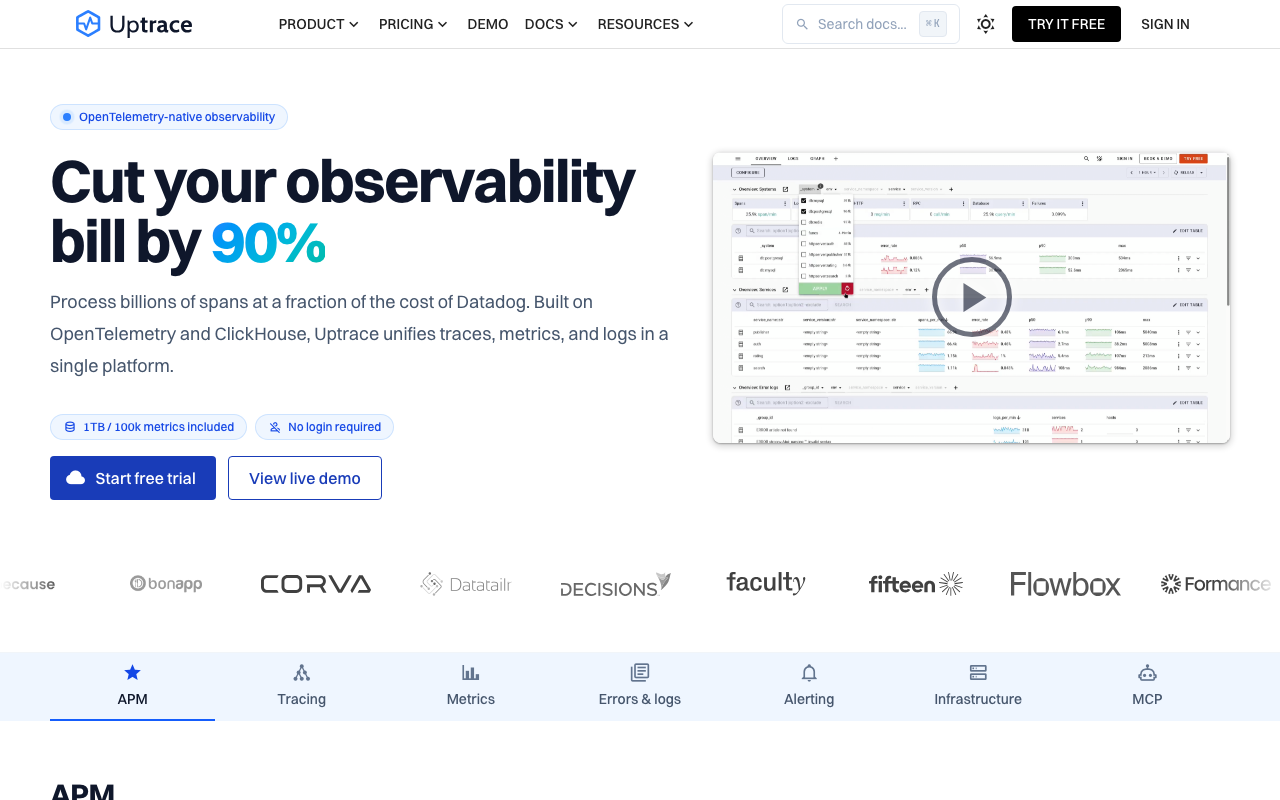
Uptrace makes the same call with a smaller product around it: OTLP in, ClickHouse underneath, one UI over traces, metrics and logs. The portability posture is identical to SigNoz — no agent, conventions preserved — with less surface area to learn and less to misconfigure.
Pros
- OTLP-native with no proprietary SDK distribution required
- Small enough to reason about end to end, which shortens debugging of the stack itself
- Same ClickHouse foundation, so high-cardinality attributes are not a problem
Cons
- Narrower feature set: fewer prebuilt dashboards, fewer alerting integrations
- Smaller community means fewer people have hit your edge case before you
- Self-hosting still means operating ClickHouse
Best for: Small teams who want an OTLP-native backend they can fully understand rather than a platform they configure.
Pricing: Open source licence with a hosted commercial option and some capabilities on the paid side; self-hosted cost is ClickHouse infrastructure plus maintenance time.
HyperDX
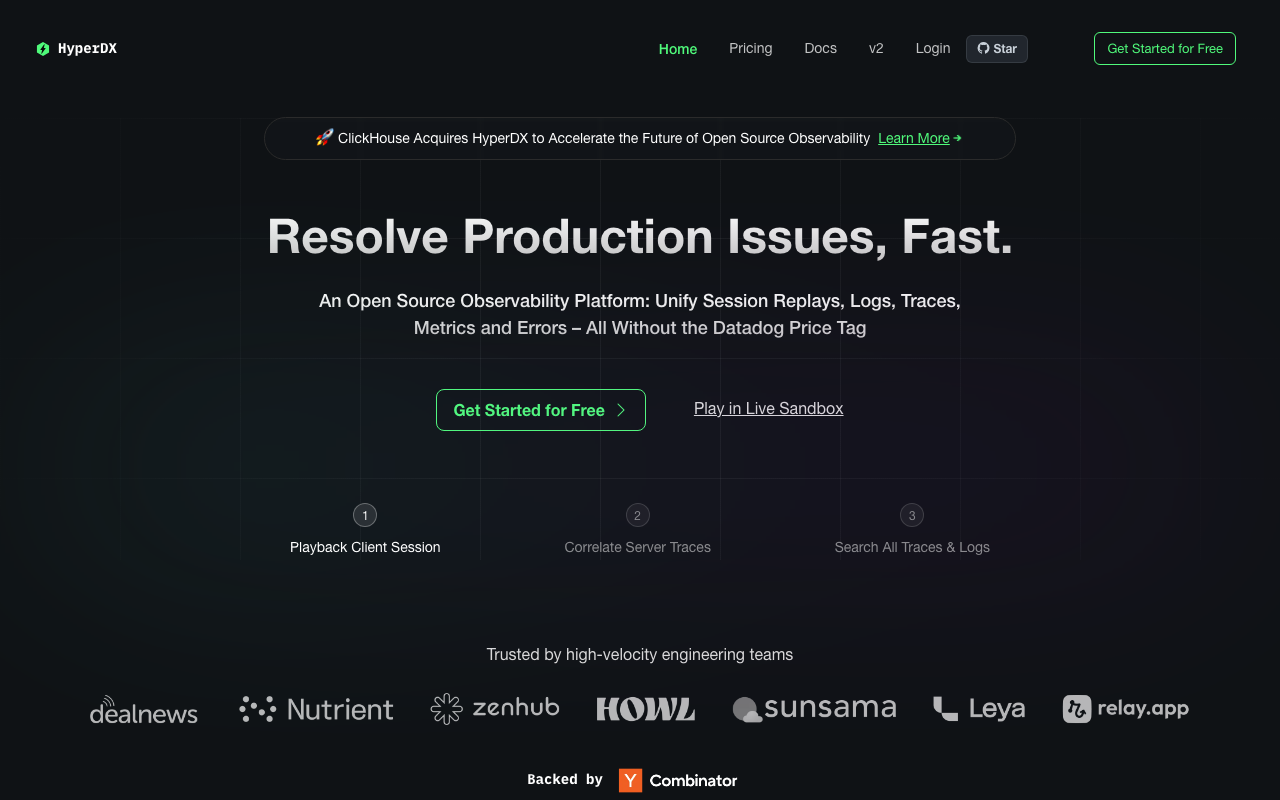
HyperDX also builds on ClickHouse and OTLP, adding session replay alongside traces and logs so front-end context sits next to backend spans. Smaller ecosystem than the established projects, same portability posture: upstream SDKs, upstream collector, no vendor agent in the request path.
Pros
- Session replay correlated with OTel traces without a second vendor
- Runs on a ClickHouse instance you may already operate for analytics
- OTLP-native, so leaving costs a config change rather than re-instrumentation
Cons
- Youngest of the OTLP-native options, with the least production history behind it
- Session replay adds storage volume and privacy obligations traces alone do not
- Alerting and dashboard depth trail the larger platforms
Best for: Teams who want browser session context stitched to OTel traces and already have ClickHouse operational experience.
Pricing: Open source licence plus a commercial hosted tier. Self-hosted cost is ClickHouse capacity — noticeably higher once replay data lands — plus engineer time.
Honeycomb
Honeycomb approaches OTel from a different direction. Its whole model is wide, high-cardinality events queried interactively, which maps unusually well onto OTel spans carrying rich attributes. It accepts OTLP, and its philosophy — put everything on the span, ask questions later — is closer to how OpenTelemetry is designed to be used than most competitors. The product rewards teams who instrument richly and investigate by querying rather than by clicking through prebuilt dashboards.
Pros
- Query model built for exactly the wide, high-cardinality spans OTel encourages
- OTLP ingestion with no proprietary agent required for the core product
- Exploratory workflow finds unknown-unknowns that dashboard-first tools miss
- Strong culture and documentation around instrumenting well, not just collecting
Cons
- Event-centric model is a real learning curve for teams used to dashboards and metrics
- Traces and events are the strength; infrastructure metrics breadth is not the focus
- Pricing scales with event volume, so rich attributes on high-throughput services need sampling discipline
Best for: Teams debugging complex distributed systems who will invest in rich instrumentation and want to ask arbitrary questions rather than read prebuilt views.
Pricing: Usage-based on event volume across tiers, with a free entry tier and enterprise agreements above it. Sampling at the collector is the main lever on the bill, which makes tail-based sampling a cost control rather than only a fidelity decision.
Grafana
Grafana sits in the middle in an interesting way. The stack accepts OTLP across metrics, logs and traces, and because the storage components are separately runnable, the self-hosted escape hatch is genuine rather than theoretical. You can start on the hosted product and move the same components in-house without changing instrumentation — which is a materially different position from vendors whose only exit is to a competitor.
Pros
- OTLP accepted across all three signals with no proprietary agent required
- The same components run hosted or self-hosted, so the exit path is real and rehearsed
- Dashboards and alert rules as code, portable between hosted and self-hosted deployments
- Queries non-Grafana datasources too, so it survives changes underneath it
Cons
- More assembly than a single-product platform, even in the hosted form
- Licence position has shifted and some capabilities are Enterprise-only
- Cross-signal correlation depends on you wiring datasources and labels correctly
Best for: Teams who want a hosted product today but insist on a credible self-hosted fallback using the same components and the same instrumentation.
Pricing: Open-core components free to self-host, with a hosted cloud tier metered separately per signal and an enterprise tier above it. The self-hostable escape hatch is the real pricing lever — it caps how far the hosted bill can run away from you.
Coralogix
Coralogix accepts OTLP and puts significant weight on processing telemetry in-stream — filtering, transforming and routing before storage — which pairs naturally with a collector-first architecture where you are already thinking about what to keep. The design assumption is that not all telemetry deserves the same storage tier, and the platform gives you the controls to act on that.
Pros
- In-stream processing means you decide what to keep before you pay to store it
- OTLP ingestion without a mandatory proprietary agent
- Tiered handling of telemetry pairs well with tail-based sampling at the collector
- Strong fit for log-heavy estates where volume, not span count, drives the bill
Cons
- The processing model is another configuration surface to learn and maintain
- Routing rules that drop data are load-bearing: a wrong rule loses telemetry silently
- Less well known than the incumbents, so fewer engineers arrive already familiar with it
Best for: Log-heavy teams who want to shape and tier telemetry in flight rather than store everything and filter at query time.
Pricing: Volume-based ingestion pricing differentiated by how data is processed and stored, so routing low-value telemetry to cheaper handling is the primary cost lever.
Datadog

Datadog is the reference case for the other pattern. It accepts OTLP and the support is real. It also has a mature proprietary agent, and the product’s depth — the integration catalogue, the security and RUM products, the long tail of prebuilt views — is built around that agent. You can run it OTel-first. You will be using a narrower version of the product than customers who did not.
Pros
- Genuinely accepts OTLP, so an OTel-first deployment is a supported path rather than a hack
- Unmatched breadth: integrations, security monitoring, RUM, synthetics and profiling in one place
- Deep prebuilt content means less dashboard building for common infrastructure
Cons
- Full product depth is tied to the proprietary agent, so OTel-only users get a narrower product
- Attributes get enriched and reshaped into Datadog’s model, so queries and dashboards do not port
- Multiple independent meters mean the bill can escalate through a signal you were not watching
Best for: Teams who value integration breadth and security tooling more than exit velocity, and are prepared to pay migration cost in instrumentation later.
Pricing: Per-host subscription with separate meters for logs, custom metrics, traces, synthetics and RUM; annual commitments discount the base, and overage on any single meter can dominate the invoice.
New Relic
New Relic similarly accepts OTLP while maintaining its own agents and a data model that predates OpenTelemetry. Same shape of trade-off as Datadog: real OTLP support, best experience on the native path. Its long-standing telemetry database and consumption-based model are the distinguishing features, and both predate and sit slightly askew from the OTel data model.
Pros
- OTLP ingestion into the same backend that serves its native agents
- Consumption model bills on data volume and users rather than per host, which suits elastic infrastructure
- Broad platform coverage across APM, infrastructure, logs and browser monitoring
Cons
- Its data model predates OpenTelemetry, so semantic conventions may be remapped on ingest
- Full feature depth still favours the native agents over pure OTLP instrumentation
- Query language is proprietary, so dashboards and alerts do not port to another vendor
Best for: Teams wanting broad platform coverage on a consumption model, who accept that instrumentation portability ends at the ingest boundary.
Pricing: Consumption-based on ingested data volume plus billable user seats, with a free entry tier; the levers are ingest filtering at the collector and how many users need full platform access.
How to choose
Run the three tests in a week.
First, ask every shortlisted vendor the agent question in writing: “can we get the full product using only upstream SDKs and the upstream Collector?” Written answers are more honest than demo answers.
Second, stand up the collector in front of whatever you run today, even if you are not migrating. It costs a day and converts a future migration from a project into a config change.
Third, if you are evaluating a switch, dual-export for a fortnight before signing anything and compare the data, the alerting behaviour and the reported ingest volume.
Weight portability against product depth deliberately. If your telemetry is OTel-instrumented and your team is comfortable operating infrastructure, an OTLP-native platform is a strong default. If you need breadth of integrations and security tooling more than you need exit velocity, the wrapped platforms earn their position — see Datadog alternatives for where that line usually falls.
| Vendor | Ingest path | Agent required for full product | Portability posture |
|---|---|---|---|
| SigNoz | OTLP native | No | High — no proprietary agent |
| Uptrace | OTLP native | No | High |
| HyperDX | OTLP native | No | High |
| Honeycomb | OTLP native | No | High |
| Grafana | OTLP native | No | High — components self-hostable |
| Coralogix | OTLP native | No | High |
| Datadog | OTLP accepted | Yes for full breadth | Moderate — depth tied to agent |
| New Relic | OTLP accepted | Yes for full breadth | Moderate — proprietary query language |
Frequently asked questions
Does OpenTelemetry actually prevent vendor lock-in?
It prevents instrumentation lock-in, which is the expensive kind. It does not prevent dashboard, alert or query lock-in, and it does not move historical data. Plan migrations as overlap periods, not cutovers.
Should I use a vendor’s OpenTelemetry distribution?
A distribution that is upstream OTel plus sensible defaults is fine. A distribution that adds proprietary features you come to depend on is instrumentation lock-in wearing an OTel badge. Check whether the distro’s output is still plain OTLP.
Is OpenTelemetry overhead a problem?
Overhead depends on sampling rate, span volume per request and how much attribute data you attach — it is a configuration question more than a project question. Measure it on your own workload rather than trusting a general figure.
What about serverless, where I cannot run a collector sidecar?
Serverless changes the deployment shape — you use a layer or extension, or export directly to a gateway collector. The constraints are different enough to warrant separate treatment; see APM for serverless and edge functions.
Related reading
- Best APM tools for developers — the full landscape, OTel-native and otherwise.
- Best open source APM and observability tools — the storage engines behind the OTLP-native platforms.
- Best self-hosted observability stacks — running the collector and backends yourself.
- Datadog alternatives — where teams go when the bill outgrows the value.
- Best APM for serverless and edge functions — collector deployment where you have no sidecar.
- Best APM for Kubernetes workloads — collector as DaemonSet plus gateway.