The observability decision at a five-person startup is not the decision a platform team makes. You are not comparing feature matrices. You are answering one question — when production breaks at 11pm, can I find out why in under ten minutes — with an afternoon of effort and a budget somewhere between nothing and small.
That constraint eliminates most of the market immediately. Anything requiring a sales call before you can send data is out. Anything that takes a week to configure is out. Anything where the free tier is a trial in disguise is out, because you will rebuild the whole setup in a fortnight.
What remains is a decent set of options, and the interesting question is not which is best today. It is which is still affordable when you are twenty people and have accidentally shipped a debug log statement inside a hot loop.
Key takeaways
- Optimise for time to first trace, not feature coverage. A tool configured in an afternoon that shows most of what is wrong beats a perfect tool you never finished setting up.
- Free tiers end along four axes — retention, host count, data volume, seat cap. Work out which one your growth hits first; they are not equally survivable.
- The bill jumps on architectural change, not traffic change: more services, more pods, more log lines per request.
- Instrument with OpenTelemetry from day one even on a vendor free tier. It is the only thing that makes switching cheap later.
What a startup actually needs
Three things, in this order.
Time to first value measured in hours. Install, deploy, see a real trace from a real request the same afternoon. If setup requires an agent daemonset, a sales call and a pricing negotiation, you have already lost more engineering time than the tool saves you this quarter.
A free tier that is actually free, indefinitely. Not a trial. That distinction is deliberately blurred in marketing copy and it matters — a trial means doing this work twice.
No procurement. Credit card, self-serve, cancel whenever. The moment a vendor requires an annual commitment to get past a demo environment, they are not selling to you.
Notice what is absent: RBAC, SSO, data residency, audit logs, contractual support SLAs. Those are not startup problems. They become blocking the moment you sign your first serious enterprise customer, and at that point you are reading APM for enterprise instead. Do not pay for them now.
How free tiers end, described as models
Free tiers do not simply run out. They end along one of four axes, and which axis you hit first determines how bad the transition is.
Retention is the gentlest. It limits how far back you can query, and everyone hits it immediately. A short window means you cannot investigate last week’s incident — annoying, not blocking, since most investigation happens within hours. Accept a short retention window before you accept any of the others.
Host or service count breaks without warning, because it does not track your business at all. Move from three VMs to thirty small pods and your host count multiplied by ten while traffic did not change. Kubernetes and microservice teams hit this first, it is the subject of APM for Kubernetes, and it is the most common way startups get surprised.
Data volume ingested — gigabytes of logs, spans, or metric series — is the one you
control but rarely do. One logger.debug inside a request handler, shipped on a Friday,
multiplies ingest overnight. The fix is a sampling policy and log level discipline, not a
bigger plan.
Seat caps are the sneakiest: the limit is on people, and the thing you most want during an incident is more people able to look. Teams that grow headcount faster than traffic hit this first. A tool where two engineers can see production is not an observability tool.
Needs first-hand data: Record what actually exhausts each free tier first — retention, hosts, ingest or seats — with elapsed time and the event that caused it. A timeline reading “week three: added a second service, hit host cap” beats any published limit table.
The moment the bill jumps
It is almost never traffic. Traffic growth is gradual and you see it coming. The bill jumps on architectural events, and there are four.
You split the monolith. Per-host pricing multiplies by service count. Per-span pricing multiplies by call chain depth, because a request that produced three spans now produces thirty.
You moved to Kubernetes. Pods are ephemeral and numerous, so any unit tied to “a monitored thing” counts many more things — and autoscaling spikes the count precisely when you are busiest.
Someone added a high-cardinality label. A user_id or session_id on a metric turns
one time series into millions. Fastest and most violent form of bill growth, usually
because someone was debugging and forgot to revert.
You turned on a second product. RUM, session replay, profiling, synthetics — each is a separate meter, and enabling three in one sprint triples a bill quietly.
Needs first-hand data: Instrument one service, then perform each of these four changes in isolation and record the change in billable units for each. A “what each architectural change does to your meter” table would be the single most useful artefact in this article.
When a startup should just self-host
The default advice is that startups should never self-host observability, and it is usually right. Engineers are your scarcest resource and running a storage cluster is not your product. Three situations invert that.
You already run stateful infrastructure competently. If someone already operates Postgres, Kafka or Elasticsearch in production, running SigNoz or a Grafana stack on a VM is a smaller marginal step than it looks, and the cost is a machine rather than a subscription.
Your data volume is high relative to your revenue. Products that process events, media or logs as the core business generate telemetry that per-GB pricing punishes disproportionately. Self-hosting converts a cost that scales with your product into one that scales with hardware.
You have a compliance requirement early. A contract saying telemetry cannot leave a region is easier to satisfy by running the stack yourself than by negotiating regional pinning on a startup plan.
If any apply, open source APM tools and self-hosted observability stacks cover the options and the ongoing operational cost nobody puts in the comparison.
Grafana
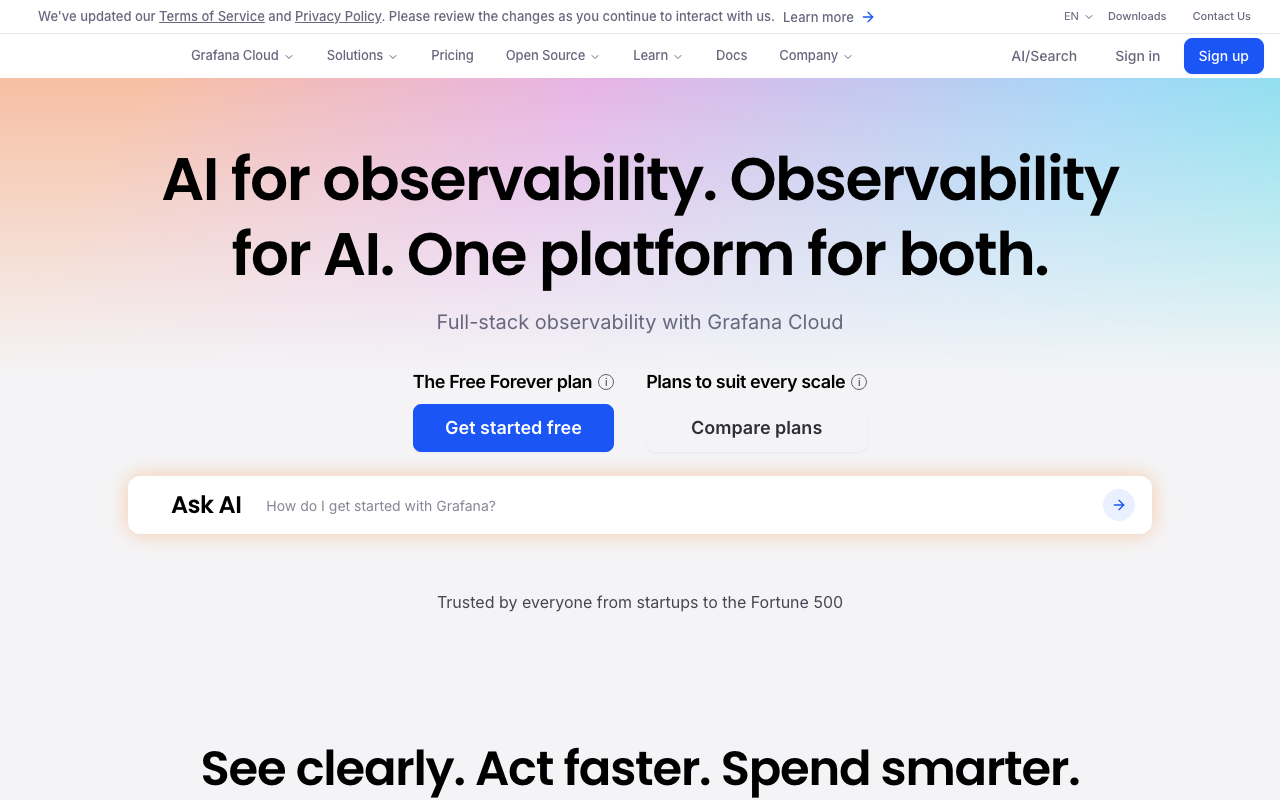
Grafana Cloud is where I would start for most teams. The free tier is structured sensibly for small teams — the limits sit on volume and retention rather than on capability — and the components underneath (Prometheus or Mimir for metrics, Loki for logs, Tempo for traces) are open source. The real argument for Grafana is the exit: if the managed bill turns unpleasant, the same stack runs on your own hardware with the same queries and the same dashboards. Very few vendors give you that.
Pros
- The exit path is a hosting change, not a migration — same software managed or self-hosted
- Free tier restricts volume and retention rather than removing features you would need in an incident
- Open query languages whose skills transfer to any future employer or backend
- Huge dashboard ecosystem, so most infrastructure has a community dashboard already
Cons
- Assembly required: correlation between logs and traces works only because you configured it
- Several moving components to understand, which is more concept load than a single-product backend
- Metric cardinality is entirely your problem, and it is the fastest route off the free tier
Best for: Small teams who want a credible free tier now and the ability to move the whole stack in-house later without re-instrumenting or rebuilding dashboards.
Pricing: Usage-based above an included allowance, metered separately on metric series, log and trace volume, and retention length — with self-hosting available as the escape valve that converts the bill into hardware.
SigNoz
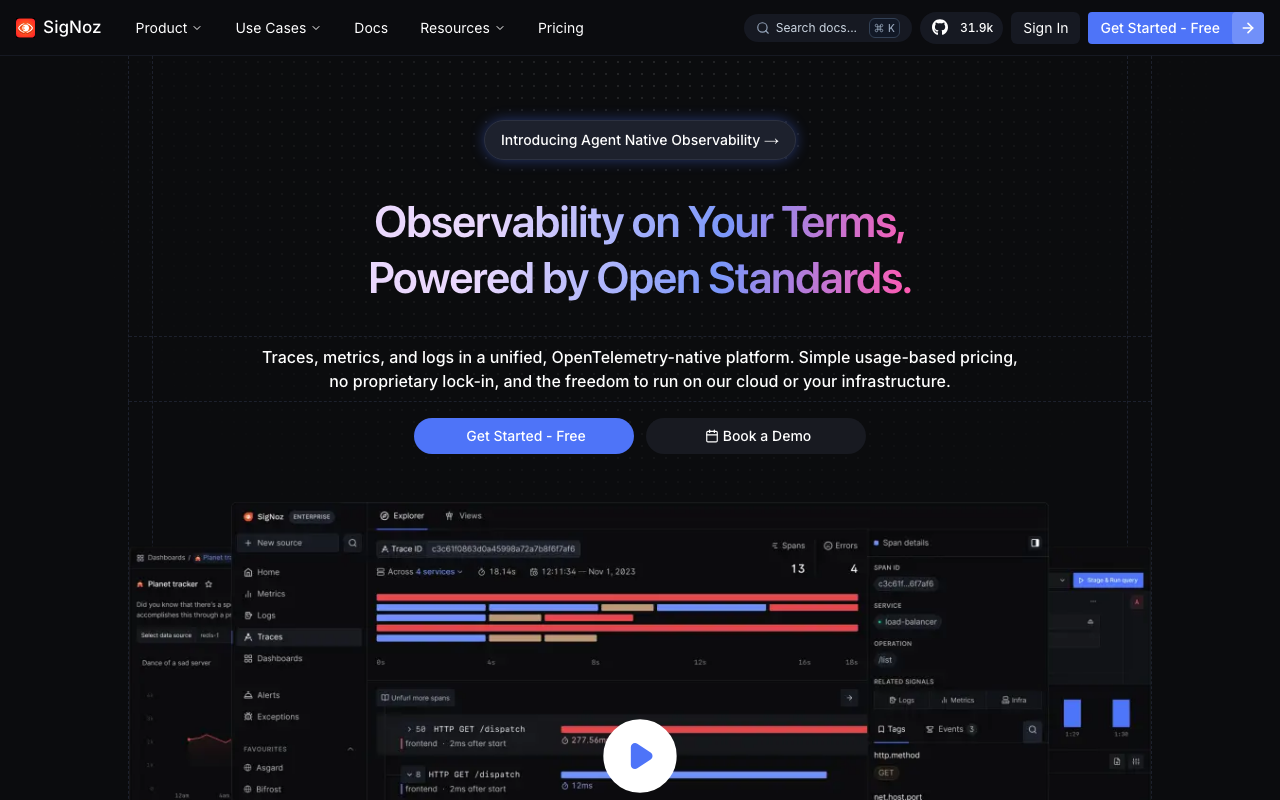
SigNoz is the strongest single-product option if you want one backend for metrics, traces and logs without integrating anything. It ingests OpenTelemetry natively, so there is no proprietary agent and no re-instrumentation if you move later. Run the open-source version on one VM, or take the managed tier — the same product either way, which makes it a low-regret pick for a startup that might grow into wanting its own data.
Pros
- All three signals in one product, so there is no integration work on day one
- Native OTLP ingestion means your instrumentation is portable from the start
- Open-source build with no ingestion ceiling if you would rather pay for a VM than a subscription
- Small enough to operate on a single machine at startup scale
Cons
- Fewer prebuilt integrations than the incumbents, so infrastructure dashboards need more work
- Younger product, with less depth in advanced alerting and query features
- Self-hosting means operating a columnar datastore you probably have not run before
Best for: A startup already emitting OpenTelemetry that wants one backend for everything and wants the self-host option available without switching products.
Pricing: Managed tiers meter ingested data per signal with retention priced separately; the open-source build carries no licence cost and moves the entire expense into the machine you run it on.
Uptrace
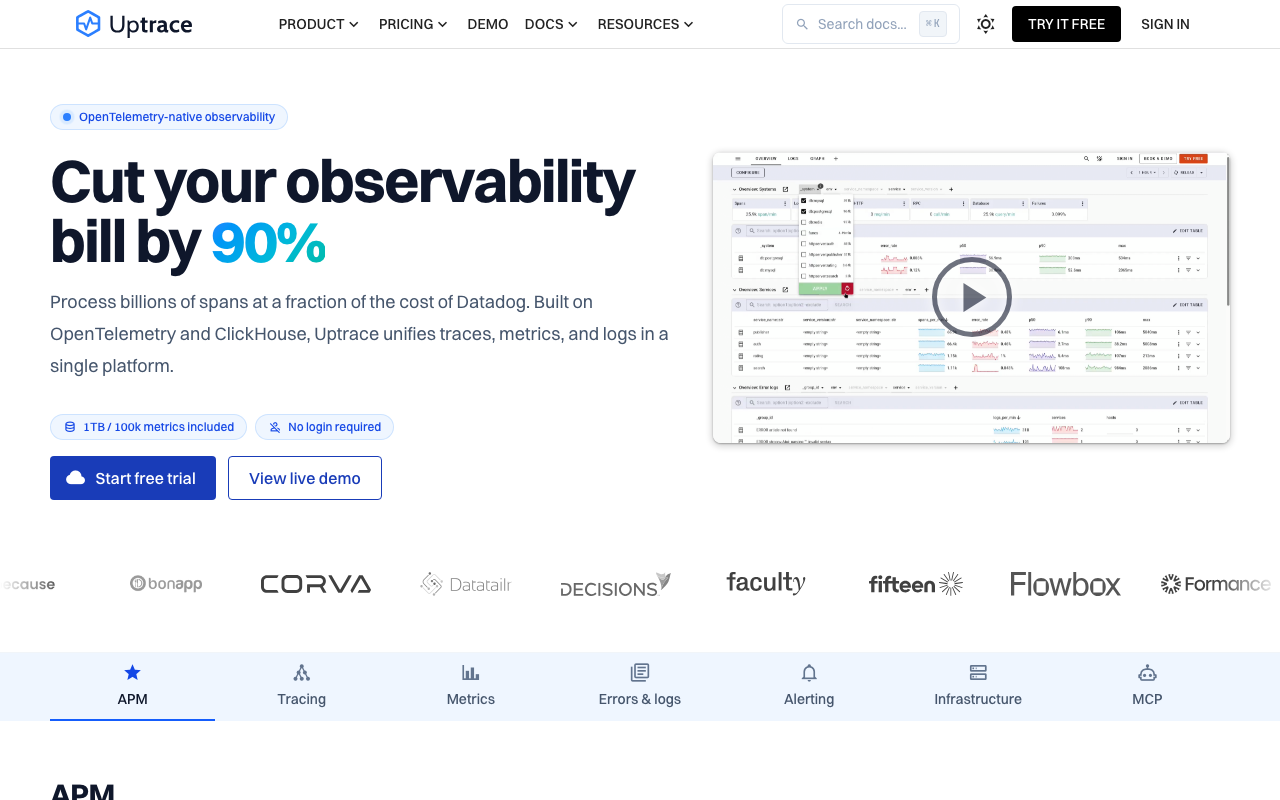
Uptrace sits in the same OpenTelemetry-native bracket as SigNoz and is worth evaluating alongside it because it is architecturally lean — a smaller footprint for the same three-signal coverage. It is a smaller project, which cuts both ways: less surface area to operate, but a smaller community when you hit something odd at 2am. For a team comfortable reading source code, that trade is usually fine.
Pros
- Lean footprint, cheap to run beside existing infrastructure rather than on dedicated hardware
- OTLP-native, so no proprietary agent and no lock-in at the instrumentation layer
- Self-hosted and managed options from the same codebase
- Small enough codebase that reading it is a viable debugging strategy
Cons
- Smallest community of the OTel-native options, so obscure problems have fewer existing answers
- Thinner integration and dashboard ecosystem than Grafana or the incumbents
- Fewer people on your team will have used it before, so knowledge does not arrive with hires
Best for: Small engineering teams comfortable operating their own infrastructure who want OTel-native coverage at the lowest possible resource footprint.
Pricing: Managed plans meter ingested spans, logs and metric data points with retention tiers; the open-source build is licence-free and costs whatever the VM costs.
Better Stack
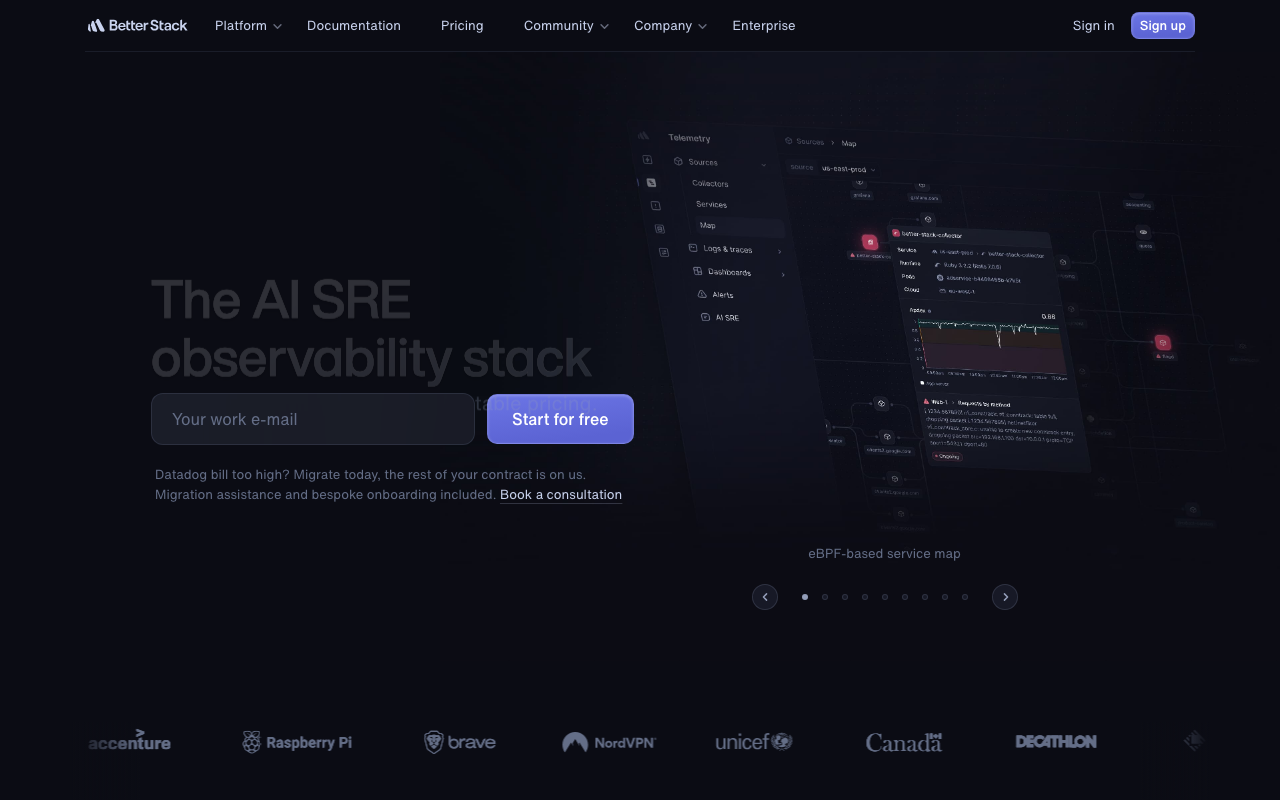
Better Stack comes at this from a different angle — uptime monitoring and incident management first, logs and metrics attached. For early-stage teams that ordering is honest about reality. Your first six months of incidents are mostly “the site is down and nobody noticed for twenty minutes”, not “the p99 of checkout regressed”. External uptime checks plus a working on-call rotation catch more real damage than distributed tracing does, which is why uptime and synthetic monitoring deserves its own budget line.
Pros
- Solves the failure mode that actually hurts early-stage teams: nobody noticed the site was down
- On-call scheduling, escalation and status pages included rather than bought separately
- External checks catch failures your own instrumentation structurally cannot report
- Fast to set up — useful monitoring exists within an afternoon
Cons
- Not a deep tracing product; it will not tell you which span in a call chain regressed
- Log and metric coverage is secondary to the uptime and incident product
- Growing into serious distributed tracing means adding a second tool anyway
Best for: Pre-product-market-fit teams whose realistic incident is a total outage nobody was paged for, rather than a latency regression in one service.
Pricing: Tiered subscription driven by monitor count and check frequency, with log and metric retention as separate meters on top.
Middleware
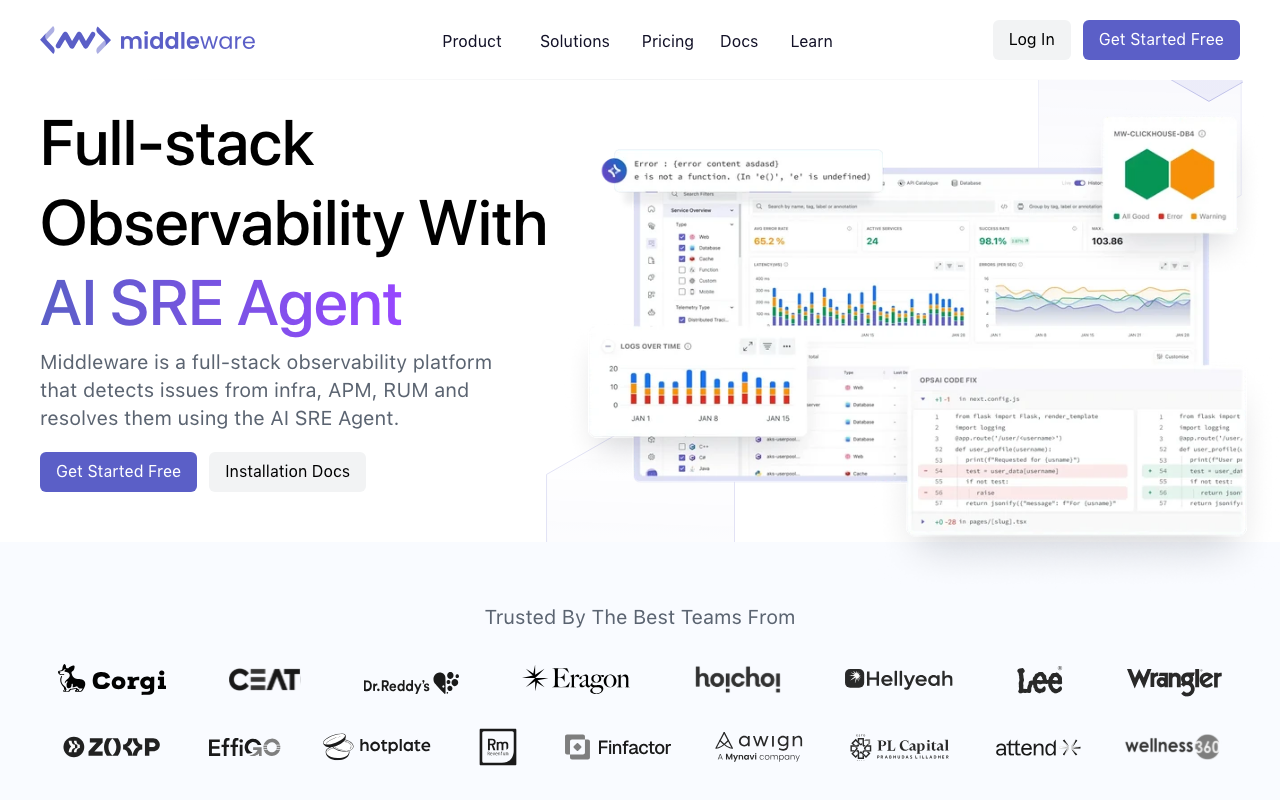
Middleware bundles infrastructure monitoring, APM, logs and RUM into one product aimed specifically at teams priced out of the incumbents. The proposition is the all-in-one experience — one agent, correlated signals, one UI — at a different point on the cost curve. For teams who want a single vendor rather than an assembled stack it is a reasonable shortcut.
Pros
- Single-vendor coverage across infrastructure, traces, logs and RUM without integration work
- Positioned deliberately against incumbent pricing, which is the constraint that matters here
- Accepts OpenTelemetry data, so instrumentation is not trapped
- Fast onboarding compared with assembling a composable stack
Cons
- Smaller company than the incumbents, which is a real consideration for a multi-year dependency
- Integration catalogue is narrower, so unusual infrastructure needs custom work
- Bundling means you may be paying for modules you never enable
Best for: Small teams who want the all-in-one experience and have already concluded the incumbent’s bill does not fit the budget.
Pricing: Usage-based across the bundled products, metered on data ingested and hosts monitored. Evaluate it the way you would the incumbent: send real data, check the query experience, read the pricing model rather than the headline.
Last9
Last9 is the one to look at if your problem is metric cardinality rather than tracing. It is built around controlling the cost of high-cardinality time series — shaping and aggregating series before they reach storage rather than after the bill arrives. That is a narrow problem, but it is the one that ends free tiers fastest for Kubernetes teams, and if you already know that is where your pain is, a specialist beats a generalist.
Pros
- Directly targets the failure mode that most often causes a surprise observability bill
- Cardinality control happens before storage, so the saving is real rather than a filtered view
- Compatible with the Prometheus ecosystem, so existing dashboards and alerts survive
- Narrow scope means the product does the one thing well rather than four things adequately
Cons
- Not a full APM replacement; tracing and log coverage are not the centre of the product
- Only worth adopting if cardinality is demonstrably your binding constraint
- Adds a vendor to a stack you may still need a second tool alongside
Best for: Kubernetes teams whose metric series count is growing faster than their traffic and whose bill is driven by cardinality rather than requests.
Pricing: Metered on time series and data points ingested after shaping, which is the point — the meter counts what you kept rather than what you emitted.
New Relic
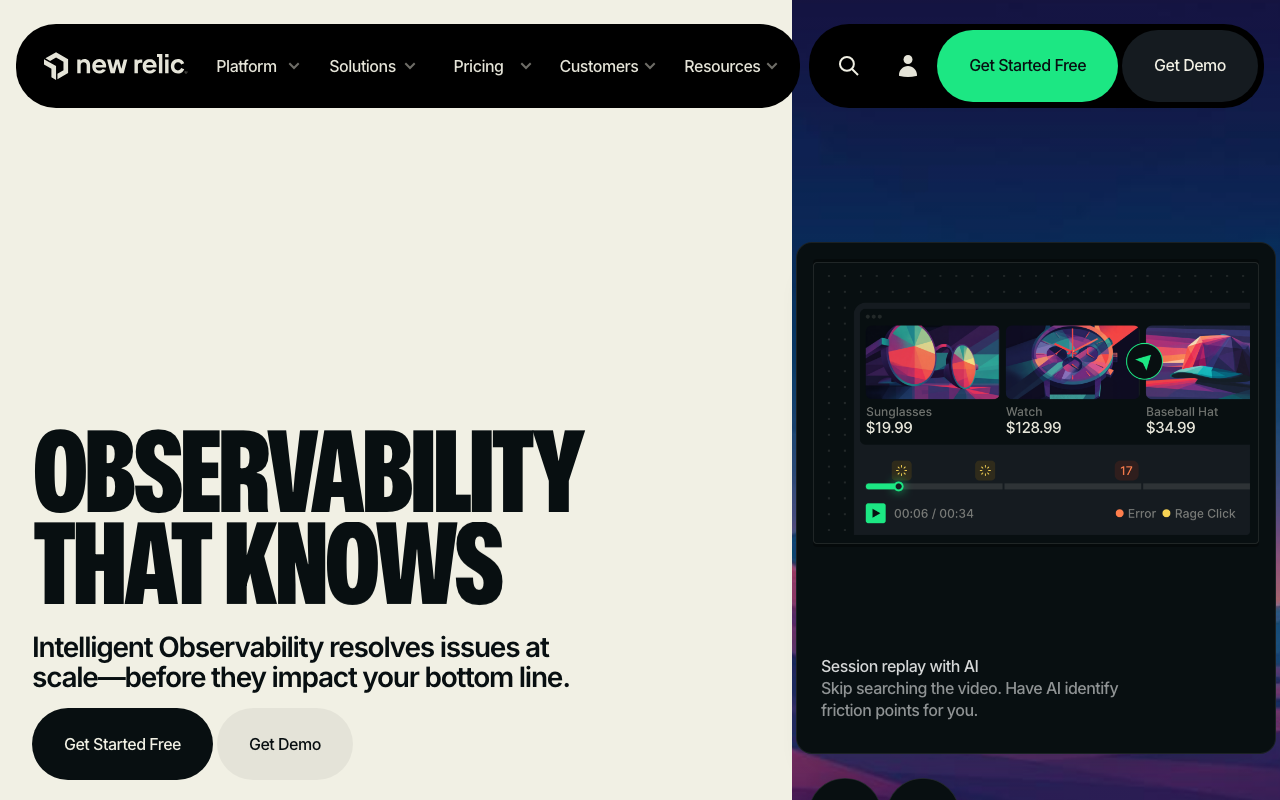
New Relic deserves consideration here because its free tier has an unusual shape: generous on data volume, with a per-seat model layered on top. That is a genuinely different trade from everything above, where the binding constraint is normally hosts or ingest. Whether it suits you depends on whether your team grows in headcount faster than in data volume — a three-person team with heavy telemetry gets a lot from it, an eight-person team with modest telemetry gets much less. The product itself is a full all-in-one platform, so growing into it does not mean switching tools. Check current terms yourself.
Pros
- Free tier is bounded by seats rather than hosts, which suits small teams on many small services
- Full platform capability rather than a feature-stripped entry product
- Growing past the free tier is a plan change, not a migration
- One query language across metrics, traces and logs
Cons
- Seat-bound limits are exactly wrong during an incident, when you want more eyes not fewer
- Ingest-driven billing punishes verbose logging with no per-service ceiling
- Proprietary dashboards and query language, so the eventual exit cost matches any incumbent
Best for: Very small teams with a large telemetry footprint who need full platform capability and can live with a hard limit on how many people log in.
Pricing: Free allowance on data ingested with charges above it, plus per-user tiers that gate capability — so headcount and data volume move the bill independently.
How to choose
This week: instrument your busiest service with OpenTelemetry rather than a vendor agent. It takes an afternoon and makes every subsequent decision reversible.
Point that data at two candidates at once using a collector with two exporters. Grafana Cloud and SigNoz is a reasonable pair — it contrasts an assembled stack against a single product.
Then break something on purpose in staging and time how long each takes to lead you to the cause. That is the entire evaluation.
Before committing, write down which free tier axis you will hit first and roughly when. If the answer is host count and you are about to adopt Kubernetes, pick differently. If you cannot answer, read what the free tier really costs before signing up.
| Tool | Shape | Axis that ends your free ride | Pick it when |
|---|---|---|---|
| Grafana | Composable, managed or self-hosted | Metric series and ingest volume | You want a guaranteed exit path in-house |
| SigNoz | OTel-native, single product | Ingested data per signal | You want one backend and no integration work |
| Uptrace | OTel-native, lean | Ingested data points | You run your own infrastructure and want a small footprint |
| Better Stack | Uptime and incidents first | Monitor count and check frequency | Your real risk is an outage nobody noticed |
| Middleware | All-in-one bundle | Ingest and hosts | You want single-vendor coverage at a lower price point |
| Last9 | Cardinality control | Time series retained | Kubernetes metric cardinality is the thing breaking your bill |
| New Relic | All-in-one, ingest-priced | Seats | Telemetry is large and very few people need to log in |
Frequently asked questions
Should a five-person startup pay for APM at all?
Usually not at first. Start on free tiers and open source, and let the bill arrive once the tool has already saved you an incident. What you should pay for early is external uptime monitoring and a working alert path to a human phone.
Is Datadog ever the right choice for a startup?
It can be, if you are well funded and engineering time is worth more than the invoice — the integration catalogue saves setup weeks. The risk is that its pricing model punishes exactly the architectural changes startups make, so you inherit a cost problem at the worst moment. Know your alternatives before you need them.
How do I avoid re-instrumenting everything when we switch?
Emit OpenTelemetry to a collector you control, and configure the backend as an exporter there. Switching then means changing one config file rather than touching every service. Highest-leverage hour of work in the whole exercise.
What about language-specific tools?
Auto-instrumentation maturity varies a lot by runtime. If your stack is one language, start with the guide for Node.js, Python or Go rather than a general list.
Related reading
- Best APM tools for developers — the category map and why vendors price on incompatible units.
- Best free APM tools — the anatomy of a free tier and what it silently drops.
- Best open source APM tools — the self-host option and what it costs in engineer hours.
- Best APM for Kubernetes workloads — why the bill scales with pods rather than traffic.
- Best OpenTelemetry-native platforms — backends built for OTLP rather than converting it.