Every APM vendor’s Go page says “get started in minutes.” Then the instructions are: import this package, wrap your HTTP handler, wrap your client transport, wrap your SQL driver, wrap your gRPC interceptors, and thread context.Context through every function you want to see in a trace.
That is not a documentation failure. It is the language. Go compiles to a static binary with no dynamic dispatch to hijack, no import hook, no bytecode to rewrite at load time, and no runtime that lets an agent swap a function pointer after the fact. The tricks behind Node, Python and Java auto-instrumentation do not exist here.
So the Go choice is not really which vendor. It is which of three instrumentation strategies you adopt — that decides your engineering cost, kernel requirements, trace quality and how easy it will be to leave.
Key takeaways
- Go has no zero-code auto-instrumentation without eBPF. The options are manual OTel SDK wiring, eBPF agents, and compile-time weaving.
- eBPF needs privileged access, a recent kernel, and DWARF symbols in the binary — a stripped build defeats it.
context.Contextpropagation is the entire trace story. A goroutine started without the context is a span you will never see.- Goroutine count trend, GC pause distribution and heap goal versus
GOMEMLIMITmatter more than generic CPU graphs.
Why there is no free auto-instrumentation in Go
Java has -javaagent and bytecode weaving, Node lets you patch a module’s exports before anyone holds a reference, Python has import hooks and sitecustomize. All three load code at runtime through something an agent can intercept.
Go resolves that at compile time. Dependencies are compiled in, calls are direct, and there is no loader or module registry to sit in front of — an external process cannot reach in and wrap database/sql. Three ways in remain, and they are genuinely different products.
Manual instrumentation with the OpenTelemetry Go SDK. Contrib wrappers for the libraries you use — otelhttp.NewHandler, otelhttp.NewTransport inside every http.Client, otelgrpc interceptors, an instrumented SQL driver — plus otel.Tracer(...).Start(ctx, "name") for your own boundaries. Complete control, complete portability, complete responsibility.
eBPF-based zero-code agents. A privileged process attaches uprobes to functions inside your running binary and reads arguments and returns out of memory. This is how the OpenTelemetry Go auto-instrumentation project, Grafana’s eBPF instrumentation and groundcover work.
Compile-time weaving and vendor libraries. Datadog’s Go tracer is contrib packages you import, plus a build-time tool that rewrites source via -toolexec — auto-instrumentation at the cost of a modified build.
| Approach | Code change | Requirement | Trace depth |
|---|---|---|---|
| OTel SDK manual | Yes, everywhere | None | As deep as you wire it |
| eBPF agent | None | Privileged, recent kernel, unstripped binary | Protocol boundaries only |
| Compile-time weaving | Build config | Modified build pipeline | Broad, library-level |
eBPF gets spans without code, and stops at the boundary
eBPF attaches uprobes at known offsets inside your binary — net/http server and client entry points, gRPC, the SQL driver — reads arguments from registers and stack, and emits a span. Finding those offsets needs symbol and DWARF information, so if your release build strips symbols with -ldflags="-s -w", as most do to shrink images, there is nothing to attach to. Check that first when eBPF “does not work.”
Go brings one advantage: it statically links its own TLS implementation, so an agent can probe crypto/tls read and write paths and see plaintext HTTP without a proxy.
And one hard problem: goroutine identity. To connect spans from different functions the agent must know they belong to the same request, and thread ID is useless because Go multiplexes goroutines across OS threads. Agents read the current goroutine’s g structure — on amd64 the runtime keeps it in a register under the register ABI — and track parentage. That works, and being coupled to runtime internals it can break on a Go release.
The practical shape: excellent coverage of what crosses a network boundary, near-zero effort, no view inside your business logic. You will see POST /orders took 800ms and which downstream calls it made, not that 600ms of it was the pricing calculation that never touched a socket. It also needs a privileged DaemonSet, CAP_BPF or root, and a kernel new enough for CO-RE and BTF.
Needs first-hand data: Deploy the same Go service twice — one build with symbols, one with
-ldflags="-s -w"— under an eBPF agent and record which spans appear in each, then compare eBPF-only coverage against eBPF plus manual spans.
context.Context is the whole ballgame
In Go, a trace is only as complete as your context plumbing.
The parent span lives in the context.Context, and tracer.Start(ctx, "work") returns a new context carrying the new span. A function that does not accept a context cannot create a child span, so what it does is invisible. One that gets context.Background() because it was convenient orphans everything below it — no error, no warning, the trace just stops.
The failure patterns, in the order you will meet them:
go doWork()without passing the request context. The goroutine’s work has no parent — the most common cause of missing Go spans.- A background worker that outlives the request. You do not want the request’s cancellation, so you reach for
context.Background()and lose the trace with it. Use a detached context that keeps span linkage without the deadline. - A bare
&http.Client{}. Withoutotelhttp.NewTransport: no outbound span, notraceparentheader, and the downstream service starts a fresh trace. Make it a review rule. - Worker pools reading from a channel. The context that produced the item does not travel with it. Put span context in the struct you send, or accept the pool as a trace boundary.
This work is not optional and not fast: instrumenting a mid-sized Go service is days of engineering and a diff touching most function signatures. The teams unhappy with Go APM are the ones that expected the Node experience and never budgeted the time.
pprof and continuous profiling close the gap eBPF leaves
Go ships the best profiling story of any mainstream runtime and most teams use a fraction of it.
net/http/pprof gives you CPU, heap, allocation, goroutine, block and mutex profiles from a running process. Block and mutex profiling are off by default, enabled with runtime.SetBlockProfileRate and runtime.SetMutexProfileFraction — turn them on at least in staging, because contention is invisible in every other signal.
Two things make profiling an APM feature rather than a debugging ritual. Continuous profiling samples on a schedule, so the profile from the incident already exists instead of you attaching to a pod that has since been rescheduled. And pprof labels — wrapping work in pprof.Do — let you slice a CPU profile by endpoint or tenant, which is how platforms answer “which function burned the time in this slow span.” Spans for request shape plus profiles for what happened inside the code is the practical answer to Go’s missing auto-instrumentation.
The Go runtime metrics that actually matter
Generic container CPU and memory charts say little about a Go service. These do:
Goroutine count trend. A monotonically rising runtime.NumGoroutine() is a leak, full stop, and the goroutine profile grouped by creation stack names the culprit in a minute. Usual causes: a send on a channel nobody reads, a missing defer cancel(), a response body never closed, a time.Ticker never stopped. Alert on slope, not a threshold.
GC pause distribution and heap goal. Read these from runtime/metrics rather than runtime.ReadMemStats, which stops the world to collect. Pause percentiles matter more than the mean, and heap goal versus actual heap tells you whether GC is keeping up.
GOMEMLIMIT and GOMAXPROCS against the container. This is where Go services die in Kubernetes. Without GOMEMLIMIT the collector sizes its heap goal from GOGC and knows nothing about the cgroup limit, so the container is OOM-killed while the runtime thought it had room. And GOMAXPROCS defaults to visible cores, not your CPU quota, so a pod limited to one core may run sixteen scheduler contexts and pay for it in scheduling latency.
Needs first-hand data: For one Go service in Kubernetes, chart heap goal, actual heap and the cgroup memory limit together before and after setting
GOMEMLIMIT, and record OOM-kill frequency in each.
OpenTelemetry: the standard underneath, not a product
OpenTelemetry is not one of the tools below. It is the instrumentation standard — SDKs, semantic conventions and the collector — that every product in this article consumes. It has no dashboard, no alerting, no on-call rotation and no bill, so ranking it against Datadog or Grafana is a category error: you do not choose it instead of a backend, you choose it underneath one. What the choice does decide is how expensive leaving is later, which in Go matters more than anywhere else because the instrumentation is hand-written.
It is the default starting point for Go, because in this language the manual instrumentation you write is the expensive artifact and a vendor-neutral SDK is what keeps those days portable. You get contrib wrappers — otelhttp.NewHandler, otelhttp.NewTransport, otelgrpc interceptors, an instrumented database/sql driver — plus otel.Tracer(...).Start(ctx, ...) for your own boundaries, and the propagation is plain context.Context with nothing hidden. Its Go auto-instrumentation project also gives you the eBPF path, so both strategies come from the same ecosystem.
What it gives you
- Works identically on a stripped binary, because manual spans are compiled in rather than discovered from DWARF symbols at runtime
- Trace depth is bounded only by how far you thread
context.Context, including inside pure-compute code eBPF can never see - No privileged DaemonSet, no kernel version floor, no
CAP_BPF— it runs anywhere your binary runs - The instrumentation diff, which is the multi-day cost, transfers to any OTLP backend unchanged
What it does not do
- Instrumenting a mid-sized Go service is days of work and a diff touching most function signatures
- Every uninstrumented
&http.Client{}and everygo doWork()without the context is a silent hole with no error to alert on - It stores nothing and shows nothing — no UI, no alerting, no retention. You still choose, run or pay for a backend to receive the OTLP
- It is free of licence cost but not free: the bill is engineering time to instrument, plus whatever collector infrastructure you operate, plus the backend
groundcover
groundcover is eBPF-first: it attaches uprobes to your running Go binaries and reads request data out of memory, so no service needs a code change to appear on a service map. Because Go statically links its own TLS implementation, the agent can probe crypto/tls read and write paths and see plaintext HTTP without terminating anything. It keeps data in your own infrastructure rather than a vendor cloud and prices by node rather than data volume, which suits a large fleet where per-gigabyte ingest is the thing that kills the budget.
Pros
- Zero code change and zero
context.Contextwork to get service maps and latency on services nobody has time to instrument - Sees encrypted traffic in plaintext by probing Go’s statically linked TLS, with no sidecar proxy in the request path
- Node-based pricing decouples cost from span volume, which matters for chatty Go services
- Data stays in your own infrastructure, which removes an entire class of data-residency argument
Cons
- A release build stripped with
-ldflags="-s -w"removes the DWARF information the uprobes need, and most Go images are built exactly that way — you must un-strip to use it - Coverage stops at network boundaries: you see that
POST /orderstook 800ms, not that 600ms of it was an in-process pricing calculation - Requires a privileged DaemonSet,
CAP_BPFor root, and a kernel new enough for CO-RE and BTF - Reading the goroutine
gstructure couples it to Go runtime internals, so a Go release can break it
Best for: Platform teams running a large Go fleet across many owners, who can allow a privileged DaemonSet and change build flags to keep symbols.
Pricing: Node-based subscription rather than per-gigabyte ingest, with the storage running in your own infrastructure so data volume affects your costs rather than the invoice.
Datadog

Datadog has the most complete Go product: contrib packages across the common libraries, a build-time weaving tool that rewrites source via -toolexec to cut the manual wiring, a profiler with span correlation, and Go runtime metrics out of the box. The weaving path is the closest thing Go has to the auto-instrumentation other runtimes take for granted, and it is a compile-time transform rather than a runtime hook — which means it works on a stripped binary but changes your build pipeline. The trade is a proprietary tracer in your dependency graph and a multi-meter bill; the alternatives guide covers the exits.
Pros
- Build-time weaving covers common libraries without hand-wiring every handler, transport and driver
- Unaffected by stripped binaries, since instrumentation is compiled in rather than read from DWARF at runtime
- Continuous profiler correlates to the open span, which recovers the in-process time eBPF cannot show
- Go runtime metrics — goroutine count, GC pauses, heap goal — arrive without you wiring
runtime/metricsyourself
Cons
- The weaving tool modifies your build pipeline, which is a meaningful ask in a regulated or reproducible-build environment
- A proprietary tracer sits in your
go.mod, so leaving means redoing the contrib wiring against another SDK - Per-host pricing plus separate meters for spans, profiles and custom metrics gets expensive across a large Go fleet
- Manual spans still needed for your own business logic; weaving covers libraries, not your pricing calculation
Best for: Go teams that want library-level coverage without the full manual wiring project and can accept a modified build plus a proprietary tracer dependency.
Pricing: Per-host subscription with independent meters for indexed spans, profiling, custom metrics and log ingest and retention; annual commitment discounts apply and any single meter can dominate the bill.
Grafana
Grafana fits teams already running Prometheus, which describes a large share of Go shops. Go exposes Prometheus metrics natively, so goroutine count, GC pause distribution and heap goal versus GOMEMLIMIT are already in a format the stack ingests. Pyroscope handles continuous profiling — the substitute for the auto-instrumentation Go cannot have — Tempo handles traces from the OTel Go SDK, and Grafana’s own eBPF instrumentation covers services nobody has time to instrument. Self-hosting means operating several systems — see the self-hosted stacks comparison.
Pros
- Go runtime metrics are natively Prometheus-shaped, so the
GOMEMLIMITversus cgroup-limit chart is a straightforward query, not an integration project - Pyroscope continuous profiling with pprof labels lets you slice CPU by endpoint or tenant, filling the gap eBPF leaves inside the process
- Offers both paths in one stack: eBPF for unowned services, OTel SDK spans for the ones you instrument properly
- Traces are plain OTLP, so the expensive
context.Contextwork stays portable
Cons
- The eBPF path carries the same stripped-binary and privileged-DaemonSet constraints as any other uprobe-based agent
- Self-hosting is several systems — metrics, logs, traces, profiles — each with its own scaling and retention behaviour
- Trace-to-profile correlation needs deliberate wiring rather than working out of the box
Best for: Go teams already fluent in Prometheus and PromQL who want runtime metrics, continuous profiling and traces in one stack they can self-host.
Pricing: Usage-based metering per signal type — metric series, logs, traces, profiles — in the managed cloud with committed-use discounts; self-hosting swaps that for infrastructure and operator time.
SigNoz
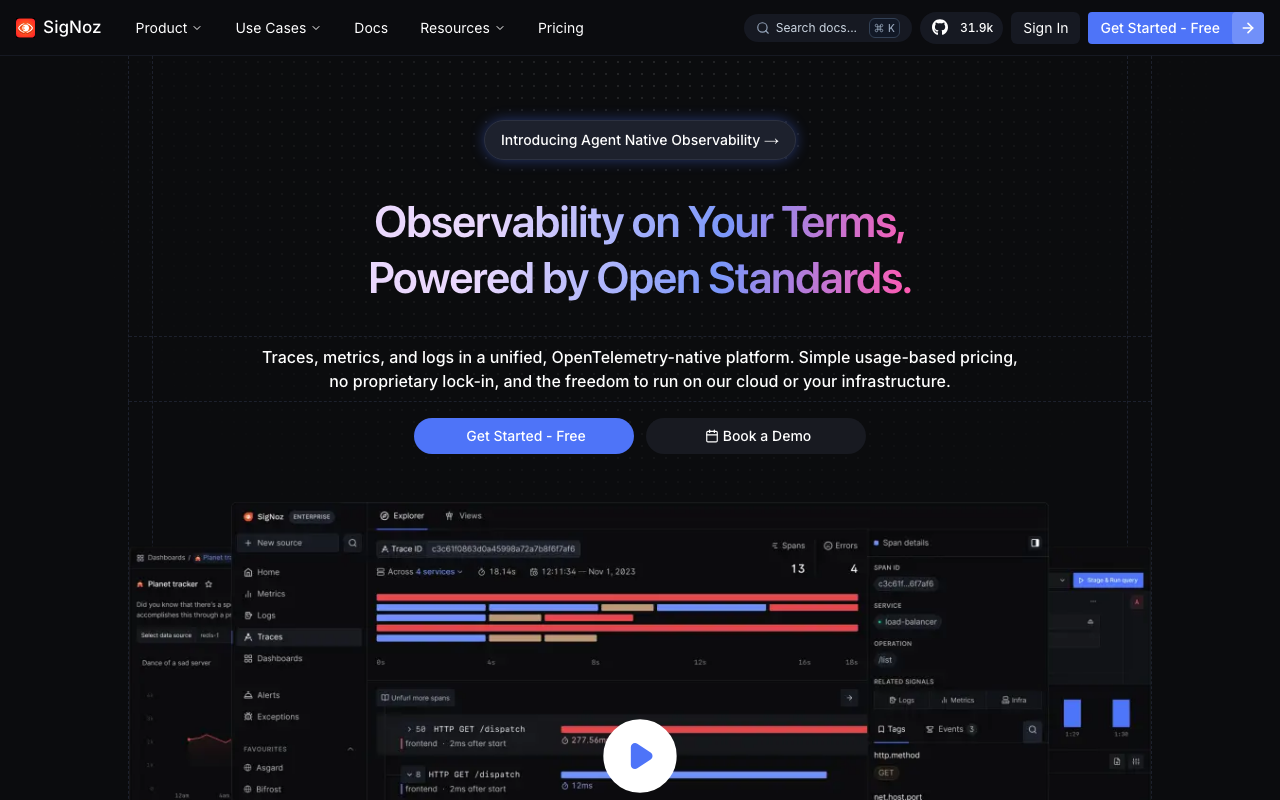
SigNoz takes OTLP from the standard Go SDK into ClickHouse, self-hosted or cloud, with traces, metrics and logs together. There is no proprietary tracer to add to go.mod and no agent to deploy privileged, so the contract is simple: you do the context.Context work with upstream OpenTelemetry, and SigNoz stores and queries the result. That makes it a low-friction destination for a team that has already accepted manual instrumentation as the price of doing Go.
Pros
- Nothing vendor-specific in your Go binary, so a stripped release build is irrelevant and no build flags change
- The manual instrumentation diff — the genuinely expensive artifact in Go — remains portable to any other OTLP backend
- ClickHouse handles high-cardinality span attributes, so per-tenant or per-endpoint dimensions stay affordable
- Self-hostable, which avoids both the privileged DaemonSet of eBPF tools and the data-egress question
Cons
- No eBPF path of its own, so services nobody will instrument stay invisible
- No built-in continuous profiling, leaving the in-process blind spot to a separate tool
- Self-hosted ClickHouse becomes real operational work as span volume grows
Best for: Go teams committed to manual OTel instrumentation who want a single self-hostable store for traces, metrics and logs without adopting any vendor agent.
Pricing: Open source and self-hostable at infrastructure cost, plus a managed cloud metered on data ingested and retention period rather than per host.
Honeycomb
Honeycomb is the outlier here and worth taking seriously for Go specifically. Its model is wide, high-cardinality events rather than pre-aggregated metrics: put tenant ID, region, flag state, queue depth and goroutine count on a span and ask questions you did not plan for. That costs almost nothing extra in Go, because you are already writing spans by hand — adding six attributes to a span you were creating anyway is one line. It beats dashboards decisively for “which requests are slow and what do they have in common,” and does less if you also need infrastructure monitoring.
Pros
- High-cardinality attributes are the point, not an expensive exception, which suits hand-written Go spans where adding fields is trivial
- Ad hoc querying finds the shared attribute behind a slow tail without a dashboard existing for it beforehand
- Pure OTLP ingest, so the Go SDK wiring is standard and transferable
- Works on stripped binaries and needs no privileged agent, since everything comes from spans your code emits
Cons
- No eBPF fallback: a service nobody instruments produces nothing at all
- Weak as an infrastructure monitoring tool, so most teams still run something else for host and cluster metrics
- Go runtime metrics like GC pause distribution and heap goal are a poorer fit for an event-shaped store than for a time-series one
Best for: Go teams already writing rich manual spans who debug by exploration — slicing by tenant, region or flag — rather than by watching pre-built dashboards.
Pricing: Event-volume-based pricing on the number of spans ingested with retention tiers, rather than per host or per user, so cost tracks sampling policy more than fleet size.
How to choose
Start with one question: can you get engineers to change code?
If yes — a small number of services with clear owners — go manual with the OpenTelemetry Go SDK. Instrument one service end to end, goroutines and outbound clients included, and time it honestly. That number times your service count is the real project cost.
If no — a large fleet, many owners, services nobody wants to touch — start with eBPF for coverage, after verifying that your builds keep symbols and your clusters allow privileged DaemonSets.
Either way, turn on continuous profiling early; in Go it substitutes for the auto-instrumentation you cannot have. Then pick the backend on storage economics and query model, since by then your instrumentation is portable — the APM tools hub and the OpenTelemetry-native roundup cover that.
Frequently asked questions
Is there real auto-instrumentation for Go?
Only through eBPF or build-time source rewriting, and neither equals what Java and Node agents do. eBPF sees network boundaries without touching code; weaving gets closer to library-level coverage but changes your build. Neither instruments your business logic.
Why are my Go spans missing when the request clearly ran?
Almost always context: a goroutine launched without the request context, a function that takes no context, or an http.Client without an instrumented transport. Trace the context path by hand and you will find the break.
How do I find a goroutine leak in production?
Chart runtime.NumGoroutine() per pod and alert on a sustained upward slope rather than an absolute number. When it fires, pull the goroutine profile and group by creation stack — the leaking call site is usually the top entry with hundreds of identical frames.
Related reading
- Best APM tools for developers — the landscape and how pricing models differ.
- Best OpenTelemetry-native observability platforms — where to send OTLP once your instrumentation exists.
- Best APM for Kubernetes workloads — the eBPF DaemonSet story and per-pod cost.
- Best open source APM and observability tools — self-run options for teams avoiding vendor agents.