Python APM fails in a recognisable way. You install the agent, restart gunicorn with --preload because someone put it in the config three years ago, and traces stop arriving. Or the Django request span looks fine and the Celery task it triggered is a separate root with no parent, so the thing you wanted to trace — user clicks button, job runs, email sends — is three disconnected traces you join by hand using a timestamp and hope.
None of that is a dashboard problem. It comes from how Python agents attach themselves (import hooks and sitecustomize), how Python servers run (pre-fork, threads, or an event loop), and how context travels (contextvars, which survive neither a fork in a thread nor a trip through a broker).
Django on gunicorn, FastAPI on uvicorn and Celery on Redis are three different instrumentation stories, and a tool that handles one well can be mediocre at the others.
Key takeaways
- WSGI instrumentation is solved. ASGI is harder, and quality varies most on background tasks, streaming responses and websockets.
- Pre-fork servers break agents that start an exporter thread before the fork. Initialize after the fork, or do not preload.
- Trace context does not cross a broker unless injected into task headers, and Celery retries and countdowns break it further.
- CPU percentage on a GIL-bound process is misleading: one saturated core on a four-core box reads as 25% while being your entire throughput ceiling.
WSGI is easy, ASGI is where tools differ
WSGI is one synchronous callable. An agent wraps it, opens a span on entry, closes it on return. Every tool gets this right for Django and Flask.
ASGI is three callables and a message stream: scope, receive, send. Instrumentation must interpret the messages — http.response.start carries the status, http.response.body with more_body: False marks the end. That is where implementations diverge:
- Streaming responses. End the span at
http.response.startand you record time to first byte and miss ten seconds of streaming. Agents choose differently here. - Background tasks. FastAPI and Starlette
BackgroundTasksrun after the response is sent. If the request span closes on response, that work is orphaned — and background tasks are where the slow, failure-prone code lives. - Sync endpoints in an async framework. A
defendpoint runs in a thread pool. Starlette’s helper copies the context across so tracing usually survives, but a rawloop.run_in_executorin your own code copies nocontextvarsat all and your spans vanish. - Websockets and lifespan. Plenty of agents ignore those scope types entirely.
The general rule: asyncio tasks copy context at creation, so create_task and gather propagate fine. Thread pools and manual executors do not, unless you call contextvars.copy_context().run(...) yourself. That distinction explains most missing-span reports in async Python.
Needs first-hand data: Record trace completeness for four FastAPI paths — plain async endpoint, sync
defendpoint, streaming response,BackgroundTasksjob — under each candidate, and note which agents end the span at first byte.
Worker models decide where the agent must initialize
Gunicorn’s default is pre-fork: a master forks N workers. Three facts matter more than any feature list.
Threads do not survive fork. Agents run a background thread to batch and export spans. If the agent starts in the master — which --preload guarantees — that thread exists in the parent and in no child, and workers queue spans nothing drains. The symptom is unmistakable: app healthy, memory creeping, no data.
The fix is per-worker initialization. Gunicorn’s post_fork hook exists for this and every mature agent documents it. Otherwise drop --preload and pay the memory.
Worker class changes everything else. sync workers handle one request at a time, so attribution is clean. gthread adds threads and the GIL story below. gevent and eventlet monkey-patch socket, ssl and threading, and that patch must happen before anything imports those modules — an agent that imports ssl during its own startup leaves two incompatible socket implementations in one process. Loud, confusing, and always an import-ordering problem.
Uvicorn under gunicorn is the common FastAPI setup. Same fork rules, plus each worker owns an event loop, so per-worker metrics must be tagged with the worker PID or you are averaging unrelated event loops.
Celery is where the trace breaks
Celery is a second instrumentation problem, and the one teams most often leave half-finished.
Context must be injected into the task message at apply_async and extracted in the worker. OpenTelemetry’s Celery instrumentation hooks the publish and prerun signals and puts the W3C traceparent into message headers; vendor agents do the equivalent. Instrument both sides and you get one trace spanning web request and background job. Four things still break it:
- An uninstrumented producer. A management command or cron container enqueues with no headers, and the task span becomes a root.
countdownandeta. A task scheduled six hours out, linked to its parent, produces a six-hour trace — and the sampling decision was made six hours ago. Treating delayed tasks as new roots with a link back is usually more useful.- Retries. Each retry is a new execution, and whether it joins the original trace changes what your error rate means.
- The prefork pool. Celery forks workers exactly like gunicorn. Use
worker_process_init.
Django ORM visibility and finding the N+1
Database instrumentation hooks the DB-API cursor — agents wrap execute and executemany, so every ORM query becomes a span regardless of how it was generated. Complete coverage, one problem: a page with an N+1 produces a trace with 300 near-identical spans, and the trace view is unreadable.
What you want is the aggregation on top: group spans by normalized query within a trace, report “this statement ran 247 times in one request,” and give you a stack frame so you can find the template loop or serializer behind it. Some platforms surface that as a finding; others render 300 bars and leave you counting.
Two related checks. Query normalization must strip literal values, or span names become unique per request and cardinality explodes — expensive on any usage-priced backend. And because querysets are lazy, the query span appears where the queryset is consumed, so its parent is the template render rather than the view.
The GIL makes CPU metrics lie
A CPython process running Python bytecode executes on one core at a time. A gthread worker with eight threads, fully saturated, shows roughly one core of CPU — on a four-core container that reads as 25% utilization while the process is out of throughput.
So do not alert on container CPU for Python web workers. Alert on request queue depth, worker busy time and p99 latency. If you must use CPU, compute it per core and know your ceiling.
The corollary for profiling: a sampling profiler that needs the GIL only samples while Python runs, so it is blind to time inside native extensions that released it. Recent free-threaded CPython builds change this picture, but almost nothing in production runs them yet.
Needs first-hand data: Take one Django endpoint that is CPU-heavy in pure Python and one that spends its time in a C extension, and compare container CPU, per-core CPU and each candidate’s flame graph to show where the GIL distorts the reading.
Auto-instrumentation versus wiring it yourself
Python’s zero-code path works through interpreter startup. opentelemetry-instrument sets PYTHONPATH to a directory containing a sitecustomize.py, which CPython imports automatically; that module installs import hooks so supported libraries get patched as they load. Datadog’s ddtrace-run does the same job differently.
Three sharp edges. A project shipping its own sitecustomize.py gets confusing shadowing. Instrumentation packages declare supported version ranges and silently no-op when you upgrade past them — no error, just missing spans, the worst possible failure mode. And opentelemetry-bootstrap installs based on what is in the environment right now, so a dependency added later has none until you rerun it.
Explicit setup — DjangoInstrumentor().instrument() in your app config — is more code and far easier to debug. On any service that matters, take the explicit version.
OpenTelemetry: the standard underneath, not a product
OpenTelemetry is not one of the tools below. It is the instrumentation standard — SDKs, semantic conventions and the collector — that the products in this article consume. It has no dashboard, no alerting and no bill, so judging it against Datadog or Sentry is a category error: you do not adopt it instead of a backend, you adopt it underneath one. What that choice does decide is how much of your work survives when you leave whichever backend you picked.
It is the instrumentation layer under most of what follows. It is where opentelemetry-instrument, the sitecustomize.py trick, the Celery publish and prerun hooks and the contextvars-based context manager actually live — so understanding it is understanding why Python agents break at fork, at the broker and at the thread pool. Using it directly makes switching backends an exporter config change rather than a re-instrumentation project, in exchange for owning collector operation and version-range maintenance.
What it gives you
- Fork safety is entirely in your hands: initialize the tracer provider in
post_forkorworker_process_initand the behaviour is deterministic - Celery propagation uses documented signals, so an orphaned task root is debuggable rather than a vendor support ticket
- Explicit instrumentation —
DjangoInstrumentor().instrument()— replaces startup magic with code you can read and step through - Everything you write is portable across every OTLP backend in this list
What it does not do
- No backend, no UI, no storage; you still choose and pay for one of the products below
- Instrumentation packages declare version ranges and silently no-op past them, which is the worst failure mode in Python observability
- You operate the collector and own the sampling policy, including the decision about whether delayed Celery tasks join their parent trace
- It has no licence cost and is still not free: you pay in collector infrastructure, instrumentation maintenance time, and whichever backend receives the data
Datadog

Datadog has the broadest Python library coverage and the tightest trace-profile-log integration. Its agent attaches through ddtrace-run, which sets up import hooks at interpreter startup in the same way opentelemetry-instrument does, and it documents the gunicorn post_fork pattern explicitly rather than leaving you to discover it. The profiler correlates a profile with the span that was open when it was taken, which is how you find the CPU-bound function inside a slow Django view without adding a span for every helper. The trade is many meters on the bill and a proprietary agent in your dependency graph — see Datadog alternatives.
Pros
- Documented
post_forkinitialization means a gunicorn--preloaddeployment can be fixed by configuration rather than by guessing - Broad instrumentation coverage across Django, Flask, FastAPI, Celery, SQLAlchemy and the common drivers, including both WSGI and ASGI paths
- Profile-to-span correlation identifies the pure-Python function burning a core while container CPU still reads low because of the GIL
- Celery producer and consumer instrumentation is handled on both sides, so a web-request-to-task trace joins without manual header work
Cons
geventandeventletworker classes remain an import-ordering minefield; the agent must not importsslbefore monkey-patching runs- Proprietary instrumentation means your
post_forkwiring and Celery decorators do not transfer to another backend - Per-host pricing plus separate meters for spans, profiles and custom metrics is awkward for pre-fork deployments with many processes per host
Best for: Django or FastAPI teams with a mixed WSGI, ASGI and Celery estate who want the fork and propagation edge cases handled by the vendor.
Pricing: Per-host subscription with separate meters for indexed spans, profiling, custom metrics and log ingest and retention; annual commitments discount the base, and a single meter can dominate the total.
Elastic
Elastic is the pick when Django logs already live in Elasticsearch. Correlating an exception’s stack trace with the surrounding log lines from the same gunicorn worker — same index, same query — is its real strength, and it removes the tab-switching that dominates Python incident debugging. Its OpenTelemetry distribution lets you standardise instrumentation on OTel semantics without moving storage, so you can adopt the upstream Python SDK and keep Elasticsearch underneath.
Pros
- Exception stack traces sit next to the worker’s own log lines, which is the fastest path from a Django 500 to its cause
- OTel distribution means you can keep upstream Python instrumentation and
post_forkinitialization while staying on Elasticsearch - Handles both WSGI and ASGI frameworks, with the same agent covering Django and FastAPI deployments
- Self-managed deployment is a first-class option for teams that cannot send application data to a vendor cloud
Cons
- Operating Elasticsearch at trace volume is real work, and index lifecycle management never stops needing attention
- N+1 detection is weaker than the platforms that aggregate repeated queries into a single finding — you often get 300 spans and a scroll bar
- Little value if your logs are not already in Elasticsearch, since you would be adopting a search cluster to get an APM
Best for: Django teams whose application logs are already in Elasticsearch and who want traces and exceptions in the same store rather than a second vendor.
Pricing: Resource-based subscription tied to deployment compute and storage across feature tiers, self-managed or cloud, with separate cost for hot versus long-term retention.
SigNoz
SigNoz takes plain OTLP from the standard OpenTelemetry Python SDK into ClickHouse, with traces, metrics and logs in one store. Nothing proprietary sits in your application: the post_fork hook that creates the tracer provider, the Celery signal instrumentation that injects traceparent into task headers, and any explicit DjangoInstrumentor().instrument() calls are all upstream code. That means the expensive part of the work — getting a gunicorn plus Celery deployment to emit one connected trace — stays valid if you move.
Pros
- Survives a gunicorn preload fork exactly as well as your
post_forkwiring does, because the wiring is upstream OTel and fully under your control - Celery propagation is the documented OTel publish and prerun signal path, so its failure modes are inspectable rather than vendor-internal
- ClickHouse tolerates per-worker-PID dimensions on runtime metrics without punitive cardinality cost
- Self-hosting keeps Python application data inside your network, which some Django deployments legally require
Cons
- Instrumentation version ranges are your problem: an OTel package that silently no-ops after a Django or SQLAlchemy upgrade produces missing spans with no error
- Python continuous profiling is not built in, so GIL-distorted CPU still needs a separate profiler to diagnose
- Self-hosted ClickHouse is genuine operational load once span volume grows
Best for: Teams already committed to the OpenTelemetry Python SDK who want a backend that does not add a second instrumentation layer on top of their post_fork setup.
Pricing: Open source and self-hostable at infrastructure cost, plus a managed cloud metered on data ingested and retention period rather than per host.
Grafana
Grafana Cloud, or a self-run Mimir/Loki/Tempo stack, suits teams fluent in PromQL, with Pyroscope for continuous Python profiling. It ingests OTLP directly, so Python instrumentation is upstream OTel and your fork-safe initialization is unchanged. Pyroscope matters more here than in most runtimes: because the GIL makes container CPU read low on a saturated process, a continuous profile is often the only signal that tells you a worker is out of throughput. Self-hosting is several systems to operate — the self-hosted stacks guide covers the people-time.
Pros
- Continuous Python profiling answers the question container CPU cannot, given the GIL makes a saturated worker look 25% busy
- OTLP-native, so
post_forkinitialization and Celery header injection are upstream code with no vendor variant - High-cardinality metrics storage handles per-worker-PID series from a pre-fork gunicorn deployment
- Same stack covers infrastructure and application signals, so worker queue depth sits beside pod-level metrics
Cons
- Several systems to run and scale if you self-host, each with separate retention behaviour
- A sampling profiler still only samples while the GIL is held, so time inside native extensions stays under-represented no matter which backend you use
- Cloud pricing meters each signal separately, and a pre-fork fleet emitting per-PID series can grow metric counts quickly
Best for: Python teams already fluent in PromQL who need continuous profiling to see past the GIL’s distortion of CPU metrics.
Pricing: Usage-based metering per signal type — metric series, logs, traces, profiles — in the managed cloud with committed-use discounts; self-hosting swaps that for infrastructure plus operator time.
Uptrace
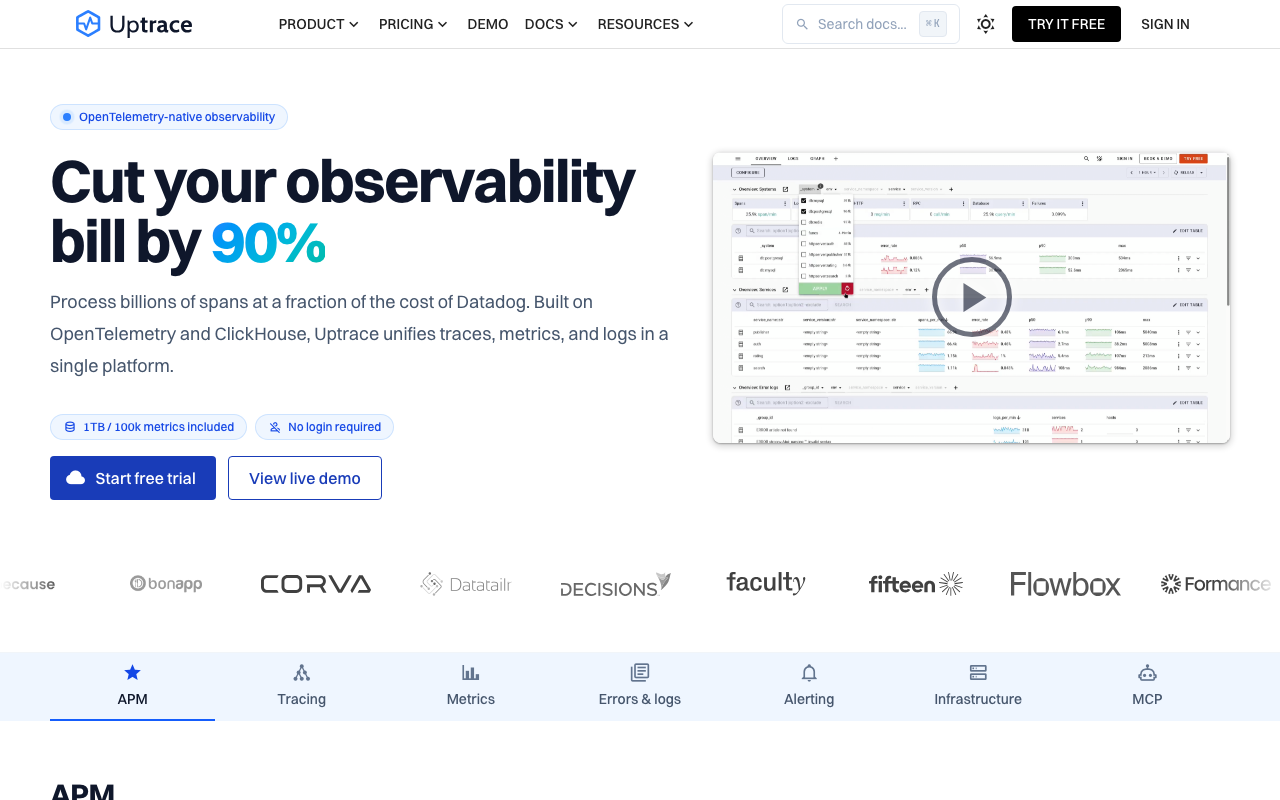
Uptrace is a smaller OpenTelemetry-native APM, also ClickHouse-backed, available self-hosted or as a cloud service. It takes OTLP from the standard Python SDK, so the same fork-safe initialization and Celery header injection apply unchanged. It is a reasonable middle option when you want OTel semantics and a straightforward trace and metrics UI without standing up a four-system stack or signing an enterprise contract.
Pros
- Pure OTLP ingestion, so gunicorn
post_forksetup and Celery propagation behave exactly as upstream OTel documents - Far less to operate than a self-run Mimir/Loki/Tempo stack while still being self-hostable
- ClickHouse backing keeps per-worker and normalized-query dimensions affordable
- Small enough surface area that the whole pipeline stays comprehensible to one engineer
Cons
- Smaller ecosystem and community than the major platforms, so Python-specific edge cases are more likely to be yours to debug
- No built-in Python profiling, which leaves the GIL blind spot uncovered
- Fewer opinionated findings — repeated-query detection and similar analysis are thinner than on the large platforms
Best for: Small Python teams that want an OTel-native backend with traces and metrics in one place and no appetite for operating a multi-system stack.
Pricing: Open-source self-hosted option at infrastructure cost, with a managed cloud priced on ingested data volume and retention rather than per host or per user.
New Relic
New Relic’s Python agent is mature, with long-standing Django, Flask, FastAPI and Celery support and documented handling of pre-fork servers. It attaches via a wrapper script or an explicit newrelic.agent.initialize() call, and like every Python agent it needs its exporter machinery created after the fork rather than in a preloaded master. Commercially it stands apart on shape: pricing combines ingested data volume with user seats rather than counting hosts, which changes the arithmetic sharply for pre-fork Python where a single host runs many worker processes.
Pros
- Ingest-plus-users pricing does not multiply with worker process count, which fits pre-fork gunicorn and Celery deployments well
- Long-established Django and Celery instrumentation with documented guidance for pre-fork initialization
- Errors, traces and metrics land in one place, so a Celery task failure is one hop from the web request that enqueued it
- Accepts OTLP as well as its own agent, so an existing OTel Python setup can point at it without re-instrumentation
Cons
- Still requires correct post-fork initialization; a
--preloadconfig will break it the same way it breaks every other agent - Seat-based cost rises with how many engineers need access, which discourages giving the whole team visibility
- Using the proprietary agent rather than the OTLP path reintroduces the lock-in the OTel route avoids
Best for: Django or Celery shops running many worker processes per host, where per-host pricing is punitive and only part of the team needs full platform access.
Pricing: Combination of ingested data volume and per-user seats by access tier rather than per host; the model favours many processes on few hosts and penalises broad seat distribution.
Sentry
Sentry is not a full APM and should not be evaluated as one, but its Django and Celery integrations are the best-in-class answer to a different question: what broke, in which release, for which users. It captures exceptions with local variable values in the stack frame, groups them into issues, and tracks regression across releases. Its tracing support has grown enough to connect a Django request to the Celery task it enqueued, but the depth of database and runtime visibility is well short of the platforms above. Most teams run it alongside one of them rather than instead.
Pros
- Exception capture includes local variables per frame, which frequently makes a Django traceback self-explanatory without reproduction
- Release health and regression tracking tie a spike in errors to a specific deploy rather than to a time window
- Celery integration captures task failures and retries with the same grouping, so a flaky task is one issue rather than hundreds of events
- Setup is genuinely small — one SDK init — and it survives the fork question more simply than an exporter-thread-based agent
Cons
- Not a full APM: no meaningful runtime metrics, no GIL-aware CPU analysis, no continuous profiling depth to match the platforms above
- Database visibility is thin compared with cursor-level instrumentation, so it will not find your N+1 for you
- Running it alongside a full APM means two vendors, two bills and two places to look during an incident
Best for: Django and Celery teams who want deep exception context and release health, accepting that a second tool covers traces, runtime metrics and database visibility.
Pricing: Event- and volume-based subscription across separate quotas for errors, performance units, profiles and replays, with an open-source self-hosted option that trades the bill for operations.
How to choose
Do this against your real stack, not a demo app.
Stand up one Django service and one Celery worker with the plain OpenTelemetry Python SDK, initialized in post_fork, exporting to a local collector, and trigger a request that enqueues a task. If that does not produce one connected trace with upstream OTel, no vendor agent will fix it — find your own propagation gap first.
Then test each candidate on the four things that vary: does the ASGI span cover the whole streaming response, do background tasks attach, does the Celery task join the web trace, and does the tool flag repeated queries rather than just rendering them.
Last, check pricing against worker count. Pre-fork Python means many processes per host, which per-host pricing treats kindly and per-series pricing does not. The APM tools hub breaks those models down.
| Tool | Instrumentation | Fork-safe setup | Python profiling | Lock-in |
|---|---|---|---|---|
| Datadog | Proprietary agent | Documented post_fork | Built-in, span-correlated | High |
| Elastic | Own agent or OTel distro | Both paths | Limited | Medium |
| SigNoz | Upstream OTel SDK | Your post_fork code | Bring your own | Low |
| Grafana | OTel / Prometheus | Your post_fork code | Pyroscope | Low |
| Uptrace | Upstream OTel SDK | Your post_fork code | Bring your own | Low |
| New Relic | Own agent or OTLP | Documented, still required | Built-in | Medium |
| Sentry | Own SDK | Simple SDK init | Sampling profiler | Medium |
| OpenTelemetry SDK (standard, not a product) | You wire it | Entirely yours | Bring your own | None |
Frequently asked questions
Why do I get no traces when gunicorn runs with --preload?
The agent’s exporter thread was created in the master, and threads are not inherited across fork, so each worker queues spans nothing sends. Move initialization into gunicorn’s post_fork hook, or run without --preload.
How do I connect a Django request to the Celery task it triggers?
Trace context must be injected into task message headers at publish and extracted at prerun, which Celery instrumentation does through Celery’s signals. Both producer and worker must be instrumented — a cron container enqueuing without an agent always produces an orphan root.
Should I use opentelemetry-instrument or explicit instrumentation?
Auto-instrumentation is fine to start. For anything long-lived, explicit calls earn their extra lines, because a silent version-range mismatch in an auto-instrumentation package looks exactly like your app not being used.
Related reading
- Best APM tools for developers — the full landscape and how pricing models differ.
- Best OpenTelemetry-native observability platforms — backends that take OTLP without a proprietary agent.
- Best APM for Node.js applications — the same context-propagation problem in a different runtime.