Your synthetic checks are green and a customer just emailed to say the dashboard takes eight seconds to load. Both are true. The synthetic check runs from a datacenter on a fast connection with a warm CDN and no extensions; your customer is on a mid-range Android phone on hotel wifi with an ad blocker and forty tabs open.
Real user monitoring closes that gap. It instruments the actual browser session and gives you a distribution instead of a single lab number. It’s the only way to know whether your performance work helped anyone.
It also has an awkward property vendor pages skip: to measure how fast your page is, RUM adds JavaScript to the page. You make the page you’re speeding up marginally slower to find out how slow it is. Manageable, but pick a tool knowing it rather than discovering it in a Lighthouse report.
Key takeaways
- Field and lab data disagree for real reasons — device, network, cache state, extensions — and field data reflects your users.
- What your RUM tool reports and what Google uses to assess your site are different datasets. Treat them as correlated, not identical.
- The script’s weight and main-thread cost are a real budget line, and session replay costs far more than metrics collection.
- Check session replay masking defaults before you enable it, not after.
RUM versus synthetic: different jobs, both needed
Synthetic answers “is it up and did I regress.” RUM answers “what are people actually experiencing.” Neither substitutes for the other.
Synthetic checks are controlled and repeatable — same script, location, device profile, and network throttle every time. That control makes them useful for CI regression gates and availability alerting: a change in the number means a change in your code, not your traffic mix. It also makes them a poor proxy for reality. Nobody browses from a datacenter.
RUM is uncontrolled and representative. Your p75 moves when a campaign brings users from a different country on different devices — signal, not noise. But you can’t A/B a change against RUM in a five-minute loop, and you get no data for a page nobody has visited yet.
The split: synthetic for availability alerting and pre-deploy gates, RUM for prioritising fixes and proving they reached users. The uptime and synthetic monitoring guide covers the other half of the pairing.
What your RUM tool reports is not what Google uses
This causes more confusion in performance reviews than anything else in the category.
Google’s field assessment of Core Web Vitals comes from the Chrome User Experience Report — data from Chrome users who opted into usage statistics reporting, on eligible page loads. Your RUM tool collects from every browser your script runs in, including Safari and Firefox, from users who opted into nothing Chrome-related, using its own definitions of when a page view starts and ends.
So the numbers differ, sometimes substantially, and neither is wrong. Your RUM covers Safari traffic Google’s dataset doesn’t; the two sample differently; your tool counts SPA route changes as page views and Google’s largely doesn’t; and your script may not fire at all for users who bounce before it loads. That last one is the bias that matters — if your script loads late, the sessions it misses are disproportionately the slow ones, and your numbers look better than reality by construction.
Use your RUM tool for prioritisation and debugging, where relative comparisons and session detail matter. Use Google’s field data as the number of record when the conversation is about search. Don’t try to make them match.
Needs first-hand data: For one high-traffic page, record your RUM tool’s 75th-percentile LCP and INP alongside Google’s field numbers for the same period, split by device class. The size and direction of the gap for your site beats any general rule.
The script weight is the central irony
Every RUM tool adds a script, a listener set, and a beacon. All three cost something on the page you’re optimising. You are, unavoidably, making the page slightly slower in order to find out how slow it is.
Three costs. Transfer and parse: bytes over the wire plus JavaScript parse and compile, disproportionately expensive on low-end mobile — exactly the devices whose experience you most want to measure. Main-thread work: performance observers, error handlers, and batching logic share a thread with your app. And session replay: recording DOM mutations costs substantially more than collecting timing metrics, and on a mutation-heavy SPA it is not a rounding error.
The irony compounds. The heavier the script, the more it distorts the very measurement you installed it to take — and it distorts it most on the constrained devices where your real performance problems live. A tool that is cheap on a desktop developer machine can be meaningfully expensive on a low-end Android phone, which is the population whose p75 you actually care about.
You can’t eliminate this, only manage it. Load the script asynchronously so it never blocks rendering, accepting that you lose the earliest sessions. Sample replay far more aggressively than metrics. Check whether the vendor uses sendBeacon so reporting doesn’t contend with your own requests. Then measure the delta yourself, because it is specific to your pages and your users’ devices.
Needs first-hand data: Load your own page with the RUM script enabled and disabled, on a throttled mid-range mobile profile, and record the difference in total blocking time, script evaluation time, and transfer size. Repeat with session replay on and off — the two numbers are very different.
Sampling honesty
Every vendor samples. The question is whether they tell you clearly and whether you can control it.
Sampling is necessary — capturing every session from a high-traffic site produces volume nobody wants to pay for — but it interacts badly with percentiles. Sample uniformly at a low rate and your p50 is reliable while your p99 is thin, and p99 is exactly where your worst experiences live.
Ask: is the rate visible and configurable? Uniform random or head-based per session? Can metrics and replay sample at different rates? Are error and slow sessions exempt, so you keep the ones you’d investigate? Is the reported percentile computed from the sample or extrapolated? A vendor that answers clearly takes statistics seriously; one whose docs are vague is one where your p99 might be an artifact.
Session replay is the best and riskiest feature
Replay turns “checkout is broken for some users” into a video of it breaking. It’s also a system that records your users’ screens.
Default masking behaviour varies enormously and is the single most important thing to check. Some tools mask all text input by default and make you opt fields in. Some record text by default and make you opt sensitive fields out. The second posture eventually captures a password, a card number, or a medical record, because someone will ship a form without the right class attribute.
Checklist before enabling replay near production: default-deny masking; masking applied in the browser before transmission, not server-side after; ability to block whole DOM subtrees; documented behaviour for iframes and canvas; regional data residency; retention short enough for your compliance owner. Then record a session through signup and payment and watch it back.
This checklist applies identically to every tool below that offers replay. Vendor reputation does not substitute for checking the defaults on your own forms.
Bot and extension noise pollutes your percentiles
If you haven’t filtered bots, your tail latency is partly measuring crawlers.
Headless browsers, uptime checkers, SEO crawlers, and preview-link fetchers all execute JavaScript, which means they execute your RUM script — some on constrained infrastructure producing genuinely terrible timings. Extensions are the other half: an ad blocker rewriting the DOM, a password manager injecting fields, a shopping extension running everywhere, all showing up as main-thread work attributed to your page.
You can’t fully separate extension effects, and arguably shouldn’t — that’s a real user’s real experience. But you should be able to segment, so when INP regresses you can tell whether it moved for everyone or one cohort. Bots are different: not users, and they belong outside your percentiles entirely. Ask how each vendor identifies bots and whether the filter applies before or after billing — a tool that bills you for traffic it discards has an incentive problem.
Correlating a frontend session to a backend trace
This separates a RUM product from a standalone analytics script, and it’s the reason to prefer RUM attached to your APM.
The mechanism is simple: the RUM script attaches trace context to outgoing requests, your backend continues that trace, both sides share an ID. Done properly, you click a slow session and land on the server spans for that exact API call, database queries attached. Done improperly, you have two systems with two IDs and an engineer reconciling timestamps by hand.
Verify: does the SDK propagate W3C trace context by default or a proprietary header? Is CORS configured so the header survives cross-origin calls — the most common reason correlation silently fails? Does backend sampling respect the frontend decision, so you don’t land on a session whose trace was dropped? The OpenTelemetry-native platforms guide covers which backends handle this natively.
Datadog

Datadog RUM is strongest when correlation is your priority and you already run Datadog for backend APM. The frontend SDK propagates trace context that the backend agent continues, so clicking a slow session and landing on the server spans for that exact API call works with minimal configuration — both halves are one vendor, which removes the class of failures where two systems produce two IDs. It sits alongside the rest of the Datadog product surface, and is priced as its own product on top of everything else.
Pros
- Frontend-to-backend trace correlation works with minimal setup when the backend is already Datadog
- Session replay, error tracking, and performance metrics share one interface and one session model
- Segmentation across device, geography, browser, and custom attributes is strong for isolating regressions
- Bot and synthetic traffic filtering is available rather than something you build yourself
Cons
- Priced as a separate product on top of an already-modular bill, and session volume is its own meter
- The correlation advantage largely evaporates if your backend APM is not Datadog
- Proprietary throughout, so session data and dashboards don’t leave with you
Best for: Teams already running Datadog for backend APM whose primary question is “which backend call made this session slow.”
Pricing: Separate per-session meter for RUM, with session replay metered independently of metrics collection, layered on top of the per-host, per-product platform subscription.
Grafana Cloud
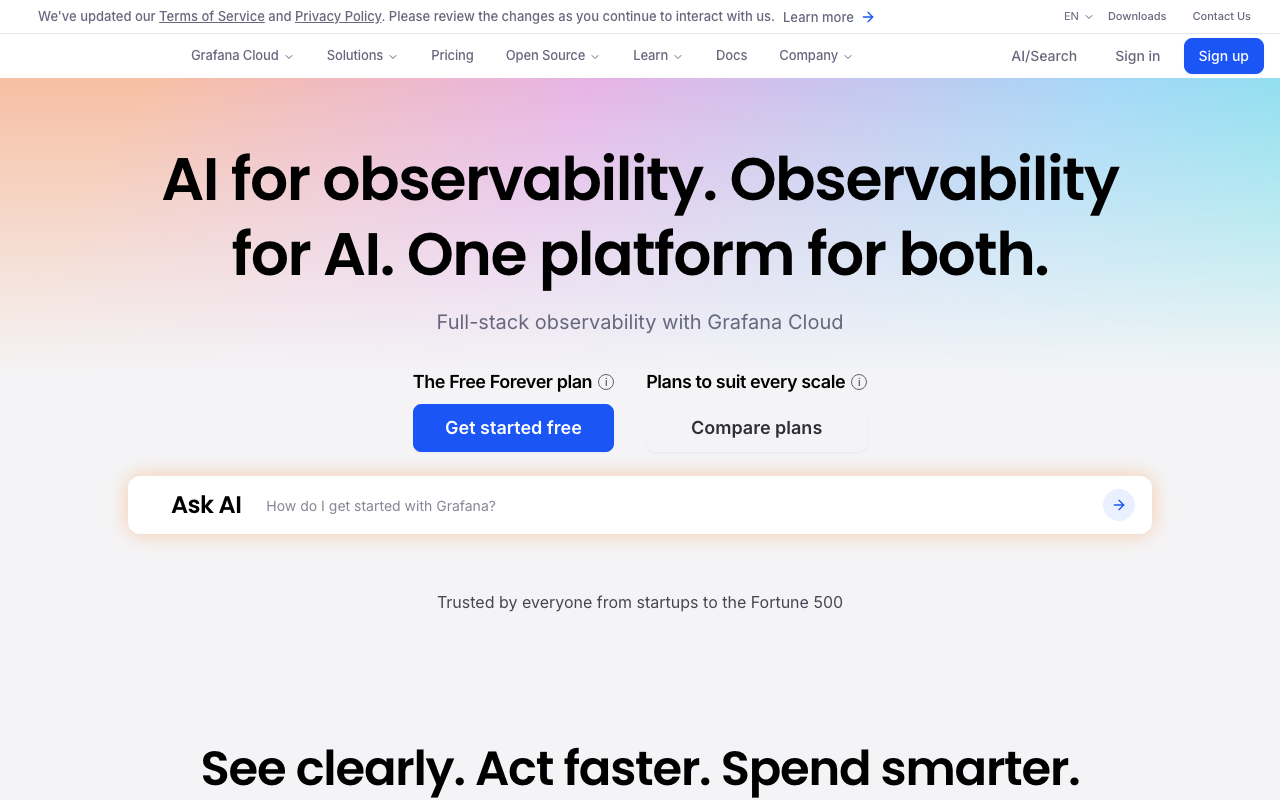
Grafana Cloud’s frontend observability feeds the same Loki and Tempo backends as your server telemetry, which means one query surface across the whole request on open-standards data. A frontend session and the server spans it triggered sit in the same trace store, queryable with the same language. It is more assembly than a turnkey product — you configure the collection, the correlation, and the dashboards — and in exchange nothing you build is trapped in a proprietary format.
Pros
- Frontend and backend telemetry land in the same open-standards backends, queried the same way
- Data and dashboards are portable and self-hostable along with the rest of the Grafana stack
- W3C trace context propagation aligns with OpenTelemetry rather than a proprietary header scheme
- No separate product silo for frontend data — it’s the same Loki and Tempo you already query
Cons
- Assembly required: correlation, dashboards, and sampling policy are all your configuration
- Replay and product-analytics depth trail the replay-first specialists significantly
- Needs a platform owner; unmaintained frontend dashboards decay like any other
Best for: Teams already running the Grafana stack for backend telemetry who want frontend data in the same open query surface.
Pricing: Usage-based on ingested frontend telemetry volume and retention within the wider Grafana Cloud meter, rather than a separate per-session product price.
LogRocket

LogRocket is the replay-first option, centred on session replay tied to product analytics and error context, and aimed as much at product and support teams as at engineers. If your use case is “show me what the user did before they complained,” it leads that framing rather than treating replay as a feature bolted to a metrics product. Console logs, network activity, and Redux-style state are captured alongside the DOM recording, which is what makes a replay actually debuggable rather than just watchable.
Pros
- Replay quality and surrounding context — console, network, state — are the product, not an add-on
- Genuinely usable by non-engineers, which shortens the support-to-engineering handoff
- Product analytics and error context in the same session timeline
- Strong at reproducing user-reported bugs that never surface in aggregate metrics
Cons
- DOM-recording replay is the heaviest form of frontend instrumentation, and this tool leans on it hardest
- Backend trace correlation is weaker than RUM attached to a full APM platform
- Session-based pricing means high-traffic sites sample aggressively or pay for volume
Best for: Product and support-driven teams whose main question is what the user did before they complained, not which backend span was slow.
Pricing: Per-session metering with replay retention as the main cost driver; higher-traffic sites control cost through sampling rather than through a lower unit rate.
Raygun

Raygun pairs RUM with crash reporting and per-session diagnostics — a sensible mid-market pick for teams who want real user data without adopting a full observability platform. It covers both web and mobile, ties frontend errors to the sessions they occurred in, and keeps the scope narrow enough that setup is short. It’s the option for teams who want the frontend answer without a platform migration attached to it.
Pros
- Focused scope means fast setup and a short learning curve
- Error and crash reporting integrated with performance data in one session view
- Covers mobile alongside web, which several RUM-only tools do not
- Mid-market positioning without enterprise procurement overhead
Cons
- Not a full observability platform, so backend correlation is limited compared with APM-attached RUM
- Smaller ecosystem and fewer integrations than the large platforms
- Replay and analytics depth trail the replay-first specialists
Best for: Mid-market teams that want real user data plus crash reporting without adopting a full observability platform.
Pricing: Volume-based on processed sessions and errors with retention tiers, priced independently of any host or seat count.
Elastic

Elastic offers RUM inside its APM stack, which matters if you already run Elasticsearch and want frontend data queryable next to your logs. The frontend agent feeds the same APM data model as your server instrumentation, so a browser transaction and the backend transactions it triggered are the same kind of document in the same cluster. Self-hostable, with the operational weight that implies — you are running Elasticsearch, and that is somebody’s job.
Pros
- Frontend data lands next to logs and backend APM in one searchable cluster
- Fully self-hostable, which satisfies data residency and regulatory constraints that most RUM vendors cannot
- Shared data model between browser and server transactions makes correlation a query rather than an integration
- No per-session vendor meter when self-hosted
Cons
- Elasticsearch operations — sizing, shards, upgrades — are an ongoing commitment
- Frontend-specific features like replay and product analytics are thin or absent
- Heavier to run than a hosted script-and-beacon product for the same outcome
Best for: Teams already running Elasticsearch that need frontend data in their own infrastructure for residency or compliance reasons.
Pricing: Included within Elastic’s subscription tiers based on deployment size and retention; self-managed shifts cost entirely to infrastructure and the people running it.
Dynatrace

Dynatrace folds RUM into its automatic dependency model, so a frontend problem lands in the same topology and root cause analysis as everything else. A slow browser interaction is not a separate dataset to correlate by hand — it’s an entity in the same map as the services and hosts behind it, and Davis reasons across the whole chain. That’s the enterprise answer, and it’s right precisely when automatic correlation across a large estate is the actual value rather than a nice-to-have.
Pros
- Frontend sessions become entities in the same topology as backend services, so root cause analysis spans the full request
- Davis causal analysis applies to frontend regressions rather than just infrastructure alerts
- Consistent instrumentation model across web, mobile, and backend
- Strong at large estates where nobody holds the whole dependency graph in their head
Cons
- Only worth it if you’re already committed to Dynatrace for backend monitoring; standalone it’s expensive complexity
- Enterprise procurement posture rather than a self-serve trial
- Consumption-unit billing for session data is another meter to model alongside host-hours
Best for: Enterprises already running Dynatrace whose value is automatic correlation from browser interaction to backend root cause across a large estate.
Pricing: Consumption units metered by session volume and session properties, layered on top of the host-hour platform meter.
Sentry
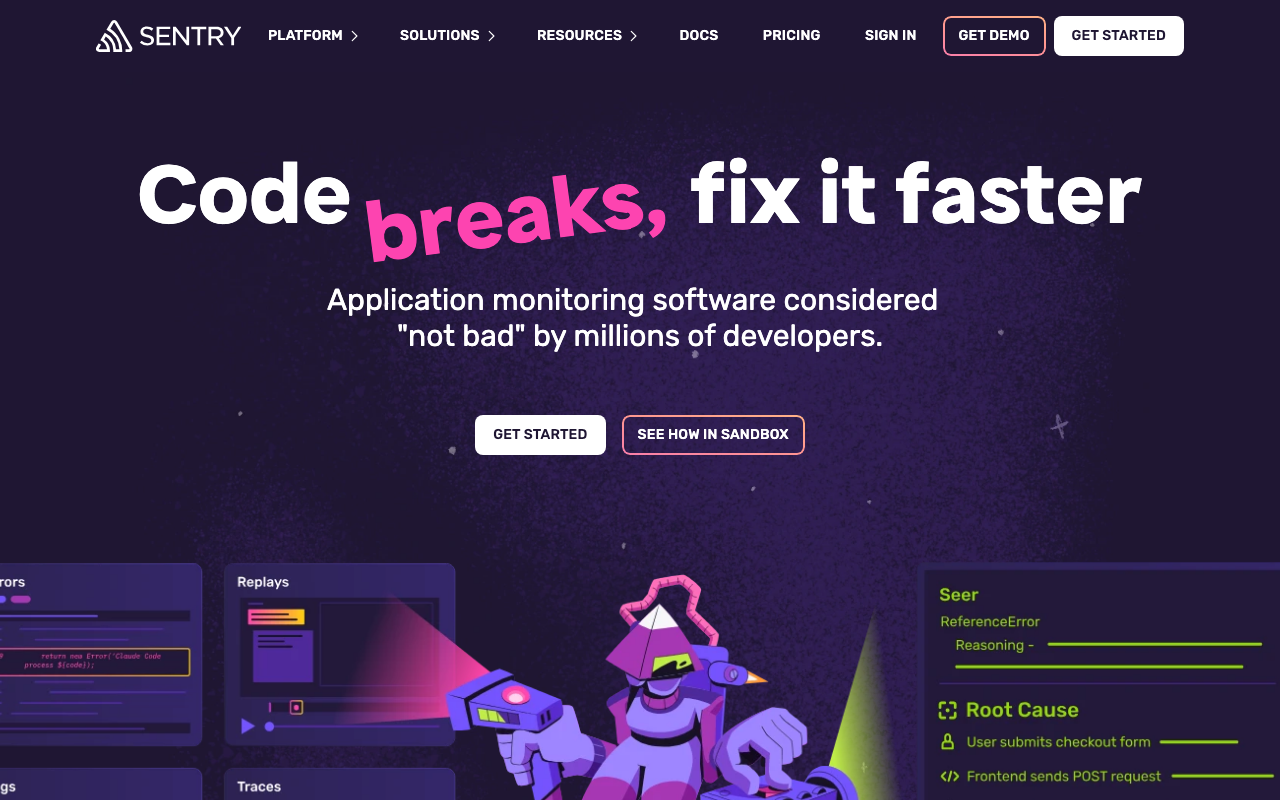
Sentry is worth a look particularly for teams whose entry point to frontend observability was error monitoring — its performance and replay features grew out of that lineage and fit naturally if your team already lives in error triage. The session, the error, the stack trace, and the replay are one object, which is a genuinely different starting point from tools that begin with timing metrics and add errors later. Trace context propagates through its own SDKs from browser to backend, giving usable correlation if both ends are Sentry.
Pros
- Error, stack trace, performance data, and replay converge on one issue object rather than three tools
- Already installed at many organizations, so frontend performance is an enablement step rather than a procurement
- Source map handling and release tracking are mature, which makes frontend stack traces actually readable
- Open source core with a self-host option
Cons
- Performance and RUM depth trail dedicated RUM products — it is an error tool that grew performance features
- Aggregate Core Web Vitals reporting is less developed than metrics-first tools
- Sampling and quota management need attention, since errors and performance events share the meter
Best for: Teams whose frontend workflow already centres on error triage and who want performance and replay attached to the issues they’re already working.
Pricing: Event-based quotas metered separately for errors, performance events, and replays, with retention tiers; self-hosting removes the vendor meter and adds operations.
FullStory

FullStory built its reputation on replay and analytics depth and is the category reference point for what a replay product can be. It captures a rich behavioural event stream alongside the DOM recording, which means you can query for a behaviour — rage clicks, dead clicks, a specific funnel drop — and then watch the sessions that match. That retroactive query capability is the differentiator: you don’t have to have instrumented the event before the behaviour happened.
Pros
- Retroactive behavioural search means you can investigate questions you hadn’t thought to instrument
- Replay fidelity and the surrounding analytics layer are the category benchmark
- Built for product, design, and support teams as much as for engineers
- Strong funnel and friction analysis alongside raw session viewing
Cons
- Analytics-first rather than performance-first: it’s not the tool for Core Web Vitals work
- Backend trace correlation is not the product, so slow-session-to-slow-span is a manual exercise
- Full DOM capture is heavy, and masking configuration deserves serious review before production use
Best for: Product and UX teams investigating behavioural questions and friction, where the question is why users struggled rather than what was slow.
Pricing: Session-volume-based with tiers by captured sessions and retention, priced as a product analytics tool rather than a performance meter.
Highlight.io
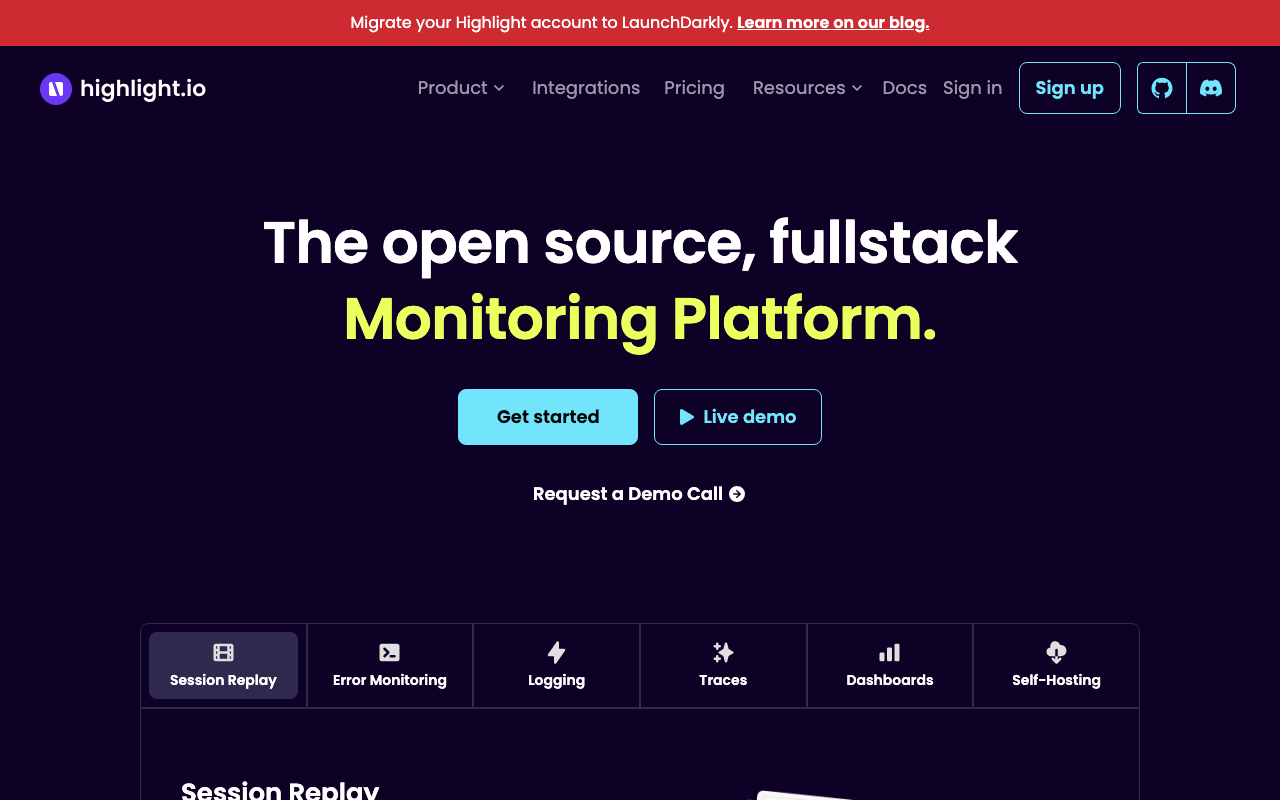
Read the status before you read the features: the hosted Highlight.io service was deprecated on February 28, 2026, and the product now lives inside LaunchDarkly Observability. Existing SDK snippets had to move to the LaunchDarkly client before March 1, 2026. The open-source project is still developed in the open, so this is now a self-host option, not a SaaS one.
What it does is pair session replay with error monitoring and backend logging in one project you run yourself. That combination matters for the correlation problem: because the same project holds the frontend session and the backend logs and traces, tying a replay to what the server was doing is a design property rather than an integration you build. Self-hosting also changes the replay privacy calculation, since recorded sessions never leave your infrastructure.
Pros
- Open source and self-hostable, which is unusual in a category where you’re shipping user screen recordings to a vendor
- Replay, error monitoring, and backend logs and traces in one project rather than three
- OpenTelemetry alignment on the backend side keeps server instrumentation portable
- Self-hosting keeps recorded session data inside your own compliance boundary
Cons
- The hosted service is gone — if you want someone else to run it, you are evaluating LaunchDarkly Observability, not Highlight.io
- A single-vendor open-source project whose vendor has moved on is a maintenance bet you are taking on deliberately
- Self-hosting a session-recording pipeline is real storage and operational work
- Analytics depth trails the dedicated replay-and-analytics products
Best for: Teams that will run replay themselves to keep user session recordings inside their own boundary, and are comfortable owning a self-hosted deployment.
Pricing: No hosted tier to price. Self-hosting converts the cost entirely into the storage, compute, and operator time you provision.
How to choose
Name your primary use case first — it eliminates most of the list immediately.
| Your primary question | What that points at | Where to start |
|---|---|---|
| Which backend call made this slow? | RUM attached to your existing APM | Datadog, Dynatrace, Grafana Cloud |
| What did the user do before they complained? | Replay-first, analytics-heavy tools | LogRocket, FullStory |
| Why is this error happening in the browser? | Error monitoring with replay attached | Sentry, Raygun |
| Can frontend data stay in our infrastructure? | Self-hostable options | Elastic, Grafana stack, self-hosted Highlight.io |
Then work through the disqualifiers in order.
- Name your primary use case in one sentence. “Debug user-reported bugs” points at replay-first tools; “improve Core Web Vitals” at metrics-first ones; “connect frontend slowness to backend causes” at whichever RUM sits next to your APM.
- Measure the script cost on your own page, with and without replay, on a throttled mobile profile. Blowing your performance budget eliminates a candidate on its own.
- Record a session through signup and payment and watch it back. Anything sensitive on screen is a hard stop.
- Verify trace correlation on a real cross-origin API call, not the demo app. CORS is where this breaks.
- Get sampling answers in writing: rate, method, exemptions for error and slow sessions, computed or extrapolated percentiles.
Frequently asked questions
Do I still need synthetic monitoring if I have RUM?
Yes. RUM cannot tell you a page is down, because a page nobody can load produces no beacons. Synthetic gives you availability alerting and a controlled baseline for catching regressions before users hit them.
Why don’t my RUM numbers match Google’s Core Web Vitals?
Different datasets. Google’s field assessment comes from Chrome users who opted into usage reporting; your RUM covers every browser your script runs in, uses its own page view definitions, samples differently, and misses users who leave before the script loads.
How much does the RUM script slow my site down?
Enough to measure, and much more with session replay than without. Metrics-only collection is usually a small cost; DOM-recording replay on a mutation-heavy application is not. Test it on a throttled mid-range device against your own pages.
Is session replay a compliance problem?
It can be, and masking defaults decide it. A tool that records text by default will eventually capture something it shouldn’t. Insist on default-deny masking applied in the browser before transmission, verify it against your own forms, and get privacy sign-off on retention first.
Related reading
- Best APM tools for developers — the full landscape and where each category fits.
- Best uptime and synthetic monitoring tools — the controlled half of the pairing.
- Datadog vs New Relic vs Dynatrace — how the big platforms differ on pricing model.
- Grafana Cloud vs Datadog — open standards versus managed polish.
- Best OpenTelemetry-native observability platforms — how trace context propagation should work end to end.