Log management gets bought during an incident and regretted at the next invoice. Both moments come from the same place.
The incident version: you have a request ID from a customer complaint and you want the twelve lines that request produced. Whether that takes two seconds or four minutes has almost nothing to do with the vendor’s UI and almost everything to do with what the store did with those lines when they arrived. The invoice version: someone left a debug statement inside a retry loop, a bot hammered an endpoint for six hours, and the bill for that month tracked the incident rather than your traffic.
Both trace back to one architectural decision that every vendor made before they wrote a price list: how much of each log line do you index at write time. Index everything and arbitrary search is fast while ingest and storage are expensive. Index almost nothing and ingest is cheap while search means decompressing and scanning. Store it in columns and aggregation is superb while full-text search becomes a different shape of problem.
So the useful order is architecture first, vendor second. The eleven products below sit on three storage designs, and once you know which one you need, most of the shortlist eliminates itself.
Key takeaways
- There are three log storage architectures — full inverted index, label index plus brute-force scan of compressed chunks, and columnar store with a query language. Pricing, query latency and cardinality limits all follow from which one you bought.
- Ingest-based pricing bills your worst day, not your average one. The month a debug line lands in a hot loop is the month you discover the shape of your contract.
- Cardinality is what breaks label-indexed systems: put a request ID in a label and cheap ingest becomes a stream explosion.
- Structured logging at the source is the cheapest performance improvement most teams have available, because it removes parsing work that every tier of the pipeline otherwise pays for repeatedly.
What you index at write time decides everything else
Every log store answers one question: when a line arrives, how much work do you do now so that a query later is fast? The three answers are genuinely different systems.
Full inverted index. Elasticsearch and Splunk build a posting list per term: for each token in each indexed field, a list of the documents containing it. A search for a stack trace fragment across a month of data becomes a set intersection over posting lists rather than a scan. The cost is paid twice. At ingest, analysis and tokenising are CPU-heavy, and segment merging keeps running after the write returns. At rest, the index sits beside the document, so total on-disk size is regularly larger than the raw logs you sent. You are pre-paying for queries you may never run.
Label index plus brute-force scan. Grafana Loki indexes only a small set of labels — namespace, app, pod, level — and never indexes the log body at all. Bodies are batched into compressed chunks in object storage. Ingest is close to free because there is barely any index to build, and storage is object-store pricing on compressed data. Queries work in two stages: the label selector picks the chunks, then those chunks are decompressed and filtered with a regex or substring match. Query cost is directly proportional to bytes scanned after selection. {app="checkout"} |= "timeout" over one hour is quick. {namespace=~".+"} |= "timeout" over a week is a distributed grep of your entire log volume, and it will cost you either time or a lot of parallel workers.
Columnar store with a real query language. ClickHouse stores each column separately, compressed and sorted by a primary key, with sparse skip indexes. Counting errors by endpoint across a billion rows touches two columns and finishes fast, and compression ratios on repetitive log fields are excellent, which is why storage is the cheapest of the three at the same retention. The costs are different in kind: you need to decide the schema up front, arbitrary text search over the message body is a scan or a token bloom filter rather than an inverted index, and somebody on your team has to be comfortable writing SQL against a table they designed.
The practical way to choose between them is to name the query you actually run under pressure:
- “Show me every line for this request ID.” All three do this well if the ID is indexed, a label, or the sort key. All three do it badly if it is buried in an unparsed message string.
- “Count 5xx by endpoint and customer over the last 30 days.” Columnar wins decisively. An inverted index can do it. Label-indexed storage will scan a month of chunks to answer it.
- “Find this exact exception text anywhere in the estate.” Inverted index wins decisively. This is the query that makes Loki expensive and ClickHouse awkward.
The full architectural comparison, including what breaks at 2am in each, is in Elasticsearch vs Loki vs ClickHouse.
Ingest pricing, retention tiers and the cardinality trap
Ingest-based pricing scales with your worst day. Most managed log products meter on gigabytes ingested, sometimes with a second meter for how many of those gigabytes get indexed and a third for how long they stay queryable. The trouble is that log volume is not a smooth function of traffic. An exception storm, a retry loop, a verbose third-party library upgraded without reading the changelog, a load test someone forgot to stop — each multiplies volume for hours or days. A budget built on the median month is a budget that fails during the incident it was bought for.
The defences are all upstream of the vendor: sampling repetitive lines, dropping health-check logs at the agent, routing debug output to cheap storage instead of the search index, and setting a hard quota per service so one team cannot spend another team’s budget.
Needs first-hand data: Chart daily log volume per service for three months and record the ratio of the peak day to the median day. That ratio, not the median, is what an ingest-priced contract charges you for. Do it before signing.
“Retention” and “searchable” are different words. Nearly every vendor now sells tiered retention: hot data queryable at full speed, then a cheaper archive. Read carefully what the cheap tier means. Sometimes it stays fully searchable at lower performance. Sometimes it means the data sits in your own object storage as compressed files and searching it requires a rehydration step measured in minutes to hours, which is fine for a compliance request and useless during an outage. Ask specifically: can I run the same query against 90-day-old data, and how long does the first result take?
Cardinality is what breaks label-based systems. In a label-indexed store, each unique combination of label values is a separate stream with its own chunk lifecycle. Add pod and you get one stream per pod — fine. Add user_id or request_id or a full URL path with IDs in it and you get millions of streams, each holding a few kilobytes, each with index overhead and its own flush. Ingest slows, memory climbs, and the system that was chosen for cheap ingest becomes the thing paging you. The rule is simple and worth writing into a review checklist: labels are for things you select on and there are few of, and everything else belongs in the log body where a filter expression can reach it.
Structured logging is the cheapest win available. If your services emit JSON with consistent field names, the pipeline stops guessing. No grok pattern to maintain, no regex that silently stops matching when someone changes a message string, no CPU burned re-parsing the same shape at three different tiers. It also makes the difference between “this field is a queryable dimension” and “this fact is inside a string somebody has to regex for.” Agreeing on a small set of field names across services — request ID, trace ID, service, level, tenant — costs a sprint and pays back permanently, whichever store you land on.
OpenTelemetry logs and OTLP: a specification, not a product
OpenTelemetry defines a log data model and OTLP defines the wire protocol for shipping it, and neither is something you buy, deploy as a destination, or point a query at. There is no OpenTelemetry log store, no dashboard, no retention setting and no bill. Ranking it against Datadog or Loki is a category error: it describes the shape of the record and how it travels, and every product below is a possible receiver.
What makes the log signal different from traces and metrics is that logs already existed. OpenTelemetry did not get to define the format from scratch, so its model is deliberately a superset with a body, a severity, a timestamp, attributes, and — the part that earns its keep — trace and span ID fields, so a log line can be joined to the request it belongs to.
What it gives you
- One agent and one protocol for logs, metrics and traces, so switching backends is a collector configuration change rather than an agent rollout
- A defined place for trace ID and span ID on every record, which is what makes “show me the logs for this slow span” a join rather than a text search
- Attribute semantics shared with traces and metrics, so
service.namemeans the same thing across all three signals - Portable instrumentation: application code emitting OTLP is not coupled to whoever stores the data this year
What it does not do
- It stores nothing and searches nothing. You still choose, run or pay for a backend
- It does not migrate your existing logs. Ten years of syslog, custom formats and grok patterns are converted by you, not by the specification
- Backend support for the log signal is uneven — plenty of platforms accept OTLP logs but map them onto an internal model that quietly loses structure
- It says nothing about cost. An OTLP pipeline pointed at an ingest-priced vendor produces the same invoice as any other pipeline
Platforms built to receive OTLP natively rather than translate it are covered in OpenTelemetry-native observability platforms.
Datadog Logs

Datadog splits the log bill in two: ingest, and indexing. Everything you send is ingested and can be archived or run through Live Tail and metric extraction, but only what matches an index filter becomes searchable at full speed for a retention window you choose per index. That split is the product’s central idea and the reason its logs pair naturally with its APM — a log line and the span it belongs to are one click apart when both carry the same trace ID.
Pros
- Logs, traces, metrics and profiles in one query surface, so pivoting from a slow span to its log lines needs no correlation work of your own
- The ingest-versus-index split lets you keep everything cheaply and pay search prices only for what you actually query
- Mature processing pipelines with parsers, remapping and sensitive-data scanning applied vendor-side rather than in your agents
Cons
- Multiple independent meters — ingest, indexed events, retention tier, archives, rehydration — make the bill hard to predict and easy to blow up
- Index filters are a governance job someone must own; without it teams either index everything or lose the line they needed
- Getting out is expensive in effort, because pipelines, parsers and monitors are Datadog-shaped
Best for: Teams already on Datadog APM who want log-to-trace correlation without building it, and who can staff index-filter governance.
Pricing: Separate meters for ingested gigabytes and indexed events, with indexed retention sold in tiers and archive rehydration billed on top; commitments discount the headline rates. Datadog alternatives covers the exits.
Splunk

Splunk is the incumbent for a reason: a full-text index over anything you send, a query language built for correlation across sources over long retention, and an ecosystem of apps for compliance reporting that no open source stack matches. It is also the tool people most often arrive here looking to leave, for two consistent reasons — the licence cost at real ingest volume, and the fact that SPL fluency tends to live in a few people while everyone else files tickets.
Pros
- Correlation search over years of retained data, including security use cases most operational log tools do not attempt
- Mature role-based access control and audit trails, which matters when auditors rather than engineers are the users
- A large app ecosystem covering compliance frameworks and vendor-specific data sources
Cons
- Cost at volume is the number one reason teams leave, and it grows with ingest rather than with the value of the data
- SPL is powerful and unlike anything else, so expertise concentrates and self-service dies
- Now owned by Cisco, which is a factor in a multi-year platform bet
Best for: Security and compliance-driven organisations that need long-retention correlation search and already have SPL expertise on staff.
Pricing: Historically ingest-volume licensing, with workload and entity-based options; the practical shape is that adding data sources adds cost directly. If that is why you are here, read Splunk alternatives.
Elastic
Elasticsearch is the reference implementation of the inverted-index approach, and Elastic’s platform wraps it in Kibana, ingest pipelines, alerting and a security product. Full-text search across arbitrary fields is genuinely fast, which is why it remains the default when the query you cannot predict is the one you need. The tradeoffs are the classic ones: mapping design matters, shard sizing matters, and JVM heap pressure is a real operational subject rather than a footnote.
Pros
- Fast arbitrary full-text search without knowing your query pattern in advance, which no other architecture here gives you
- Kibana, alerting, ingest pipelines and anomaly detection ship as one product rather than assembled parts
- Runs self-managed, on Elastic Cloud, or on a cloud provider’s managed service, so the deployment decision stays open
Cons
- Index and document together frequently exceed the size of the raw logs, so storage cost at long retention is the highest of the three architectures
- Mapping explosions from dynamic JSON fields are a real production failure, and shard sizing plus heap tuning are ongoing work
- The licence is SSPL and the Elastic Licence rather than Apache 2.0, which matters if you are building a product or a policy on top
Best for: Teams whose defining query is unpredictable full-text search and who can staff cluster operations or pay for the managed tier.
Pricing: Resource-based on the managed cloud — compute and storage per deployment tier rather than per ingested gigabyte — with self-managed costing infrastructure plus operator time.
Grafana Loki
Loki indexes labels and nothing else, keeping compressed log chunks in object storage and scanning them at query time. In Kubernetes that design fits perfectly, because the labels you would select on — namespace, app, pod, container — already exist and are already consistent. Ingest and storage costs drop sharply against an indexed store, and the price is that query performance is entirely a function of how narrow your label selector is.
Pros
- Cheapest ingest and storage of the mainstream options, because there is almost no index to build and chunks live in object storage
- Label model maps directly onto Kubernetes metadata, so log selection and Prometheus metric selection use the same mental model
- LogQL and PromQL share syntax, and Grafana puts logs beside metrics and traces in one dashboard
Cons
- A broad filter over a wide label selector is a distributed grep, and cost and latency scale with the bytes scanned
- Label cardinality is a hard operational constraint — a request ID in a label will take the cluster down, not just slow it
- Aggregation over long windows is weak compared with a columnar store, because there is no precomputed structure to lean on
Best for: Kubernetes teams already running Prometheus and Grafana whose queries almost always start with a narrow label selector.
Pricing: Open source and free to self-host on object storage; Grafana Cloud meters ingested gigabytes with retention tiers. See Grafana Cloud vs Datadog for the managed comparison.
ClickHouse
ClickHouse is not a log product, it is a columnar analytical database, and a growing number of log products are ClickHouse with a UI. Used directly it gives you the best storage economics of anything here, SQL your data people already know, and aggregation performance that makes 30-day questions routine. What you take on is schema design, ingestion plumbing, and the fact that free-text search across message bodies is a scan or a bloom filter rather than an inverted index.
Pros
- Column compression on repetitive log fields makes long retention affordable in a way the other architectures are not
- Aggregations over huge time spans — error rates by endpoint and tenant across a month — run fast enough to use interactively
- Plain SQL, so analysts and engineers can join logs against business tables without learning a bespoke query language
- No lock-in of a proprietary format; it is your table on your disks
Cons
- You design the schema, the sort key and the TTLs, and getting them wrong is expensive to correct at scale
- Text search across unstructured bodies is a fundamentally different operation from an inverted index, and heavy grep workloads feel it
- No UI, alerting or parsing out of the box unless you adopt one of the products built on top
Best for: Teams with SQL fluency and long retention requirements whose dominant queries are aggregations rather than free-text search.
Pricing: Open source with no licence cost self-hosted; ClickHouse Cloud meters compute and storage separately, which decouples retention cost from query cost.
Axiom
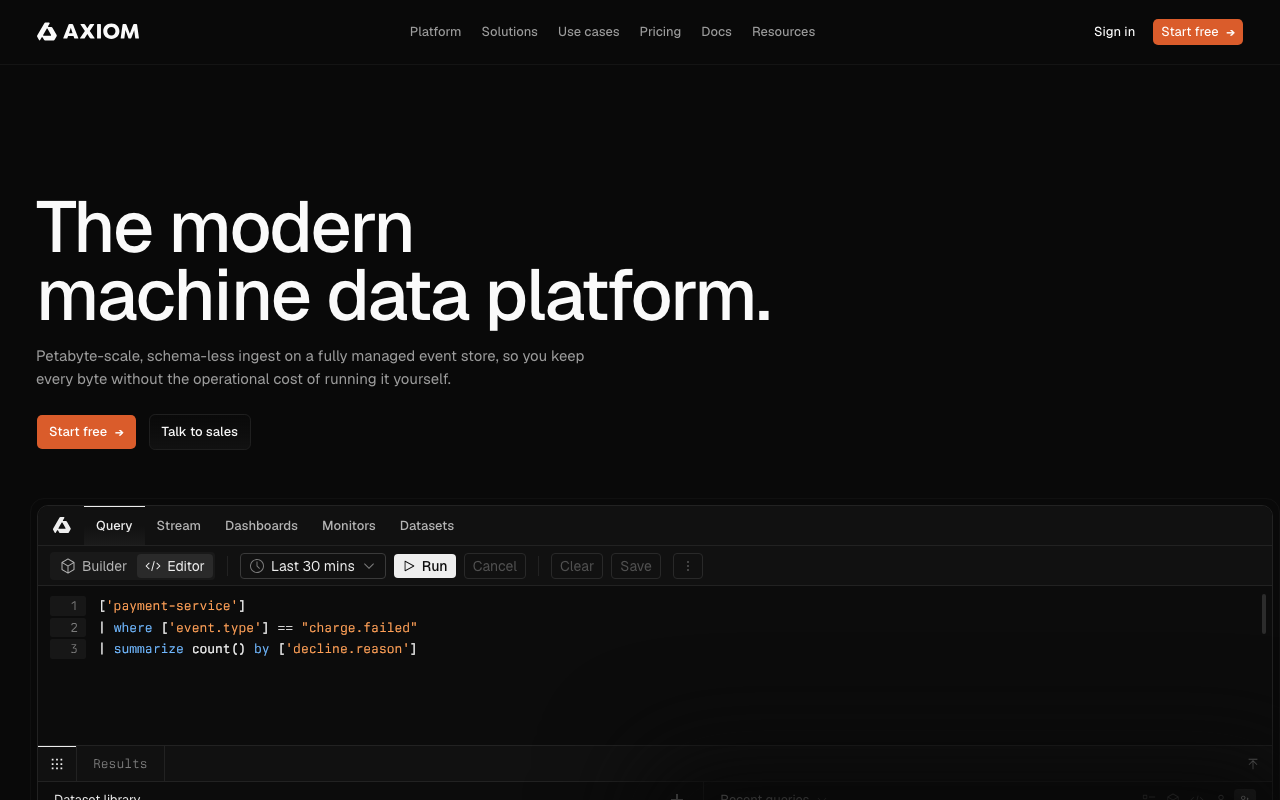
Axiom stores everything in object storage in a columnar format and queries it there, which removes the usual tradeoff where you decide at ingest time what deserves to be searchable. The pitch is that you keep all events at full fidelity rather than sampling to control an index bill, and query with a pipe-based language over the whole dataset.
Pros
- Object-storage-backed columnar design keeps long retention affordable without a separate archive tier to rehydrate from
- No ingest-time decision about what to index, which removes an entire category of “we dropped the field we needed” incidents
- Serverless operation — nothing to size, shard or tune on your side
Cons
- Query performance over object storage is a different profile from a hot local index, and heavy full-text patterns are not where it shines
- A younger ecosystem than Elastic or Splunk, so fewer prebuilt integrations and community answers
- Fully managed only, so data residency and air-gapped requirements rule it out
Best for: Teams that want everything retained and queryable without operating a store or governing index filters.
Pricing: Event-volume based with generous retention included rather than sold as separate hot and cold tiers.
Better Stack
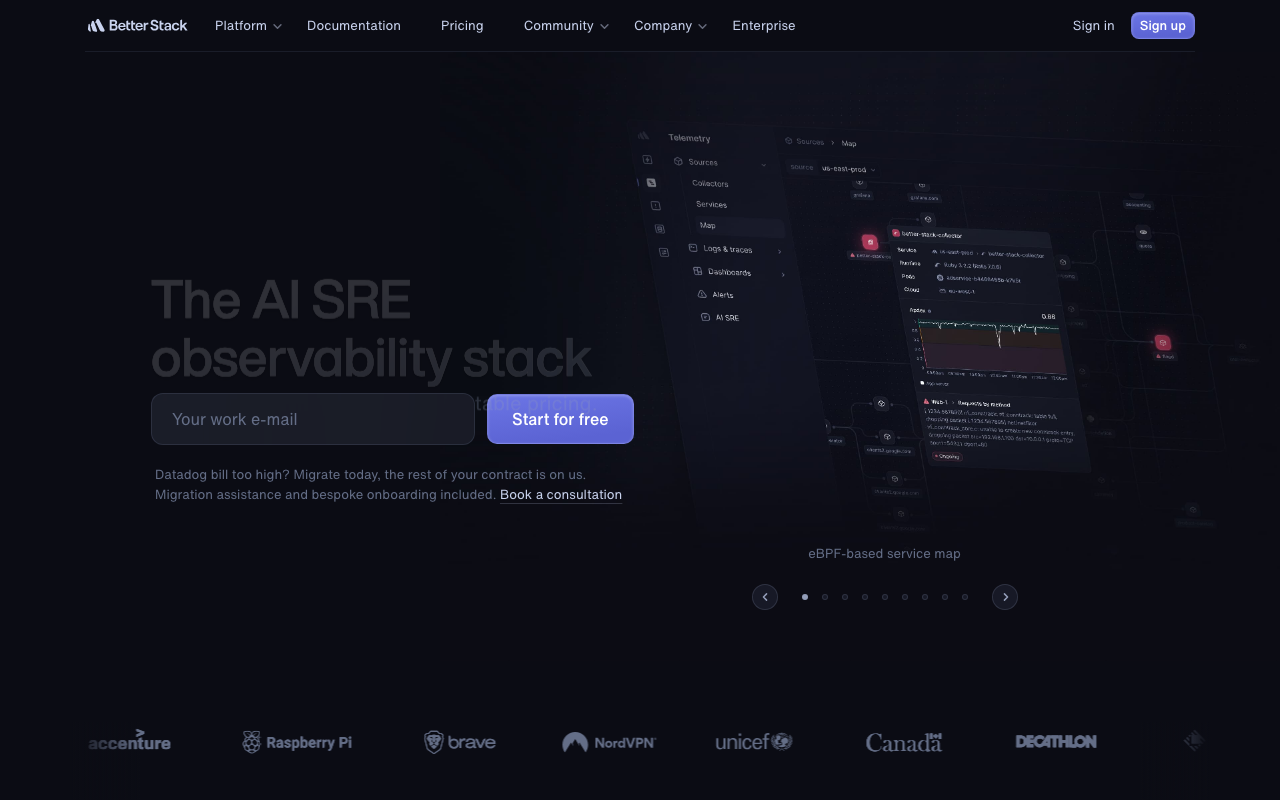
Better Stack bundles log management with uptime monitoring, incident alerting and status pages, backed by a ClickHouse-based store. For a small team that needs logs, alerts and an on-call rotation and does not want three contracts, the consolidation is the actual product. The log side is competent rather than deep; the value is that the log line, the alert and the incident live in one place.
Pros
- Logs, uptime checks, on-call alerting and a status page in one tool, which is a genuine reduction in vendor count
- ClickHouse-backed storage gives good aggregation and reasonable retention economics
- Fast to get useful, with sensible defaults rather than a configuration project
Cons
- Log analysis depth trails the specialists; complex correlation and long-retention forensics are not its strength
- Bundling means you inherit their opinion on alerting and status pages whether or not you wanted it
- Managed only, with no self-hosted path
Best for: Small and mid-sized teams that want logs, alerting and a status page from one vendor instead of three.
Pricing: Per-gigabyte ingest with retention tiers, plus seat-based pricing on the on-call and status page components.
Sumo Logic

Sumo Logic is a long-standing cloud-native log analytics platform that splits data into tiers by how you intend to use it — continuously searchable, occasionally searched, or kept for compliance — and prices accordingly. That tiering is the most explicit answer in this list to the “we cannot afford to index everything” problem, and it comes with a security-operations product sharing the same data.
Pros
- Explicit analytics tiers let you keep noisy data cheaply and pay search prices only on what you query often
- Both operational logging and security use cases run on the same ingested data, avoiding a second pipeline for the SIEM
- Long history as a managed service, with mature ingest, parsing and RBAC
Cons
- Tier decisions are made at ingest and moving data between them later is not free, so a wrong call persists
- The query language is another proprietary one to learn, with the same expertise-concentration risk as SPL
- Managed only, so self-hosting and air-gapped deployments are off the table
Best for: Organisations with both operational and security logging needs that want tiered cost control without running the store.
Pricing: Credit-based consumption across ingest, storage tier and search, so cost reflects both volume and how actively the data is queried.
Coralogix
Coralogix leads with the pipeline rather than the store: data is classified in-stream into tiers, so high-value logs get full indexing while noisy ones are kept as metrics, archived to your own object storage, or made searchable directly from that archive. The result is that cost is decoupled from volume by design rather than by you writing index filters after the bill arrives.
Pros
- In-stream tiering means the cost decision is made once in policy, not per query and not after the invoice
- Archives land in your own object storage bucket and remain queryable, so retention is your storage cost rather than a vendor retention tier
- Streaming analysis generates metrics and alerts from log data without indexing it first
Cons
- The tiering model is powerful and takes real configuration effort to get right; defaults will not save you
- Querying from archive is a different performance profile from the hot tier, and knowing which one you are hitting matters
- Smaller ecosystem and community than the incumbents, so more of the integration work is yours
Best for: Teams with high log volume and a hard cost ceiling who are willing to invest in pipeline policy to stay under it.
Pricing: Priced by data volume and the processing tier each stream is assigned, with archive storage in your own bucket rather than metered by the vendor.
Graylog
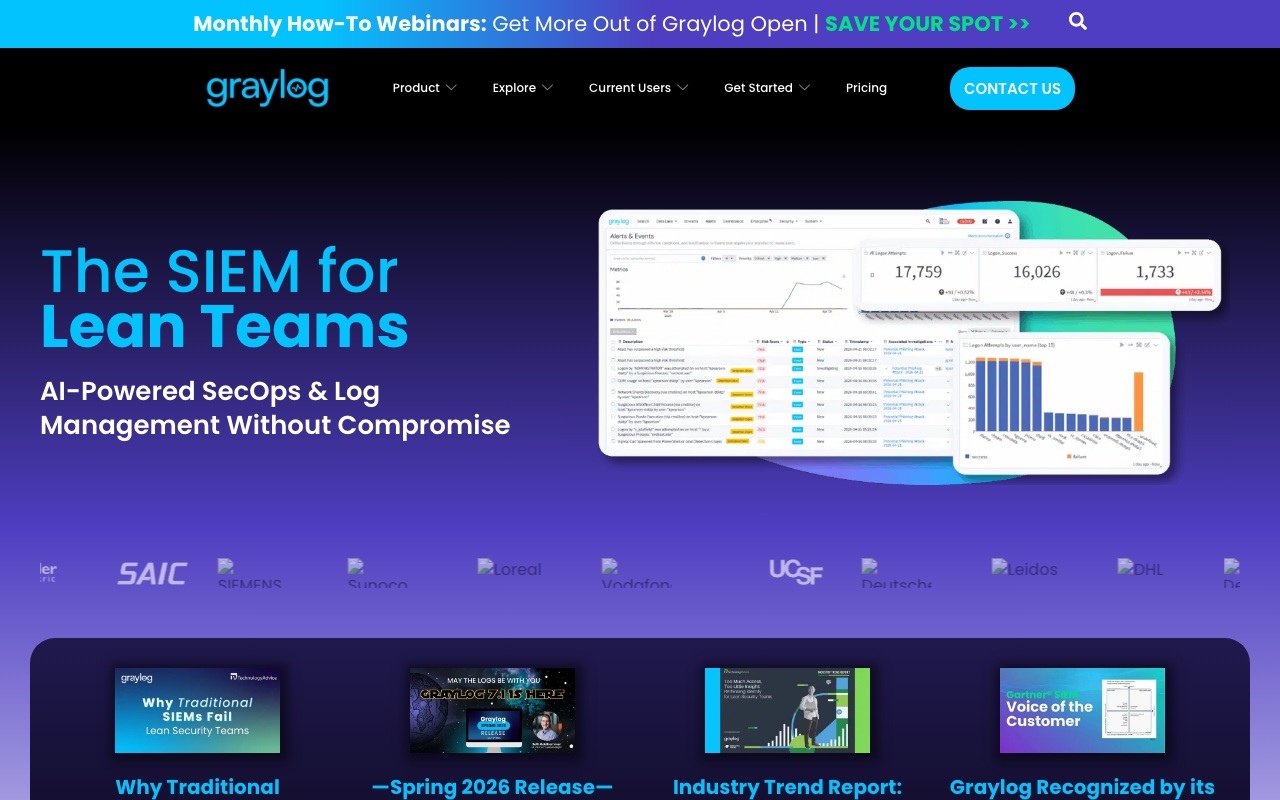
Graylog is the open-core option that puts a real product around an Elasticsearch or OpenSearch backend: stream routing, parsing rules, dashboards, alerting and access control, all managed through a UI rather than a pile of YAML. It also has a serious security and compliance product line, which makes it a common landing spot for teams leaving Splunk who still need SIEM-shaped features without a SaaS contract.
Pros
- Gives you the search quality of an inverted index with an actual operations product on top, rather than raw Elasticsearch plus Kibana
- Self-hosted, so data never leaves your network and there is no ingest meter
- Stream routing and parsing rules are configured in a UI, so the pipeline is manageable by people who do not write collector configs
Cons
- You still operate the underlying Elasticsearch or OpenSearch cluster, with all the shard, mapping and heap work that implies
- The open source edition holds back archiving, correlation and audit features that the security use case needs
- Scaling is your problem, and it is the same scaling problem the managed vendors charge you to avoid
Best for: Teams that want indexed search and SIEM-adjacent features on their own infrastructure, with a real UI rather than a hand-built stack.
Pricing: Open source edition free to self-host, with paid operations and security editions licensed by daily ingest volume.
SigNoz
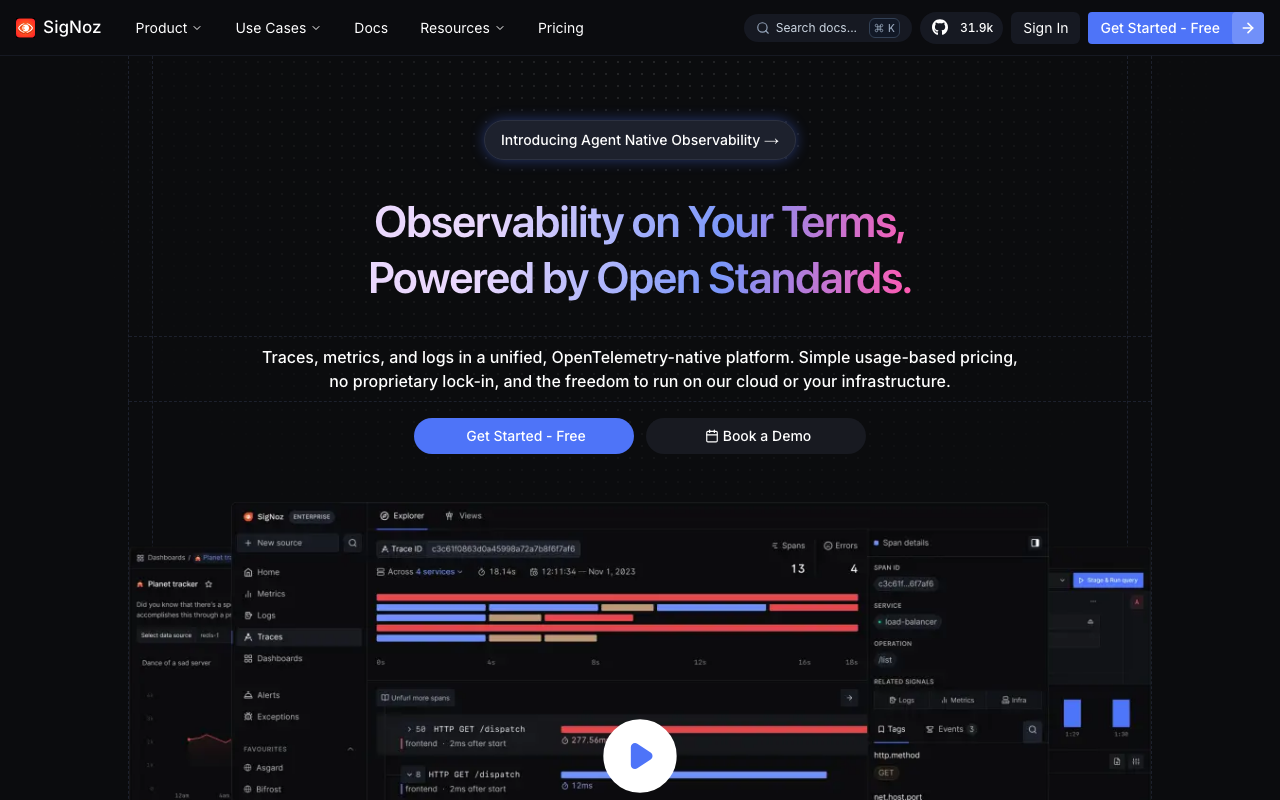
SigNoz is OpenTelemetry-native from the ground up: OTLP in, ClickHouse underneath, and logs, metrics and traces in one store so trace-to-log correlation is a join on trace ID rather than an integration. For teams that have already accepted OTel instrumentation, it is the shortest path from “we emit OTLP” to “we can query all three signals in one place” without a vendor agent.
Pros
- Single ClickHouse-backed store for all three signals, so correlation is structural rather than bolted on
- Nothing proprietary in your instrumentation, so moving to another OTLP backend later costs nothing in application code
- Self-hostable, which keeps data in your network and removes the ingest meter entirely
Cons
- Self-hosted ClickHouse becomes real operational work as volume grows, and that work is not optional
- Log-specific features — parsing rules, archive tiering, compliance reporting — are thinner than the dedicated log platforms
- Smaller ecosystem, so unusual data sources need your own collector configuration
Best for: Teams already emitting OTLP who want one self-hostable store for logs, metrics and traces without a vendor agent.
Pricing: Open source and free to self-host at infrastructure cost, plus a managed cloud metered on ingested data and retention.
How to choose
Answer three questions in order and the shortlist collapses.
What is the query you run under pressure? Unpredictable full-text search across everything means an inverted index — Elastic, Splunk, Graylog, or Datadog’s indexed tier. Narrow label selection in Kubernetes means Loki. Aggregation over long windows means a columnar store — ClickHouse, Axiom, SigNoz, Better Stack. Do not buy for the query you wish you ran.
Where does the parsing happen, and who pays for it? Structured JSON at the source makes every option cheaper and better. If you cannot change the applications, then somebody parses: your agent, your aggregator, or the vendor. Vendor-side parsing is convenient and is one of the things you cannot take with you.
What is your ceiling, and what happens when a bad day hits it? An ingest-priced contract with no quota per service is an open-ended commitment. Either put a pipeline in front that can sample and drop, or buy a model where retention cost sits in your own object storage.
| Option | Architecture | Picks itself when |
|---|---|---|
| Elastic | Inverted index | Arbitrary full-text search is the defining query |
| Splunk | Inverted index | Long-retention correlation and compliance reporting |
| Graylog | Inverted index, self-hosted | You want indexed search plus SIEM features on your own hardware |
| Grafana Loki | Label index + scan | Kubernetes, narrow selectors, cheapest ingest |
| ClickHouse | Columnar SQL | Long retention and aggregation-heavy questions |
| Axiom | Columnar on object storage | You want everything retained without index governance |
| SigNoz | Columnar SQL, OTLP-native | Logs, metrics and traces in one self-hostable store |
| Datadog Logs | Indexed tier + cheap ingest tier | APM is already Datadog and correlation matters most |
| Sumo Logic | Tiered managed | Operational and security logging on one dataset |
| Coralogix | Pipeline-tiered | High volume with a hard cost ceiling |
| Better Stack | Columnar, bundled | One vendor for logs, alerts and status page |
Needs first-hand data: Take one week of real production logs and load them into an inverted-index store, a label-indexed store and a columnar store at the same retention. Record on-disk bytes after compression in each, then run the same three queries — request ID lookup, 30-day aggregation, free-text grep — and record wall-clock time. That table is worth more than any vendor benchmark.
Needs first-hand data: Time a query against your oldest retained data in whatever tier it currently lives in, from clicking run to first result. If the answer involves a rehydration job, your effective retention for incident response is the hot tier only, whatever the contract says.
Frequently asked questions
Do I need log management if I already have APM?
Often no, at least not as a second contract. Most APM platforms now ingest logs and correlate them to traces, and for a team whose logs are mostly application logs from services that are already instrumented, that is enough. You need a separate log product when the volume is large enough that APM-tier pricing is untenable, when the sources are not applications — network gear, audit trails, third-party appliances — or when retention is a compliance requirement rather than a debugging one. The APM tools hub covers what the combined platforms include.
Why is my log bill so much higher than my traffic growth?
Because ingest pricing meters bytes, and bytes are driven by verbosity and incidents rather than by requests. A single service upgraded to a chattier library version, a retry loop logging each attempt, or one debug flag left enabled will move the bill without moving traffic at all. Attribute volume per service and per log level first; the answer is almost always one or two sources rather than general growth.
Should I put logs in the same tool as errors and incidents?
They answer different questions. Error tracking groups exceptions into issues with stack traces and release attribution, which a log search does badly; log management answers what happened around an event, which an error tracker does not attempt. Most teams run both and connect them by trace ID. See error tracking tools and incident management tools for those categories.
Is open source log management actually cheaper?
Cheaper in licence, not automatically cheaper in total. You remove the ingest meter and take on cluster capacity, upgrades, backup and someone being woken up when a disk fills. That trade is clearly worth it above a certain volume and clearly not worth it below one. Open source log management works through where that line sits.
Related reading
- Elasticsearch vs Loki vs ClickHouse — the three architectures compared in depth, with the failure mode of each.
- Splunk alternatives — why teams leave, what they lose, and what the migration actually costs.
- Best open source log management tools — collection, pipeline and store as three separate decisions.
- Best log management for Kubernetes — pod labels, ephemeral containers and per-node collection.
- Best APM tools — when the APM platform’s log tier is enough on its own.
- Best self-hosted observability stacks — what running metrics, logs and traces yourself costs in operations.