This is the defining choice in log storage, and it is not a feature comparison. Elasticsearch, Loki and ClickHouse answer one question differently — when a log line arrives, how much work do you do now so a query later is fast — and everything else about them is a consequence of that answer.
Elasticsearch does the most work at write time. It analyses the line into terms and builds an inverted index per field, so a search for an arbitrary string across a month finishes in an intersection of posting lists rather than a scan. You pay for that in ingest CPU and in an index that frequently exceeds the size of the data it describes.
Loki does almost none. It indexes a handful of labels, compresses the bodies into chunks, and puts them in object storage. Ingest is cheap, storage is cheap, and the work you skipped at write time gets done at read time, every time, proportional to how many bytes your label selector failed to exclude.
ClickHouse does a third thing entirely. It sorts and compresses columns, keeps a sparse index of granule boundaries, and answers questions by reading only the columns involved. Aggregating a billion rows is quick and cheap. Finding an arbitrary substring in a message body is a scan with a bloom filter in front of it, which is a fundamentally different operation from an index lookup, however fast the scan is.
Everything below derives from those three sentences: which queries are fast, what ingest costs, what storage costs at the same retention, how much operational attention each demands, and — the part that decides more migrations than any benchmark — precisely what each one does when a single query goes wrong.
Key takeaways
- Elasticsearch buys fast arbitrary full-text search with expensive ingest and the largest storage footprint of the three. Its 3am failure is JVM heap pressure cascading into node loss, or a flood-stage watermark flipping indices read-only.
- Loki’s query cost is entirely a function of how narrow your label selector is. A line filter over a week of all namespaces is a distributed grep of your whole retention, not a search.
- ClickHouse gives the best compression and by far the best aggregation performance, and has no inverted index. Its 3am failure is merges falling behind until “too many parts” blocks inserts.
- Label cardinality breaks Loki, dynamic field mapping breaks Elasticsearch, and a bad sort key breaks ClickHouse. Each has one self-inflicted wound, and each is avoidable if you know it exists.
Elasticsearch: an inverted index per field
Elasticsearch is Lucene with distribution around it, and the unit of work is the segment: an immutable file containing, for a batch of documents, an inverted index per indexed field.
When a document arrives, each field goes through an analysis chain — tokenising, lowercasing, whatever the analyser specifies — and every resulting term gets appended to a posting list naming the documents that contain it. Alongside that, Elasticsearch typically stores two more copies of your data. _source keeps the original JSON so you can see the document you sent. Doc values keep a columnar representation of each field so sorting and aggregation do not have to un-invert the index. That is three structures for one log line, and it is the direct answer to “why is my index bigger than my logs.”
Ingest is expensive because writing is only the start. A write goes into an in-memory buffer, gets flushed on the refresh interval into a new small segment, and is then merged repeatedly in the background into larger segments. Merging reads and rewrites data that was already written, sometimes several times over the life of a document. So sustained ingest capacity is not the rate at which you can accept documents; it is the rate at which you can accept documents and keep up with merging them. A cluster that looks fine at peak and falls apart an hour later is usually one where merges never caught up.
Storage at the same retention is the highest of the three. Doc values and the inverted index sit beside the source. Compression is per-segment and good, but you are compressing three representations rather than one. If your budget conversation is about long retention, Elasticsearch is structurally the wrong end of the trade.
Mapping is the first thing that will hurt you. Dynamic mapping means every new JSON key in a log line becomes a new field in the index mapping, permanently, for that index. Ship a log line containing a map keyed by customer ID, or an error object whose keys vary per exception type, and you get thousands of fields. Mapping lives in cluster state, cluster state is replicated to every node and held in heap, and a large mapping makes every operation on that index slower. There is a configurable field-count limit precisely because this is a known way to break a cluster, and hitting it means rejected writes rather than degraded performance. The defence is explicit mappings for the fields you query and a single flattened or disabled-mapping field for the rest.
Shard sizing is a heap budget, not a performance knob. Each shard is a full Lucene index with fixed overhead: segment metadata, terms dictionaries and file handles, all of which occupy memory on the node hosting it. Too many small shards and heap goes to overhead rather than to queries. Too few large shards and a single node’s failure means a long recovery, and query parallelism drops because a shard is the unit of parallel work. Neither direction announces itself; you find out from GC behaviour.
The JVM heap is the thing you tune at 2am. This is the specific failure worth knowing before you commit. Heap pressure builds — from mapping bloat, from an expensive aggregation, from too many shards, from field data on a high-cardinality field. Garbage collection pauses lengthen. A pause long enough makes the node miss its cluster heartbeat, so the master evicts it. The cluster then reallocates its shards elsewhere, which loads the remaining nodes, which increases their heap pressure. That is a feedback loop, and once it starts, adding queries makes it worse. Circuit breakers exist and help, but they reject work rather than prevent the underlying pressure.
And when a single query goes wrong: a deep aggregation over a high-cardinality field, a leading-wildcard search, or a query hitting far more shards than intended can consume search threads across the cluster. The search thread pool queue fills, unrelated queries get rejected, and if the memory involved is large enough you are back in the heap spiral. The blast radius of one bad query in Elasticsearch is the cluster, not the query.
Loki: a label index and a brute-force scan
Loki inverts the entire trade. It maintains an index over label sets only — the log body is never indexed at all.
A stream is a unique combination of label values: {namespace="prod", app="checkout", pod="checkout-7d9", container="server"} is one stream. Entries for a stream accumulate in memory in an ingester, get compressed into a chunk when the chunk hits a size or age threshold, and the chunk is flushed to object storage. The index records, for each stream, which chunks cover which time ranges. That index is tiny relative to the data, because it describes streams and chunk references rather than content.
Queries run in two distinct phases, and understanding the split is the whole point:
Phase one, the label selector. {app="checkout"} resolves against the index to a set of chunk references. This is fast and cheap. It is also the only place where selectivity is free.
Phase two, the line filter. |= "timeout" is applied by downloading each selected chunk, decompressing it, and scanning the lines. There is no index to consult. The query frontend splits the time range, shards the work, and hands pieces to queriers, so you can throw parallelism at it — but the total work done is bytes decompressed and scanned, and that number is fixed by phase one.
The consequence is a cost model you can compute in your head. {app="checkout"} |= "timeout" over one hour touches one application’s logs for one hour. {namespace=~".+"} |= "timeout" over seven days touches every log line you retained for a week. Those are not variations of the same query. In Elasticsearch they are close to the same operation, because the index already knows which documents contain the term regardless of how wide the net is. In Loki the second one is a distributed grep over your entire log volume, and it will cost you either wall-clock minutes or a large number of query workers billed by the second.
This is the single most important thing to internalise before adopting Loki, because it inverts a habit. In an indexed store, the way to find something is to search broadly and narrow down. In Loki, searching broadly is the expensive operation, and the discipline is to narrow by label first, always.
Cardinality is the trap. Each unique label combination is a separate stream with its own in-memory buffer in the ingester and its own chunk lifecycle. Add pod as a label and you get a stream per pod, which is fine and is the intended design. Add request_id, user_id, trace_id, or a URL path with IDs embedded in it, and you get a stream per request. Now the ingester holds hundreds of thousands of partially-filled buffers, each flushing a tiny chunk, and you have converted an efficient design into millions of small objects in object storage with an index describing all of them. Memory climbs, flushes storm, and the store that was chosen because ingest was cheap becomes the thing paging you.
The rule that prevents it is short enough to put in a code review checklist: a label is for something you select on and that has few distinct values. Everything else goes in the log line, where a filter expression can reach it. High-cardinality data is not forbidden in Loki — it is forbidden in labels. A trace ID in the message body is fine and searchable; a trace ID in a label is an outage.
Ordering matters too. Loki’s model expects entries within a stream to arrive roughly in timestamp order, and while out-of-order tolerance is configurable, a source that replays old data or a clock that jumps will produce rejections rather than silent acceptance. Worth knowing before you point a batch importer at it.
And when a single query goes wrong: Loki’s behaviour here is arguably the best of the three. Per-query limits — maximum time range, maximum chunks examined, maximum bytes read — mean an unbounded query typically gets refused rather than executed. The user sees an error telling them the query was too large. The failure mode without those limits configured is that the query monopolises queriers and everyone else’s queries queue behind it, but the cluster’s ingest path is separate from the read path, so writes keep working. Losing your ability to query is bad; losing your ability to ingest during an incident is worse, and Loki’s architecture keeps those failures apart.
ClickHouse: columns, a sort key, and no inverted index
ClickHouse is a columnar analytical database. It was not built for logs, which is exactly why it is good at them.
Data lands in a MergeTree table as parts: self-contained directories of column files, sorted by the table’s ORDER BY key. Background merges combine small parts into larger ones, and merged parts stay sorted. Each column is stored and compressed independently — LZ4 by default, ZSTD when you want smaller at the cost of CPU.
The primary index is sparse. Rows are grouped into granules, and the index holds one entry per granule rather than one per row, which is why it fits in memory even for enormous tables. A query with a predicate on the sort key prunes granules and reads only the surviving ones. Partitioning, usually by day, adds a coarser layer: a predicate on time prunes whole partitions before granule pruning even starts, and dropping old data is a partition drop rather than a row-by-row delete, which makes retention enforcement close to free.
Three consequences follow immediately:
Compression on logs is exceptional. Log data is repetitive in exactly the way columnar compression rewards. A service column with two hundred distinct values across a billion rows, sorted, compresses to almost nothing. Severity, status code, host, region — same. Even the message body, the least compressible column, does well under ZSTD because log messages repeat their templates. This is why ClickHouse wins the storage comparison at equal retention, and it is not close.
Aggregation is where it is untouchable. “Count 5xx by endpoint and tenant per hour over the last 30 days” reads three or four columns, prunes by partition and sort key, and executes vectorised over compressed blocks. This class of query is routine in ClickHouse, slow and expensive in Loki, and possible but memory-hungry in Elasticsearch.
Text search is a different shape of problem. There is no inverted index in the Elasticsearch sense, and pretending otherwise is how people end up disappointed. What you have instead:
- A plain scan.
position(message, 'timeout') > 0or aLIKEreads the message column for the granules that survived pruning and scans it. Because that column is stored contiguously and compressed, this is a genuinely fast scan — often fast enough that people are surprised — but it is linear in the data that pruning failed to eliminate. - Token bloom filter skip indexes. A
tokenbf_v1orngrambf_v1data-skipping index stores, per granule, a bloom filter of the tokens present. A query usinghasToken()consults it and skips granules that definitely do not contain the token. This is the closest thing to an inverted index available and it is genuinely useful, with two caveats: bloom filters have false positives, so it prunes rather than resolves, and it works on tokens, so substring and wildcard searches do not benefit. - Full-text index support has been developing in ClickHouse and is worth tracking, but a capability still maturing is not the basis for a production decision today.
The practical read: if your dominant query is “find this exact string anywhere in everything,” ClickHouse is fighting its architecture. If your dominant queries are filtered lookups on known dimensions plus aggregations, it is the best tool of the three by a wide margin.
Schema is the work you do up front. Two decisions dominate. The sort key determines what pruning is possible — put a low-cardinality, frequently-filtered column first, then time, and get the pruning you want; put a high-cardinality ID first and you have effectively made a table with no useful index. Changing it later means rewriting the table. The second decision is explicit columns versus a map for dynamic attributes. Explicit columns compress better and query faster; a map column absorbs arbitrary keys without schema changes but reads worse. Most production log schemas end up with explicit columns for what you always query and a map for the tail.
And when a single query goes wrong: with per-query memory and execution-time limits set, a runaway query fails itself and nothing else — the cleanest behaviour of the three. Without those limits set, a query can consume server memory and take the node down, and unlike Elasticsearch there is no default circuit breaker doing the thinking for you. Set max_memory_usage, max_execution_time and per-user quotas on day one; it is the difference between “that query failed” and “that query took production down.”
The characteristic ClickHouse 3am failure is different from a query at all: too many parts. Every insert creates a part. Merges combine them in the background. If you insert frequently in small batches, parts are created faster than merges can consume them, and ClickHouse eventually refuses inserts with a “too many parts” error to protect itself. The fix is upstream — batch inserts into fewer, larger writes, usually via a buffer in your pipeline — and if you do not know this failure exists, it is genuinely baffling the first time. A full disk makes it worse, because merges need free space to run, so a nearly-full disk stops merges, which increases part count, which is a compounding loop rather than a plateau.
Which query patterns each is actually good at
Four query shapes cover almost everything teams do with logs. Their behaviour is different enough that this alone can decide the choice.
“Every line for this request ID.” All three do this well when the ID is indexed, a label, or part of the sort key — and all three do it badly when the ID is buried unparsed inside a message string. Elasticsearch handles it naturally if the field is mapped. ClickHouse handles it well if the ID is a column and either the sort key prunes it or a bloom filter index covers it. Loki handles it well only if you can also supply a narrow label selector and a tight time range, because a bare request-ID filter across everything is the expensive case. The honest conclusion: this query is decided by your log structure more than by your store.
“Count errors by endpoint and tenant, hourly, over 30 days.” ClickHouse, decisively. Elasticsearch can do it with date histogram and terms aggregations and will consume real heap doing so, especially on high-cardinality terms. Loki can express it in LogQL and will scan a month of chunks to answer, which is the worst case for its architecture. If this shape is your daily work, the decision is already made.
“Find this exception text anywhere in the estate, last 7 days.” Elasticsearch, decisively. This is what an inverted index is for, and neither of the others has one. ClickHouse will scan, which is fast per byte and still linear. Loki will decompress a week of everything. If your incident workflow starts with an unqualified string search, be honest that you are buying an inverted index.
“Tail the logs for this pod right now.” Loki, comfortably. Narrow label selector, recent data, live tail — the design point. All three can do it; Loki does it with the least infrastructure and the lowest cost.
There is a fifth pattern worth naming because it changes the answer: “join logs to something else.” Correlating logs against a business table, a deployment record or a customer list is a SQL join in ClickHouse and an export-and-massage exercise in the other two.
Ingest cost, storage cost and the shape of the bill
Ingest cost is dominated by how much CPU each write consumes, and the ordering is not subtle: Elasticsearch does analysis plus indexing plus ongoing merges, ClickHouse does compression plus ongoing merges, and Loki does compression and essentially nothing else. That maps directly onto how much hardware you need for a given line rate.
Storage at equal retention orders the same way, for the same reasons. Elasticsearch stores source plus inverted index plus doc values. Loki stores compressed bodies in object storage plus a small index. ClickHouse stores columns compressed independently and sorted, which is the most efficient of the three for the repetitive shape that log data actually has.
The bill shape differs too, which matters for planning:
- Elasticsearch costs scale with the size of your hot data, because that data must live on disks attached to nodes with enough heap to serve it. Longer retention means more nodes, and more nodes means more heap, more shards and more coordination overhead. Cost grows super-linearly with retention if you are not tiering.
- Loki separates storage from compute cleanly. Retention costs object storage, which is nearly free by comparison, and query capacity is sized against query load rather than data volume. Costs are lowest at rest and lumpy at query time.
- ClickHouse also separates them well if you run it that way, and its compression means the storage baseline is the smallest of the three. Compute is sized against query concurrency and merge throughput.
Needs first-hand data: Load the same week of production logs into all three at the same retention. Record on-disk bytes after compression in each — including the index in Elasticsearch and object storage in Loki — then run the four query shapes above and record wall-clock time for each. Those numbers vary enormously with log shape, so a general benchmark tells you almost nothing and your own numbers tell you everything.
Operational burden, ranked honestly
ClickHouse is the least demanding to run once the schema is right, and the most demanding to design. A single node handles far more than people expect, the failure modes are few and well-defined, and the recurring work is small. The concentrated cost is up front: sort key, partitioning, column versus map decisions, TTLs, and insert batching. Get those right and it mostly runs. Get the sort key wrong and fixing it means rewriting a large table.
Loki is cheap to run and easy to misuse. The single-binary mode is trivially simple and takes you further than you would guess. The distributed mode — distributors, ingesters, queriers, query frontend, compactor, index gateway — is a genuinely complex system with several components that scale on different signals. The operational risk is not the components, though; it is label discipline, and it is a governance problem rather than an engineering one. One team adding a high-cardinality label affects everyone.
Elasticsearch demands the most continuous attention. Shard counts drift as indices roll over, mappings accumulate, heap needs watching, index lifecycle policies need verifying, and version upgrades of a stateful cluster are a project each time. It is also the one with the deepest published operational knowledge, so problems have documented answers. There is a reason large organisations dedicate people to it, and if you cannot dedicate anyone, use a managed version rather than pretending.
Needs first-hand data: For whichever two you shortlist, deliberately trigger the characteristic failure in staging — fill the disk past the flood-stage watermark in Elasticsearch, add a request ID to a label in Loki, insert in tiny batches until ClickHouse reports too many parts — and write down the recovery procedure and how long it took. You will only learn this cheaply once, and it should not be during an incident.
Elasticsearch
Elasticsearch remains the answer when the query you cannot predict is the one you will need, because it is the only one of the three with a real inverted index. Around it, Elastic ships Kibana, ingest pipelines, alerting, anomaly detection and a security product, so it is the most complete off-the-shelf product here as well as the most demanding to operate. The licence is dual SSPL and the Elastic Licence with AGPL v3 added as an option, rather than Apache 2.0, which is a live issue for policy teams and anyone building a product on top.
Pros
- Arbitrary full-text search across any field without knowing the query in advance — a capability neither alternative has
- The largest ecosystem in log management: dashboards, alerting, integrations, and an enormous body of operational knowledge for when things break
- Rich query DSL covering full text, structured filters, aggregations and relevance ranking in one language
- Mature index lifecycle management for hot, warm and cold tiering without leaving the product
Cons
- Source plus inverted index plus doc values makes storage at equal retention the largest of the three, and long retention is the worst case
- Mapping explosions from dynamic JSON keys are a real production failure that ends in rejected writes, not slow ones
- JVM heap pressure cascades: GC pause, missed heartbeat, node eviction, shard reallocation, more pressure on the survivors
- One badly shaped query can fill search thread pools cluster-wide, so the blast radius is not confined to the query
Best for: Teams whose incident workflow starts with an unqualified text search across everything, and who can staff cluster operations or buy a managed version.
Pricing: No licence cost for the freely available distribution; self-hosting is infrastructure plus operator time, and paid tiers gate some security and machine-learning capability. Managed cloud is priced by deployment resources rather than per ingested gigabyte.
Grafana Loki
Loki is the cheapest way to keep a lot of logs, and it asks you to change how you search in exchange. Labels select, filters scan, and the discipline of narrowing by label first is not optional — it is the cost model. In Kubernetes the labels you need already exist and are already consistent, which is why the design fits there better than anywhere else. It is AGPL v3.
Pros
- Lowest ingest and storage cost of the three, because there is barely an index to build and bodies live in object storage
- Object storage as the durability tier removes most of the disk-full failure mode that defines the other two
- LogQL shares syntax with PromQL, and logs sit beside metrics and traces in Grafana without an integration project
- Per-query limits mean a runaway query is usually refused rather than executed, and the read path failing does not stop ingest
Cons
- A line filter across a wide label selector is a distributed grep over your whole retention — the exact query people run during incidents
- Label cardinality is a hard constraint, and one team adding a request ID to a label degrades the cluster for everyone
- Aggregation over long windows is its weakest area, because there is no precomputed structure to exploit
- The distributed deployment mode is a real system: several components, each scaling on a different signal
Best for: Kubernetes teams already running Prometheus and Grafana whose searches reliably start with a narrow label selector and a tight time range.
Pricing: AGPL v3 with no licence cost self-hosted; the running cost is object storage plus query compute. Grafana Cloud meters ingested gigabytes with retention tiers.
ClickHouse
ClickHouse is the best storage economics and the best aggregation performance in this comparison, and it is a database rather than a log product — a growing number of log tools are ClickHouse with a UI on top. The work it asks for is schema design up front: sort key, partitioning, explicit columns versus a map for the dynamic tail, TTLs, and batching your inserts so merges keep up. Do that once and it is the least demanding of the three to run.
Pros
- Column compression on sorted, repetitive log data gives the smallest footprint of the three at equal retention, by a wide margin
- Aggregations across a month of data are interactive, which is where both alternatives struggle
- Plain SQL, so analysts query it without a new language and logs can be joined against business tables
- Partition-level TTL makes retention enforcement a metadata operation rather than a delete workload
- Per-query memory and time limits contain a bad query to itself when configured
Cons
- No inverted index — free-text search across message bodies is a scan or a token bloom filter, so unqualified string search is its weakest query
- The sort key decides what pruning is possible, and changing it on a large table means rewriting it
- Small frequent inserts outrun merges until “too many parts” blocks writes, a failure that is baffling if you have not met it
- No UI, alerting, parsing or access model in the box; those come from the products built on top
Best for: Teams with SQL fluency, long retention requirements and aggregation-heavy questions, who will invest in schema design before ingesting anything.
Pricing: Apache 2.0 with no licence cost self-hosted; ClickHouse Cloud meters compute and storage separately, which keeps retention cost independent of query cost.
OpenSearch
The Apache 2.0 fork of Elasticsearch, created after the licence change and now governed by a foundation under the Linux Foundation. For this comparison it is architecturally Elasticsearch: same inverted index, same shard model, same heap behaviour, same storage economics. Choose between them on licence, governance and which cloud-managed version you want, not on how they store logs.
Pros
- Apache 2.0 throughout, which settles licence policy and product-embedding questions at once
- Security, alerting and anomaly detection are included rather than tiered behind a commercial licence
- Available as a managed service from major cloud providers, so the operations can be outsourced without changing architecture
Cons
- Every Elasticsearch operational burden applies unchanged — shards, mappings, heap, watermarks
- Feature drift from Elasticsearch grows over time, so knowledge and tooling transfer less reliably each year
Best for: Teams that want the Elasticsearch architecture under an OSI-approved licence, especially with a cloud-managed version doing the operations.
Pricing: No licence cost; self-hosted is infrastructure plus operator time, and managed cloud versions bill by instance and storage.
Grafana Cloud Logs
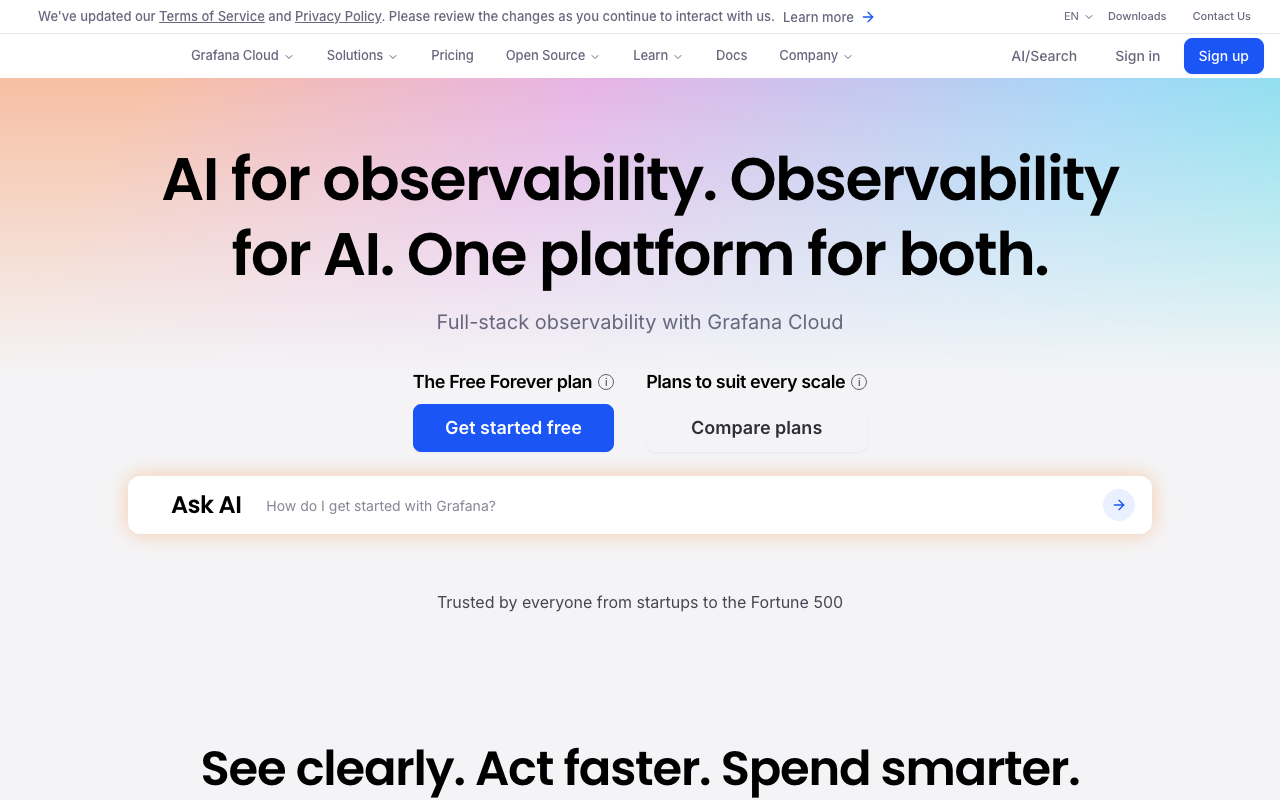
Loki run as a service, which removes the part of the Loki decision most teams underestimate — operating distributors, ingesters, queriers and a compactor as a distributed system. The architecture and its cost model are unchanged, so label discipline still matters and a wide line filter is still expensive, but the components are somebody else’s problem and logs sit next to metrics and traces in the same interface.
Pros
- Loki’s storage economics without operating Loki’s distributed deployment mode
- Logs, metrics, traces and profiles in one place, with the correlation already wired
- Usage-based metering means small deployments are genuinely cheap rather than nominally cheap
Cons
- The query cost model does not change: a broad line filter is expensive whether you run it or they do
- Ingest metering reintroduces the bill that self-hosting on object storage removed
Best for: Teams that want Loki’s economics and Grafana’s interface without staffing the operations.
Pricing: Usage-based on ingested gigabytes with retention tiers, alongside separate meters for metrics and traces. Grafana Cloud vs Datadog compares it against the main managed alternative.
HyperDX
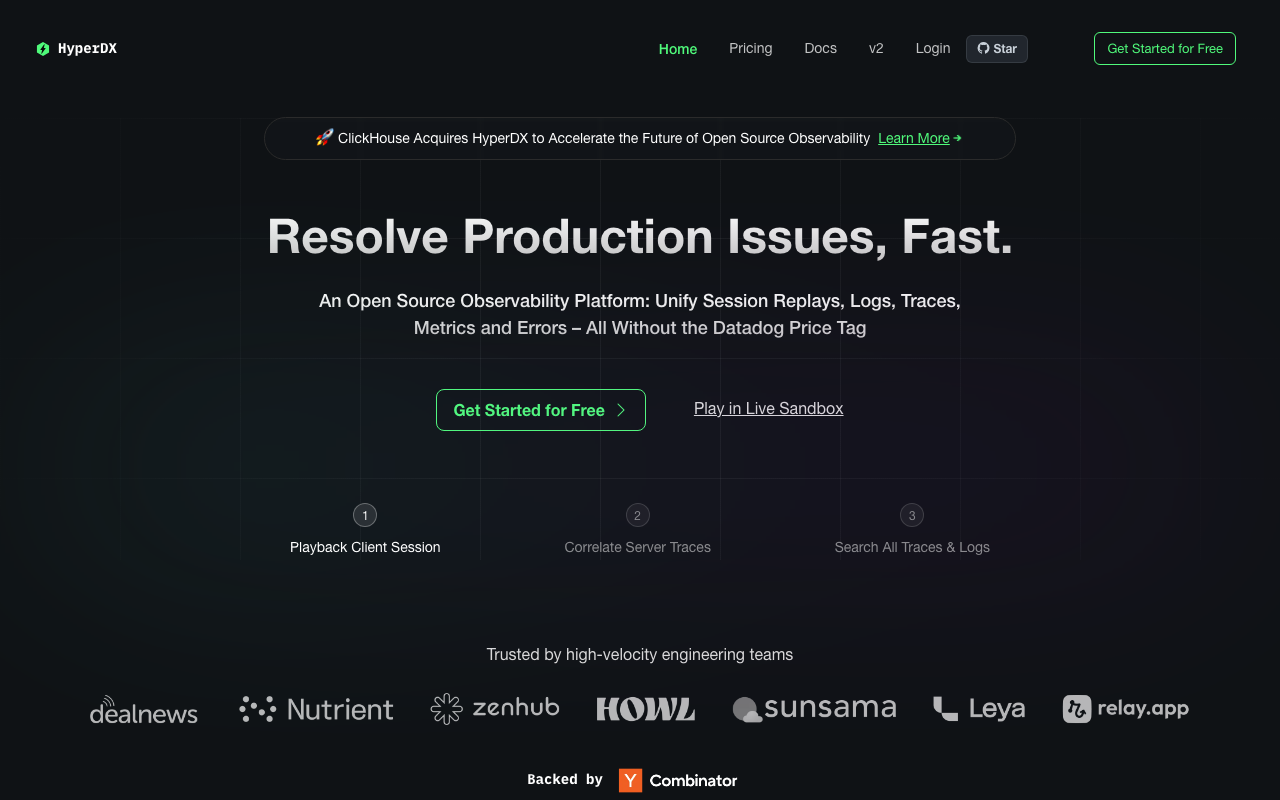
HyperDX is part of ClickHouse, and it is the answer to “ClickHouse is the right store but I do not want to build a UI, alerting and a search experience on top of it.” It puts a session-replay-adjacent, developer-facing interface over ClickHouse-stored logs, traces and metrics, with search that does not require writing SQL for the common cases.
Pros
- ClickHouse storage economics with a finished product on top, rather than a database and a to-do list
- Being part of ClickHouse means the storage layer and the interface are developed together rather than integrated by you
- Search that does not require SQL for everyday queries, while SQL remains available underneath
Cons
- The underlying architecture is still ClickHouse, so free-text search across bodies has the same limits regardless of the interface
- Younger product with a smaller ecosystem than the established log platforms
Best for: Teams that have decided on ClickHouse for logs and want a product experience rather than a database and a dashboard tool.
Pricing: Open source core that you can self-host at infrastructure cost, plus a managed offering tied to ClickHouse Cloud consumption.
SigNoz
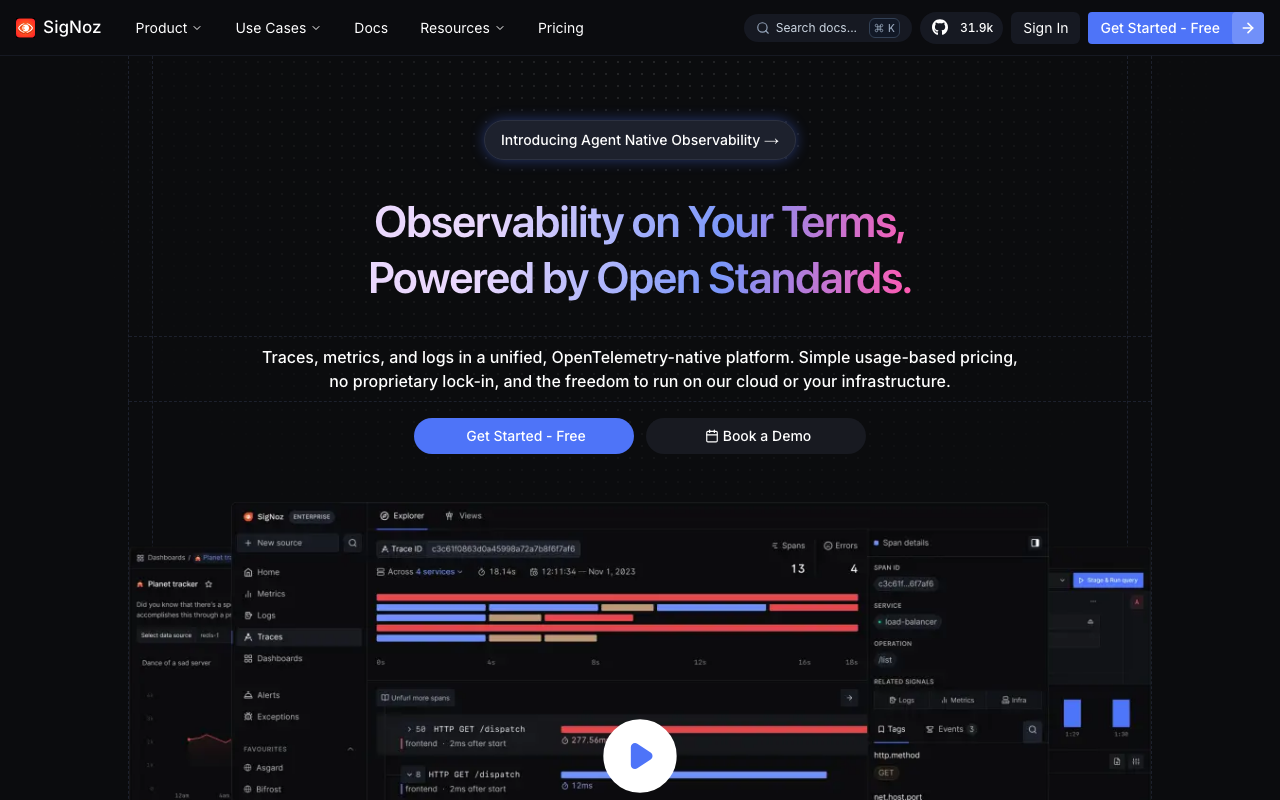
SigNoz is ClickHouse-backed and OpenTelemetry-native: OTLP in, all three signals in one store, so log-to-trace correlation is a join on trace ID rather than an integration. If you have already accepted OTel instrumentation, this is the shortest path from emitting OTLP to querying it without adopting a vendor agent.
Pros
- One ClickHouse-backed store for logs, metrics and traces, making correlation structural rather than bolted on
- Nothing proprietary in your instrumentation, so switching OTLP backends later costs nothing in application code
- Self-hostable in full, which removes both the ingest meter and the data-residency conversation
Cons
- You are operating ClickHouse, with its schema, merge and part-count realities, however the UI presents it
- Log-specific depth — parsing rules, archive tiering, compliance features — trails the dedicated log platforms
Best for: Teams already emitting OTLP who want one self-hostable ClickHouse-backed store for all three signals.
Pricing: Open source and free to self-host at infrastructure cost, with a managed cloud metered on ingested data and retention.
VictoriaLogs
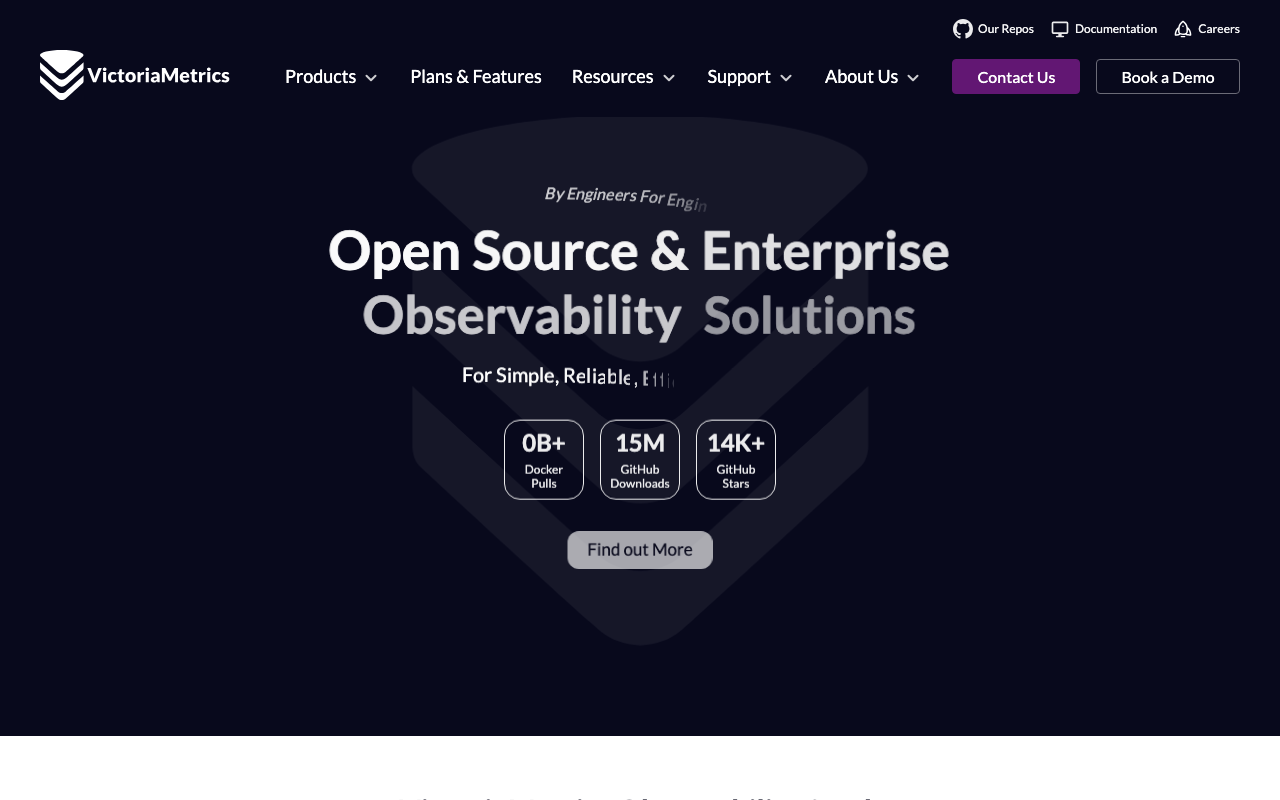
VictoriaLogs sits deliberately between Loki and a columnar store: it indexes more than labels, so high-cardinality fields do not destroy it, without paying full inverted-index costs. It ships as a single binary with no external dependencies, which makes it the lowest-operational-surface option in this comparison by a distance.
Pros
- Single binary, no external dependencies — a genuine reduction in operational surface against every clustered option here
- Handles high-cardinality fields far better than Loki’s label model, removing that architecture’s main self-inflicted outage
- Low memory and disk usage relative to the inverted-index stores at comparable retention
Cons
- Smaller ecosystem and less published large-scale operational experience than Loki, Elasticsearch or ClickHouse
- Its query language is neither SQL nor PromQL, so it is another one to learn with fewer people who know it
Best for: Teams that want a self-hosted log store with the least possible operational work, especially those already running VictoriaMetrics.
Pricing: Open source with no licence cost plus a paid enterprise build; the running cost is modest infrastructure relative to clustered alternatives.
How to choose
Answer these in order. Each one eliminates more than any feature list.
What does your incident workflow actually start with? If it starts with pasting an error string into a search box with no other qualifier, you need an inverted index, and the answer is Elasticsearch or OpenSearch. If it starts with “which pod, which time window,” Loki fits. If it starts with a question about rates, counts or comparisons across time, ClickHouse. Watch what your team does during a real incident rather than asking them what they need.
Is your retention driven by debugging or by compliance? Debugging retention is short and hot, which suits Elasticsearch fine. Compliance retention is long and rarely queried, and paying inverted-index storage prices for it is the most common expensive mistake in this category. Long retention points at ClickHouse or at Loki with object storage, possibly alongside a shorter hot tier in something else.
Who is going to run it? If nobody owns it, ClickHouse’s up-front schema work will not happen and Elasticsearch’s continuous attention will not happen, and the honest choice is a managed version or the single-binary option. VictoriaLogs and single-binary Loki go a long way with very little care.
Can you enforce discipline across teams? Loki needs label discipline and Elasticsearch needs field discipline, and both are governance problems, not technical ones. If you cannot stop a team adding a high-cardinality label or shipping a log line with unbounded JSON keys, ClickHouse’s explicit schema is the design that fails loudest and earliest rather than silently and expensively.
| Elasticsearch | Loki | ClickHouse | |
|---|---|---|---|
| Indexes | Every field, inverted | Labels only | Sparse, by sort key |
| Best query | Arbitrary full-text search | Narrow label selection, live tail | Aggregation over long spans |
| Worst query | Deep high-cardinality aggregation | Broad filter, wide selector | Unqualified substring search |
| Storage at equal retention | Largest | Small | Smallest |
| Ingest cost | Highest | Lowest | Middle |
| Schema work up front | Mapping design | Label design | Sort key and columns |
| Self-inflicted wound | Mapping explosion | Label cardinality | Bad sort key, tiny inserts |
| Failure at 3am | Heap pressure, node eviction | Ingester memory from cardinality | Too many parts blocks inserts |
| Query blast radius | Cluster-wide | Read path only | The query itself, if limits are set |
| Query language | Query DSL and its own SQL dialect | LogQL | SQL |
A pattern worth naming: plenty of mature teams run two. Loki or ClickHouse for the bulk of volume at long retention, and a small Elasticsearch index for the subset where unqualified text search genuinely matters — security events, audit trails, or one service’s error stream. That costs two systems and can be much cheaper than forcing all volume through the expensive architecture. The broader category view is in best log management tools.
Frequently asked questions
Is Loki actually cheaper than Elasticsearch?
At rest, clearly yes — there is barely an index to store and bodies live in object storage rather than on node-attached disks. At query time it depends entirely on your query pattern. A team that searches with narrow label selectors will spend far less overall. A team that habitually greps across all namespaces for a week will burn query compute repeatedly and can end up spending more than a right-sized Elasticsearch cluster would have cost, while also waiting longer. Loki’s savings are real and they are conditional on discipline.
Can ClickHouse do full-text search on logs?
It can search text, and it does not do it the way an inverted index does. Your options are a scan over the message column, which is fast per byte because the column is contiguous and compressed but still linear in the data that pruning did not eliminate, or a token bloom filter skip index that lets queries using hasToken() skip granules that definitely lack the token. Bloom filters have false positives, so they prune rather than resolve, and they work on whole tokens rather than substrings. Full-text index support in ClickHouse has been developing and is worth tracking, but if unqualified string search is your primary workflow today, an inverted index is what you want.
What is a mapping explosion and how do I prevent it?
It is what happens when dynamic mapping turns every new JSON key in your logs into a permanent field in the index mapping. Log a map keyed by customer ID, or an error object whose keys vary by exception type, and the mapping grows without bound. Mapping lives in cluster state held in heap on every node, so a large one degrades everything, and there is a field-count limit that rejects writes when you hit it. Prevent it by defining explicit mappings for the fields you query and routing everything else into a single flattened field, and by treating “no unbounded key names in log objects” as a code review rule.
Why does Loki get slow when I add more labels?
Because each unique combination of label values is a separate stream with its own in-memory buffer and its own chunk lifecycle. Adding a label multiplies the stream count by that label’s cardinality. Adding pod is fine. Adding request_id creates a stream per request, which means hundreds of thousands of partially filled buffers in the ingesters and a flood of tiny chunks in object storage. The fix is to move high-cardinality data out of labels and into the log line, where a filter expression can still find it.
Should I run one of these myself or buy the managed version?
Buy the managed version unless you have someone who owns it. All three are easy to install and none is easy to operate at volume: Elasticsearch needs continuous attention, distributed Loki is several components with different scaling signals, and ClickHouse concentrates its cost in schema design that has to be right the first time. If nobody’s job description includes this, the self-hosted option will drift until it fails during an incident. Open source log management works through that calculation in detail.
Related reading
- Best log management tools — the whole category, including the managed platforms built on these three engines.
- Best open source log management tools — collection, pipeline and store as three separate decisions.
- Splunk alternatives — which of these three you land on depends on why you are leaving.
- Best self-hosted observability stacks — the operational cost of running metrics, logs and traces yourself.
- Best APM tools — when the APM platform’s log tier removes the need to choose at all.
- Best OpenTelemetry-native observability platforms — where to send OTLP logs once your collectors emit them.