Every exception your application throws is already in your logs. The stack trace is there, timestamped and searchable. So the fair question is why error tracking is a separate purchase at all.
The answer is that log search returns lines and an error tracker returns issues. When a bad deploy throws the same exception on every request, log search gives you a wall of near-identical entries and a count. An error tracker gives you one row that says this started at 14:02, arrived with release 4.7.1, affects these users, and here is the value of the variable that was null when it blew up. Turning many occurrences into one issue with an owner, a status and a first-seen release is the entire product.
Which means the grouping algorithm is the product. Everything else in the category is roughly the same shape: an SDK catches the exception, attaches breadcrumbs, release, environment and user context, and ships it to an ingest endpoint. What separates a tool your team trusts from one your team mutes is whether the fingerprinting holds one bug together across deploys, and keeps forty unrelated bugs from collapsing into one unreadable row because they all pass through the same catch-all handler.
Nobody shops for grouping. People shop for language support, integrations and price, then meet grouping six weeks later during an incident, when the issue they need has been split into forty by one changed stack frame.
Key takeaways
- Error tracking collapses many occurrences into one issue with a fingerprint, an owner and a first-seen release. That collapse is what you are buying; capture is the easy half.
- Grouping fails in two directions — over-splitting after a deploy changes a frame, and over-merging behind a generic wrapper — and both are fixed by controlling the fingerprint, not by merging issues in the UI.
- Source maps and debug symbols are a release-artifact upload problem in your CI pipeline. Get the release identifier wrong and every stack trace is unreadable.
- The Sentry event protocol is a de facto wire format rather than a product, which is why GlitchTip and Bugsink accept traffic from official Sentry SDKs when you change the DSN.
What error tracking does that log search cannot
Error tracking adds four things a log query does not have, and each one is a workflow rather than a field.
A fingerprint. Occurrences are hashed into a stable identifier so the thousandth occurrence lands on the same issue as the first. Log search can count matching lines; it cannot tell you that these two differently-worded messages are the same defect.
Issue state. Resolved, ignored, assigned, snoozed until it happens again. A log line has no lifecycle, so there is nowhere to record that a human looked at this and decided something.
Structured local context. SDKs capture more than the trace text: breadcrumbs leading up to the throw, the request that triggered it, the release and environment, the user or tenant, and in several runtimes the local variables in each frame. That is why an error tracker often ends the investigation and a log line only starts it.
Regression detection. Because issues have state and events carry a release, the tool can tell you that something you closed two months ago came back in today’s build. Nothing in a log index knows what you resolved.
The overlap with log management is real but shallow. Logs answer “what was the system doing”; error tracking answers “which defects exist, who owns them, and are they getting worse”.
Grouping is the product, and it fails in two directions
Default grouping is roughly: exception type, plus the frames in the stack that belong to your code rather than to a library, plus a normalised message. Everything interesting is in that “roughly”.
Over-splitting is one bug appearing as many issues. Causes, in the order you will meet them:
- Line numbers in the grouping key. Add an import at the top of the file and every issue in it splits. Good implementations group on module and function; not all do, and configuration varies.
- Variable data in the message.
User 88213 not foundandUser 90114 not foundare one bug and two fingerprints unless the message is normalised or the fingerprint is overridden. - A new frame in the path. Wrap a handler in middleware, upgrade a framework, add a decorator, and the in-app frames shift. The defect is unchanged; the hash is not.
- Minified or rotating symbol names. A JavaScript bundle with no working source map produces frames named
aandt, and those names change on the next build.
Over-merging is the worse failure because it is silent. A top-level except Exception in a request handler, a promise-rejection catch-all, or a house AppError class used for everything gives every unrelated defect the same type and the same top frames. You get one issue with an enormous occurrence count that nobody can act on, and the real bug inside it never gets its own row.
The fix in both directions is the fingerprint, not the triage queue. Merging and unmerging issues in the UI cleans up history; it does not change what tomorrow’s events do. Set the fingerprint explicitly at the throw site or in the SDK’s pre-send hook for the classes you know are trouble — a wrapper error should be fingerprinted on the wrapped cause, and a message with an ID in it should be fingerprinted on the template, not the rendered string.
So evaluate this before you evaluate anything else: can you override the fingerprint per event from code, and can you write server-side rules that apply to events already arriving from SDKs you do not control? A tool with only automatic grouping is a tool you will eventually fight.
Needs first-hand data: Take one week of real production events and replay them into two candidate tools. Count distinct issues created for the same underlying defect set, then repeat after a deploy that adds a middleware frame. The over-split ratio across a deploy boundary is the single most useful number in this category and no vendor publishes it.
Releases are the spine: source maps, symbols and regressions
A stack trace is only useful if the frames name your code, and for every compiled or bundled target that requires an artifact your build produced and then threw away.
JavaScript and TypeScript need source maps uploaded to the vendor, not served to the public. The upload has to be keyed to the same release identifier the SDK reports at runtime, plus a distribution identifier if you build the same release more than once. Newer toolchains embed a debug ID in the bundle and the map so the match is by ID rather than by filename and version, which removes the most common cause of “the upload succeeded and traces are still minified”.
iOS needs dSYM files per build, Android needs the R8 or ProGuard mapping file, and native code needs debug information files. All three are produced at build time, none survive in the shipped artifact, and rebuilding later does not reproduce them byte for byte.
The practical rule: symbolication is a CI job, and it must fail the build when it fails. A silent upload failure produces a tool that looks healthy and is useless in the exact moment you need it, usually weeks later when nobody connects the two events.
The same release identifier does a second job. Because events carry it, the tool can compute release health — the share of sessions in a build that ended in a crash, and how adoption is tracking — and can flag a regression when an issue marked resolved reappears in a later build. Both features are worthless if your release string is latest or a timestamp that changes per pod. Use the commit SHA, set it identically in the SDK config and the source map upload, and the rest follows.
Needs first-hand data: Break the source map upload deliberately in a staging pipeline — wrong release string, then wrong dist — and record whether each candidate tool surfaces the mismatch in its UI or silently shows minified frames. Vendors differ sharply here and it is invisible until it costs you an incident.
Quotas and PII: the two settings you configure after the incident
Quota behaviour is a design decision you should make deliberately. When your event budget runs out mid-incident, a tool can do one of three things: drop everything until the period resets, keep a sample so the shape of traffic survives, or keep ingesting and bill you for the overage. All three are defensible and they are very different at 3am. Ask the question during evaluation, because the deploy that blows your quota is by definition the deploy you most need data from.
Spike protection deserves specific attention. A rule that throttles a runaway issue is exactly right for a retry loop hammering one endpoint, and exactly wrong when a second, unrelated error started in the same deploy and gets dropped as collateral. Client-side controls are the better lever: a sample rate for high-volume known-noisy errors, per-issue rate limiting, and a pre-send filter that discards browser-extension noise, bot traffic and cancelled requests before they consume anything.
PII arrives without you deciding to send it. Error SDKs capture request bodies, headers, cookies and query strings, and in Python, Ruby and PHP many of them capture local variables in each stack frame — which is how a password ends up in your error tracker, as the argument to the function that was hashing it. Breadcrumbs pick up form values. User context picks up email addresses.
The controls exist: turn off default PII capture, configure denylists for field names, and scrub in the SDK rather than at the server. That distinction matters more than the settings page suggests — server-side scrubbing means the data crossed your boundary before it was removed, which is not the same statement to make to an auditor. If your contract or your regulator forbids that crossing entirely, you are in self-hosted territory and the shortlist gets short.
The Sentry event protocol: a wire format, not a product
Sentry’s ingest format — a DSN that encodes a public key and a project endpoint, an envelope containing an event with exception, stack trace, breadcrumbs, tags, contexts and release — became the de facto interchange format for this category, in the same way OpenAI’s HTTP shape did for model APIs. It is not a governed standard. It has no vendor-neutral steward, no conformance suite and no version you can require in a contract. There is nothing to buy and no bill.
It matters anyway, because it is the strongest lock-in-avoidance argument available here.
What it gives you
- Official Sentry SDKs — the most widely tested error SDKs in most languages — become clients for other backends by changing one configuration value, the DSN
- Migration touches your configuration, not your instrumentation, so the code that adds tags, sets user context and overrides fingerprints keeps working
- Alternative backends compete on storage, price and operations instead of on re-implementing SDKs for twenty languages
- It makes running a second backend in parallel practical, which is how you evaluate a replacement honestly
What it does not do
- Compatibility is claimed, never certified. Coverage of newer envelope item types — session health, profiles, tracing, replays, cron check-ins — varies by backend and is where the gaps are
- The protocol carries events; it says nothing about grouping, so two backends fed identical events produce different issue lists
- Everything you built around Sentry rather than inside the SDK — alert rules, ownership rules, dashboards, integrations — has no protocol and does not transfer
- SDK releases target Sentry’s server. A backend can fall behind a new SDK version and the failure looks like missing data, not an error
The migration mechanics that follow from this are the subject of Sentry alternatives.
Sentry
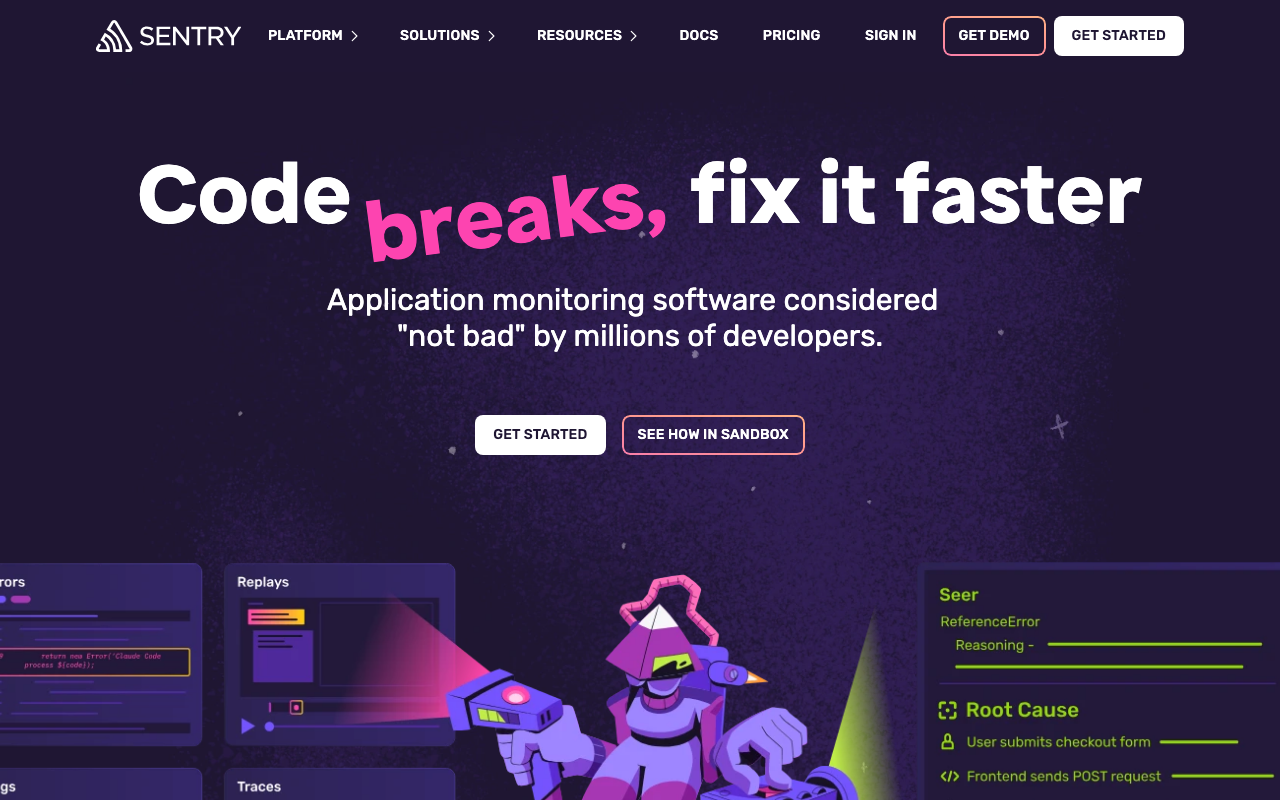
Sentry is the reference implementation of the category and, for most teams, the default. Its SDK coverage is the broadest, its grouping is configurable from both ends — a fingerprint on the event and server-side grouping rules on the project — and source map, dSYM and R8 handling are mature enough to be boring. The product has expanded well past errors into tracing, session replay, profiling, cron monitoring and logs, which is either the reason to consolidate or the reason to leave.
Pros
- The most complete SDK matrix in the category, and the SDKs other backends are built to accept
- Grouping is controllable per event and per project, including server-side rules for events from code you do not own
- Release, source map and symbol tooling is mature, with debug IDs removing the classic release-mismatch failure
- Session-based release health and regression detection work out of the box once releases are set correctly
Cons
- Separate meters for errors, spans, replays and profiles mean the bill moves in ways teams routinely fail to model
- The platform has grown well beyond error tracking, so teams that only want errors pay for surface they do not use
- The Functional Source License is source-available, not OSI-approved open source, which some procurement policies treat as a hard stop
Best for: Teams that want the deepest SDK coverage and the strongest release and symbolication tooling, and are willing to manage event budgets actively.
Pricing: Event-quota subscription with independent meters per data category and retention tiers, plus overage or drop behaviour you configure per meter.
Rollbar
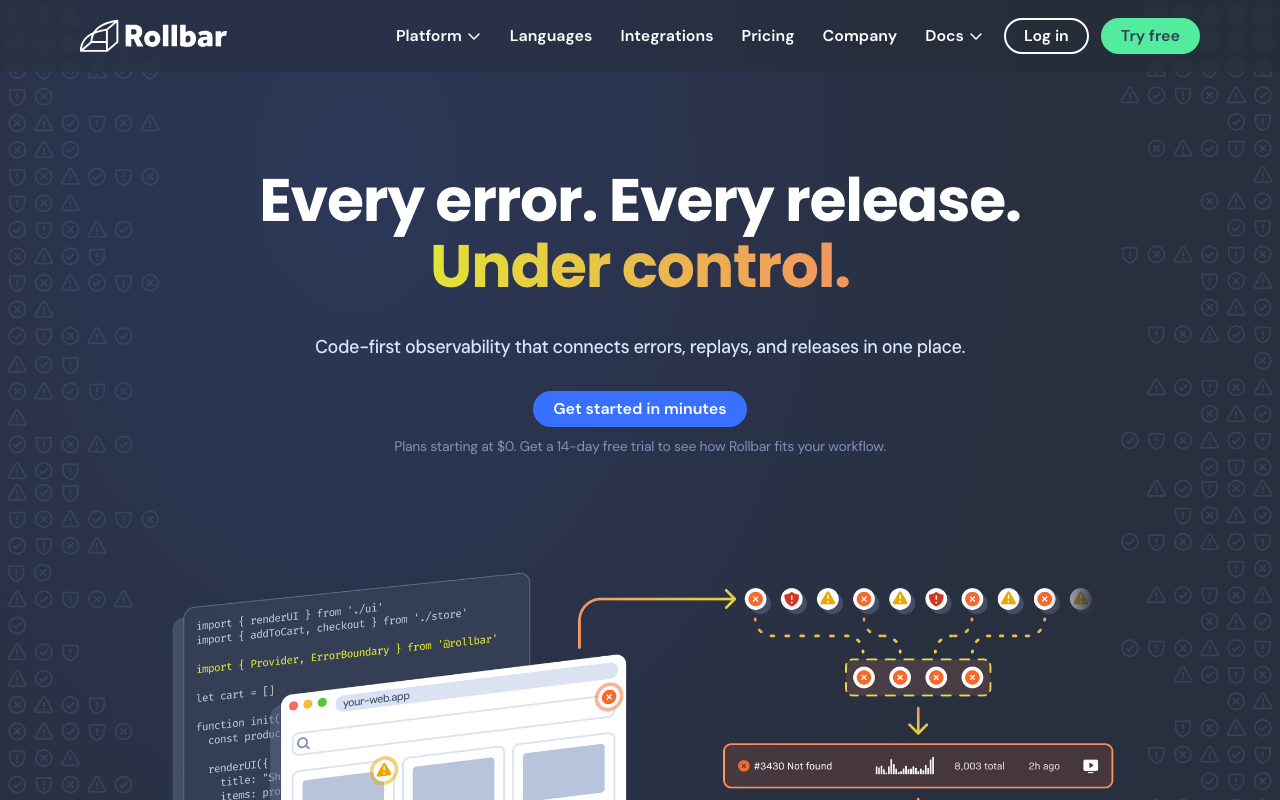
Rollbar has always treated grouping as a first-class, user-controllable feature rather than an implementation detail. Its item-and-occurrence model separates the defect from the events, and its custom fingerprinting and grouping rules let you fix an over-merged catch-all handler without touching application code. It also has a query language over item and occurrence data, which is closer to how an engineer actually hunts than a filter sidebar.
Pros
- Custom grouping rules configured server-side, which fixes bad grouping for SDKs and services you do not control
- Query language over items and occurrences instead of only faceted filters
- Deploy tracking with per-release error rate is built into the core workflow, not a bolt-on
- Straightforward scope: it is an error tool, so nothing about it is competing for attention with tracing
Cons
- Session replay, profiling and tracing are not the product, so a team consolidating will still buy something else
- The interface carries a lot of history and takes longer to feel fluent than the newer tools
- Rules-based grouping is powerful and becomes its own maintenance surface once several people write rules
Best for: Teams whose main complaint is grouping quality and who want to fix it with server-side rules rather than code changes.
Pricing: Event-volume tiers with retention bands, priced on occurrences ingested rather than per seat.
BugSnag / SmartBear Insight Hub
BugSnag is now part of SmartBear’s Insight Hub. Its distinctive idea is the stability score: rather than counting errors, it measures the share of sessions or users in a release that were error-free, and lets you set a target that a release either meets or does not. That reframes error tracking as a release-gate signal instead of a bug queue, which is why it has always been strong on mobile, where you cannot roll back a shipped build.
Pros
- Stability targets turn error data into a ship or do-not-ship decision, which is the right frame for mobile releases
- Session-based measurement is more honest than raw error counts, which move with traffic
- Mature mobile handling — dSYM and mapping file uploads, per-build health, staged rollout comparisons
- Sits inside a larger testing and quality portfolio if that is already your vendor
Cons
- Now one product inside a bigger suite, so roadmap attention competes with the rest of the portfolio
- Session-based pricing needs a different mental model than event quotas and is easy to mis-forecast when traffic grows
- Backend and infrastructure context is thinner than the platform tools
Best for: Mobile and client-side teams that want a numeric stability gate per release rather than an issue backlog.
Pricing: Tiered subscription metered on tracked sessions and events with retention bands, sold within the SmartBear portfolio.
Raygun
Raygun packages crash reporting, real user monitoring and APM as one product with a shared session identity, so an error opens into what the user was doing when it happened and what the server was doing at the same moment. That correlation is the pitch. It is a smaller vendor than the platform players, which shows up as a tighter, more opinionated product rather than a shallower one.
Pros
- Errors, real user sessions and backend traces share an identity, so the user-impact question is answerable directly
- Strong client-side coverage across web and mobile with the symbolication pipelines to match
- Priced on events ingested rather than per host, which suits teams with few servers and many users
- Small enough surface that a team can actually learn all of it
Cons
- APM depth is well behind the dedicated platforms; treat it as context for errors, not as your tracing tool
- Fewer third-party integrations than the larger vendors, which is felt in workflow tooling
- Multiple correlated data types on one meter make cost forecasting harder than a pure error product
Best for: Product teams that need the error and the user session in one place and do not want to buy RUM separately.
Pricing: Volume-based on ingested events across errors, RUM and APM, with retention tiers rather than per-host licensing.
Honeybadger
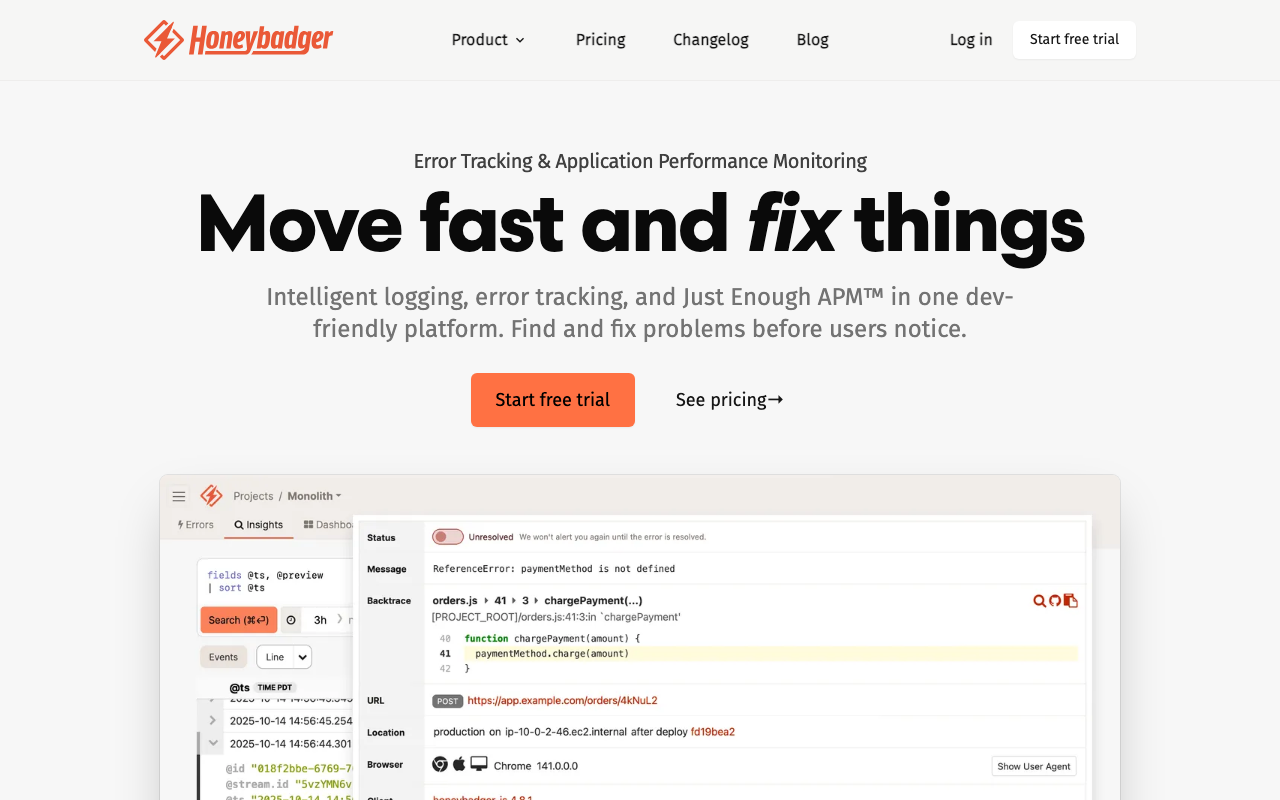
Honeybadger came out of the Ruby world and still shows it in the best way: opinionated defaults, very little to configure, and a scope deliberately drawn at what a small team needs to know something is wrong. Alongside errors it does uptime checks and cron or background-job check-ins, which covers the three ways a small application fails — it threw, it is down, or the nightly job silently stopped running.
Pros
- Errors, uptime monitoring and cron check-ins in one subscription, which removes two vendors for a small team
- Sensible defaults mean useful data on day one without a configuration project
- Deliberately narrow scope, so there is no platform sprawl and no meter you forgot about
- Strong Ruby and Rails ergonomics, with solid coverage for the other common web stacks
Cons
- Not a platform: no tracing, no replay, and correlation with infrastructure data is manual
- Grouping controls are less deep than Rollbar’s or Sentry’s for teams with a serious over-merging problem
- Smaller integration catalogue, which matters if your workflow lives in a less common tracker
Best for: Small teams on Rails or a similar framework who want errors, uptime and job monitoring from one vendor with almost no setup.
Pricing: Flat per-project or per-team subscription tiers rather than usage metering, which makes the bill predictable.
AppSignal
AppSignal treats errors and performance as one product for a deliberately limited set of runtimes — Ruby, Elixir, Node, Python — and goes deeper on those than a broad vendor does. Because the same agent produces the error and the transaction timing, an exception opens into the request that produced it without any correlation setup. Its Elixir support in particular is the best in the category, which is a small market and a decisive one if you are in it.
Pros
- One agent for errors, performance, host metrics and custom metrics, so there is no correlation to build
- Deep runtime-specific instrumentation rather than a generic wrapper, particularly for Ruby and Elixir
- Per-application pricing that scales with apps rather than event spikes, which removes incident-driven bill anxiety
- Alerting on custom metrics is in the same product, so one tool covers “it broke” and “it got slow”
Cons
- Language coverage is intentionally narrow; a polyglot organisation will need a second tool
- Not a fit for large distributed tracing work — it is application monitoring, not a full observability platform
- Fewer enterprise governance features than the platform vendors, which shows up in procurement
Best for: Ruby, Elixir, Node or Python teams that want errors and performance from one agent and one bill.
Pricing: Subscription per application with plan tiers by data volume and retention rather than per-seat pricing.
GlitchTip
GlitchTip is an open source error tracker that implements the Sentry event protocol, so official Sentry SDKs point at it by changing the DSN. Architecturally it is a Django application with PostgreSQL and a Redis-backed worker — a stack most teams already know how to run, and a small fraction of what self-hosted Sentry requires. It deliberately implements the error tracking part of Sentry and not the platform around it.
Pros
- Accepts events from official Sentry SDKs, so adoption and migration are a DSN change rather than a re-instrumentation project
- A Django and PostgreSQL deployment is a bounded, familiar operational commitment
- OSI-approved open source licensing, which clears the policy hurdle that Sentry’s licence creates for some organisations
- Also offers a hosted plan, so you can start managed and self-host later without changing SDKs
Cons
- Protocol coverage tracks Sentry’s error features, not its newer envelope types, so replay, profiling and richer tracing are absent or partial
- Grouping is simpler than Sentry’s; teams with a hard over-merging problem have fewer levers
- PostgreSQL growth and retention pruning become your job as event volume rises
Best for: Teams that want Sentry-SDK error tracking inside their own network without operating a multi-service platform.
Pricing: Free to self-host at infrastructure cost, plus a hosted plan metered on event volume.
Bugsink
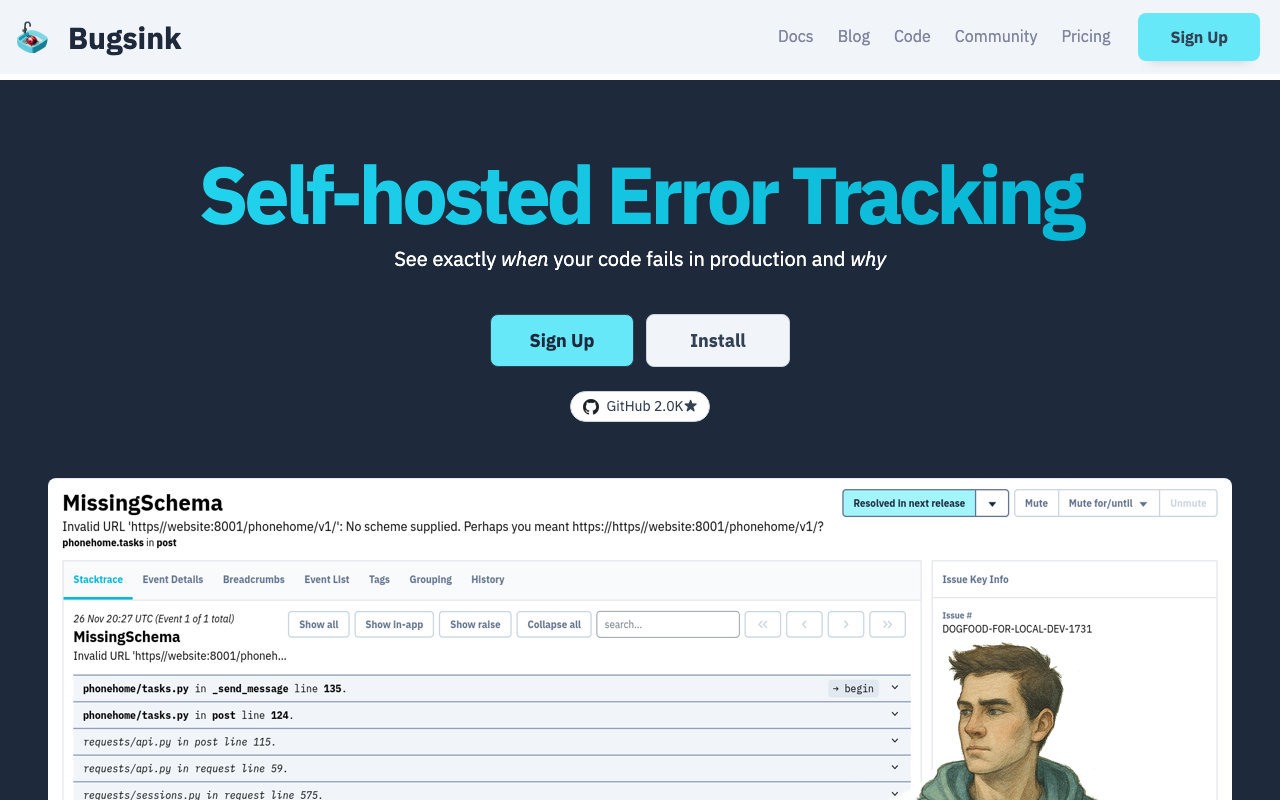
Bugsink is the smallest credible thing in this category: a self-hosted error tracker that speaks the Sentry protocol and is designed to run as a single container against a single database, with an explicit goal of bounded disk usage. Its design bets that most teams do not need a platform, they need somewhere for exceptions to land that they can install in an afternoon and then ignore for a year.
Pros
- Single-container deployment with a conventional database, which is genuinely low operational commitment
- Sentry-SDK compatible, so instrumentation is standard and portable
- Explicit retention and disk-usage controls, which is the thing that actually breaks small self-hosted deployments
- Small enough to read and reason about when something goes wrong
Cons
- Narrow by design: no tracing, no replay, limited dashboards, few integrations
- A young project with a small ecosystem, so you are betting on continued maintenance
- Check the licence text yourself if OSI-approved open source is a procurement requirement
Best for: Small teams and solo operators who want self-hosted error tracking with the operational footprint of a single container.
Pricing: Self-hosted with licence tiers by team size, plus infrastructure cost; no per-event metering.
Datadog Error Tracking

Datadog Error Tracking is not a separate product so much as a grouping layer over data Datadog already has: exceptions from APM spans, from logs, from browser and mobile RUM, fingerprinted into issues. If you already send that telemetry, turning it on is close to free in effort. The value is correlation — the error, the trace it belongs to, the log lines around it and the host metrics at that moment are one click apart, which no standalone error tool can offer.
Pros
- Errors group from sources you already pay to ingest — traces, logs, RUM — with no new SDK
- Correlation with traces, logs, metrics and session replay is native rather than a link-out
- Issue state, ownership and alerting reuse the platform’s existing routing and on-call integrations
- One vendor and one contract for the whole observability surface
Cons
- Error quality depends on what your ingest sampling kept; sampled-out traces mean errors you never see
- Cost is bound to overall telemetry ingest and indexing, so the error feature is not separately controllable
- Deep platform coupling, which is the concern the Datadog alternatives discussion exists for
Best for: Teams already on Datadog for APM and logs who want error grouping without adding a vendor.
Pricing: Included within existing APM, log and RUM meters rather than sold as a separate line, so cost follows ingest and indexing volume.
New Relic errors inbox
New Relic’s errors inbox does the same job inside its platform: group exceptions from backend agents, browser and mobile into one triage queue, tied to the entity that produced them. New Relic’s consumption pricing means data volume and user seats are the two meters, which lands differently from event quotas — you are less likely to be cut off mid-incident and more likely to be surprised at month end.
Pros
- Errors from every instrumented tier arrive in one inbox tied to the service entity that produced them
- Full query language over the underlying event data, so custom triage views are a query rather than a feature request
- Included with the platform’s agents, so there is no separate SDK, quota or contract
- Works well as the errors view for teams already standardised on New Relic APM
Cons
- The full-seat user model means the number of people who can triage errors is a direct cost decision
- Grouping is less tunable than dedicated error tools when your codebase has a catch-all handler problem
- The platform’s breadth means the errors workflow is one screen among many rather than the centre of the product
Best for: Organisations already running New Relic agents that want error triage attached to existing service entities.
Pricing: Consumption pricing on data ingested plus per-user charges by seat type, with errors included rather than metered separately.
How to choose
Answer three questions in order and the shortlist writes itself.
Can this data leave your network? If not, stop here. GlitchTip and Bugsink are the practical answers, self-hosted Sentry if you need the full feature set and can staff it — the open source options go through what each one costs to operate.
Do you already pay for an observability platform? If yes, turn on its error tracking first and use it for a month before buying anything. The correlation is real and the incremental cost is usually small. Leave when you hit the grouping ceiling, not before.
Is your problem capture or triage? If exceptions are being captured and nobody acts on them, the fix is ownership rules, alert routing and grouping quality, not a better SDK. That is a workflow problem and it connects directly to incident management.
| Option | Shape | Picks itself when |
|---|---|---|
| Sentry | Managed platform | You want the broadest SDKs and the best release tooling |
| Rollbar | Managed, error-focused | Grouping quality is the complaint, and you want server-side rules |
| BugSnag / Insight Hub | Managed, session-based | Release stability needs to be a gate, not a backlog |
| Raygun | Managed, errors plus RUM | You need the user session attached to the error |
| Honeybadger | Managed, small-team scope | Errors, uptime and cron checks should be one bill |
| AppSignal | Managed, few runtimes | You are on Ruby, Elixir, Node or Python and want one agent |
| GlitchTip | Self-hosted or managed | Sentry SDKs, your network, a Django-sized footprint |
| Bugsink | Self-hosted | You want one container and no ongoing attention |
| Datadog / New Relic | Platform feature | The telemetry is already there and correlation matters most |
Whichever you pick, keep the instrumentation boring. Use the official SDK, set the release to your commit SHA, override fingerprints at the throw site rather than in vendor rules where you can, and keep the source map upload in CI. That is what makes the next decision cheap.
Frequently asked questions
Is error tracking the same as APM?
No, and the convergence is misleading. APM samples requests to explain latency; error tracking captures every exception to explain defects. Sampling is the tell — an APM that keeps one in ten traces is doing its job, and an error tracker that keeps one in ten exceptions has failed at its job. Most platforms now sell both, and buying them together is reasonable, but a sampled trace store is not a substitute for exception capture.
Why does one bug show up as ten separate issues?
Almost always because something in the grouping key changed: a line number moved, a new middleware frame appeared, a message contains an ID or a URL, or minified symbol names rotated because source maps are not resolving. Fix it at the fingerprint — normalise the message or set the fingerprint explicitly — rather than merging the issues by hand, which only tidies the past.
Do I still need logs if I have error tracking?
Yes. Error tracking sees exceptions; it does not see the requests that returned the wrong answer without throwing, the queue that stopped draining, or anything a third-party system did. The two are complementary, and the boundary is described in the log management guide.
Related reading
- Sentry alternatives — the four real reasons teams leave and which alternative answers each.
- Best open source error tracking tools — what each self-hosted option actually costs to operate.
- Best error tracking tools for startups — free-tier shapes and alert routing that survives week three.
- Best log management tools — the other half of “what was the system doing”.
- Best incident management tools — where a captured error becomes a paged human.
- Best APM tools for developers — the platforms that now bundle error tracking, and how they price it.