Every error tracking comparison written for startups sorts on price. That is the wrong axis, because the free tiers in this category are generous enough that a pre-revenue team can use most of them for a long time without paying anything.
The scarce resource is attention. One engineer is on call for the API, the frontend, the billing webhook and the deploy pipeline, and probably also shipping the feature that was promised on Thursday. Every notification that turns out not to need action spends a bit of the willingness to look at the next one. That budget runs out fast, and when it does the tool is still installed, still ingesting, and completely useless — a dashboard nobody opens with a Slack channel everyone muted.
So the question is not which tool captures the most. They all capture plenty. The question is which one’s out-of-the-box behaviour still gets read in week three, and which one you can set up in the twenty minutes you actually have.
There is a second question underneath it, and more teams should ask it: whether this needs to be a separate purchase at all. If you already pay for a platform that groups exceptions from telemetry you are already sending, adding a dedicated error tracker buys you better grouping and one more vendor, one more login and one more quota. Sometimes that is right. Often it is not, yet.
Key takeaways
- The default alert rule in most tools — notify on every new issue — is the thing that trains a small team to ignore the tool. Change it before you change anything else.
- Free tiers are limited on three separate axes: event quota, retention window and seat count. Which one bites first depends on your traffic shape, not on the vendor.
- Know your tool’s behaviour when the quota runs out — drop, sample, or bill — because the deploy that exhausts it is the deploy you most need data from.
- Log grepping stops working the day an error only reproduces for one customer, and again the day you ship minified or compiled code.
The alert rule that kills the tool
Most error trackers default to notifying on every new issue. In a mature codebase that is a sensible default. In a three-month-old product it means a notification for every deploy, because a young codebase produces new issue signatures constantly — a rename shifts a stack frame, a new endpoint throws its first validation error, a dependency upgrade changes a message.
By week three the channel is muted. Nothing about the tool has failed; the routing was wrong from the first day and nobody changed it.
Two channels fix this, and it takes about ten minutes.
A page, deliberately rare. Route to phones only for conditions that mean something is genuinely broken now: an issue that is new and in production and affecting more than a handful of distinct users in a short window, plus every regression — an issue someone resolved that has come back. Regression alerts are the highest signal rule available in this category and most teams never turn them on.
A digest, deliberately boring. Everything else goes into a once-a-day summary in a shared channel. New issues nobody has seen, issues growing faster than yesterday, top issues by user count. Someone reads it with coffee. Nobody gets woken up.
Two more rules that matter at this size. Route to a shared channel rather than to individuals, because ownership rules are meaningless with three engineers and a per-person routing setup rots the first time someone changes teams. And put the environment filter in on day one — a staging exception paging a founder at midnight is the fastest possible way to lose the team’s trust in the tool.
When error alerts start needing an escalation path and an on-call rotation rather than a channel, you have crossed into incident management, and that is a separate purchase with a separate justification.
Needs first-hand data: Count, for the first month, how many alerts produced an action versus how many were dismissed. If the ratio is worse than roughly one in three, the routing is wrong and no amount of tool switching will fix it.
Time from install to first captured exception
This number matters more at this stage than any feature, because a setup that stalls halfway gets abandoned and the tool never exists at all.
The floor is roughly the same everywhere for a mainstream web stack: install a package, call an init function with a DSN, throw a test exception. Where candidates diverge is everything after that first event.
Release configuration. Set the release to your commit SHA in the SDK config and in your build. Skipping this is the most common early mistake, and it silently disables regression detection and release health — the two features that make the tool worth reading later.
Source map upload. If you ship a bundled frontend, the traces you see before this works are frames named a and t. Doing it during initial setup takes minutes; doing it during an incident three months later is misery. Make it a CI step that fails the build when it fails.
Noise filtering. Browser extensions, bot traffic, cancelled requests and network errors from users on flaky connections all generate exceptions that are not yours. Filter them in the SDK’s pre-send hook the first week, before they set the baseline for what your issue list looks like.
Budget an hour, not twenty minutes, and do all four. A tool set up in twenty minutes is a tool that pages you for staging errors with unreadable stack traces.
Free tiers: three limits, and you only hit one first
Free and cheap tiers are constrained on three separate axes, and comparing them on the headline number tells you nothing because the headline is usually about the axis you will not hit.
Event quota. Bites first for teams with real traffic or a noisy dependency. Remember that event volume is not proportional to how many bugs you have — it tracks how badly your worst one is behaving, so one retry loop can consume a month’s allocation in an afternoon.
Retention window. Bites first for low-traffic teams, which is most pre-product-market-fit startups. If you triage weekly and the window is short, the occurrence you need has already expired by the time you get to it. This is the limit that quietly makes a free tier useless while the quota looks fine.
Seat count. Bites first when non-engineers want in. Support wants to check whether a customer’s report is a known issue, and the founder wants to see whether the thing they demoed is throwing. If your tool charges for that, either you pay or those people ask an engineer, which costs attention — the resource you are actually short of.
Work out which one applies to your traffic shape before you compare plans. And check whether the free tier keeps issue metadata after events expire, because a tool that remembers “this issue existed and you resolved it” is still doing useful work after its data window closes.
Needs first-hand data: After one month, chart your event volume by issue. If a small number of issues account for most of the volume — the usual case — sampling those specific issues in the SDK may keep you inside a free tier indefinitely, which is a configuration change rather than a purchase.
What happens when the quota runs out mid-incident
Ask this during evaluation, because it is the one behaviour you cannot discover safely in production.
There are three possible responses and they are all defensible. Drop: ingestion stops until the period resets, and the data from your worst hour does not exist. Sample: a fraction keeps arriving, so the shape survives and the counts are wrong. Bill: everything is captured and you find out at the end of the month.
For a startup, the drop behaviour is the dangerous one, and the danger is not the missing data from the runaway issue. It is that a second, different error started in the same deploy and got dropped as collateral while the noisy one consumed the budget.
The controls that help are all client-side and all cheap. Set a sample rate for the handful of high-volume issues you have already triaged. Cap per-issue event rates so one loop cannot consume everything. Filter obvious non-bugs before they leave the process. Spike protection at the vendor is a blunt version of the same idea and it cannot tell your important error from your noisy one.
Should this be a separate purchase at all?
If you already pay for something that groups exceptions, try that first for a month.
Platforms like Datadog and New Relic group errors out of traces, logs and RUM you are already sending, at no additional integration cost. Better Stack does the same alongside uptime monitoring. For a small team the correlation is genuinely valuable and the marginal effort is close to zero.
The honest limits of that approach: platform error grouping follows your sampling, so a sampled-out request is an error you never see, and grouping controls are shallower than a dedicated tool’s when a catch-all handler merges unrelated bugs. Both problems arrive with scale, not on day one.
So the sequence that wastes the least attention is: use what you already have, and buy a dedicated error tracker when you hit a specific wall — you cannot fix the grouping, you cannot see the exceptions that got sampled away, or you need per-frame local variables to debug something. Buying it before that is buying a login.
Sentry
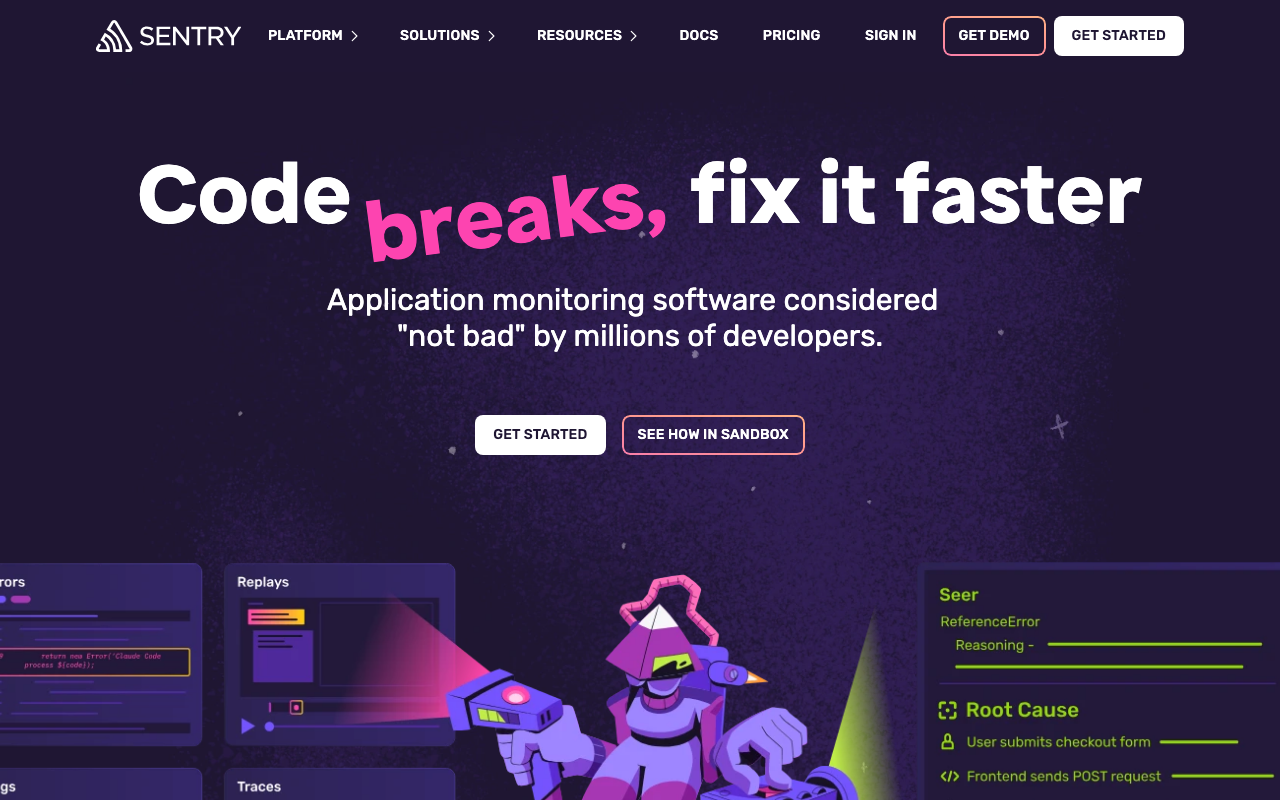
Sentry is the default for a reason: the broadest SDK coverage, the best source map and symbol handling, and a free tier that a small team can live inside for a long time. The caution for a startup is that it is now a platform with separate meters for errors, spans, replays and profiles, and the parts of the product designed for larger organisations — ownership rules, complex alert conditions, environment hierarchies — are surface you have to actively ignore.
Pros
- Fastest path to a working setup in almost any stack, with documentation for the specific framework you use
- Source map and symbol tooling that works, which is the difference between a readable stack trace and a useless one
- Release health and regression detection out of the box once you set the release to your commit SHA
- Large enough ecosystem that your specific problem has already been answered somewhere
Cons
- Default alerting is noisy for a young codebase and must be reconfigured before the team mutes it
- Multiple meters mean the bill can move for reasons unrelated to how many bugs you have
- Considerable surface aimed at bigger organisations, which costs attention to navigate
Best for: Teams that want the safest default, will spend an hour on alert routing, and may grow into the platform later.
Pricing: Free tier with monthly event quotas per data category, then subscription tiers with separate meters and retention bands.
Honeybadger
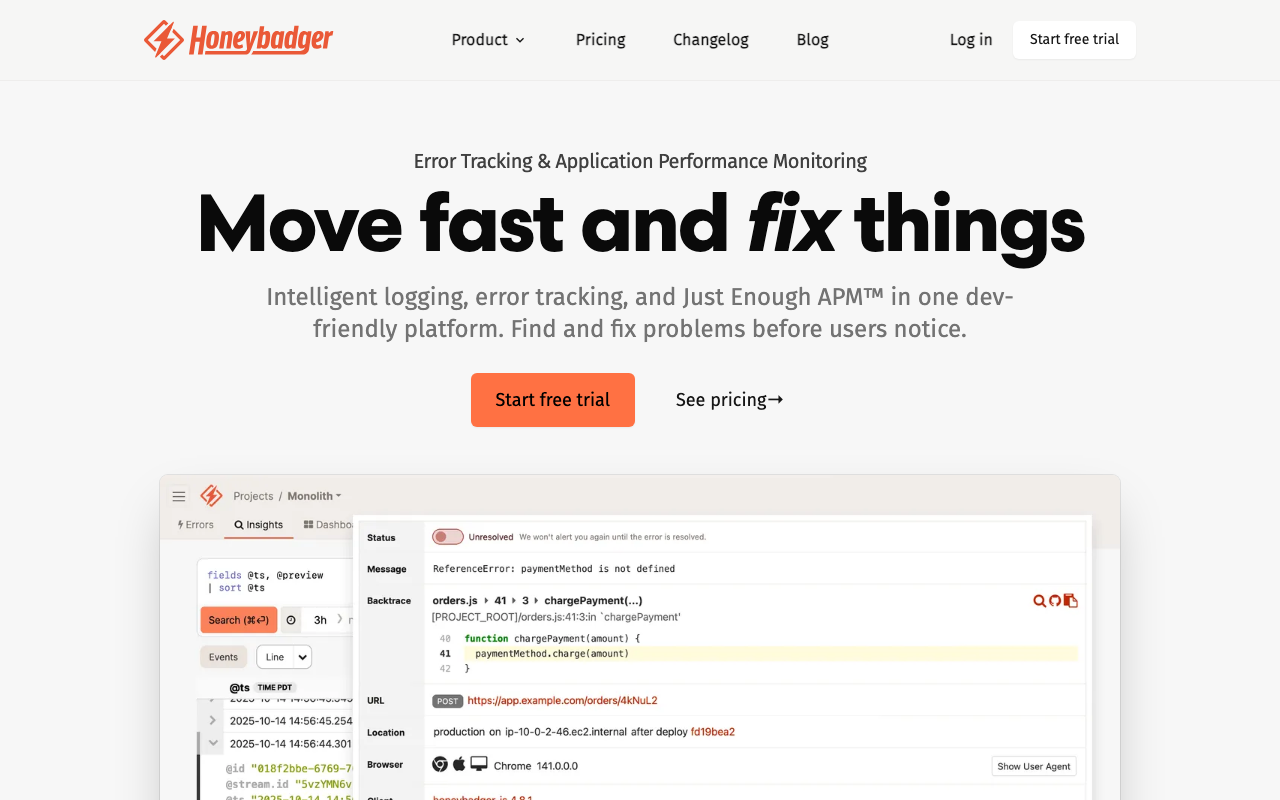
Honeybadger is the best fit for the attention constraint, because it does less on purpose. Errors, uptime checks and cron or background-job check-ins are one subscription, which covers the three ways a young application actually fails: it threw, it is down, or the nightly job stopped and nobody noticed. Flat pricing rather than event metering also means a bad deploy costs you an afternoon, not an invoice.
Pros
- Three failure modes covered by one vendor, removing two other tools a small team would otherwise buy
- Flat subscription pricing makes the bill immune to a runaway issue
- Opinionated defaults mean the setup is genuinely short and there is little to configure wrong
- Small, legible product surface — nothing to ignore
Cons
- No tracing or replay, so correlating with what the rest of the system was doing is manual
- Grouping controls are shallow if your codebase has a catch-all handler problem
- Deliberately limited scope means you will add tools rather than grow into it
Best for: Small Rails-shaped teams who want errors, uptime and job monitoring from one vendor with a predictable bill.
Pricing: Flat per-project or per-team subscription tiers rather than usage metering.
AppSignal
AppSignal covers Ruby, Elixir, Node and Python with one agent that produces errors, performance data, host metrics and custom metrics together. For a startup in those runtimes, that is one integration answering both “it broke” and “it got slow”, which is usually two purchases. Per-application pricing removes incident-driven bill anxiety entirely.
Pros
- One agent for errors and performance, so an exception opens into the request that caused it without setup
- Per-application pricing means an incident spike does not produce a bill
- Deep runtime-specific instrumentation rather than a generic wrapper, and the best Elixir support available
- Custom metric alerting included, covering monitoring needs a small team would otherwise buy separately
Cons
- Narrow language coverage; adding a service in a different language means a second tool
- Not a distributed tracing product, so a microservices architecture outgrows it
- Frontend and mobile coverage is thinner than the error-first vendors
Best for: Ruby, Elixir, Node or Python startups who want errors and performance from one agent and one predictable bill.
Pricing: Subscription per application with tiers by data volume and retention rather than per seat.
Rollbar
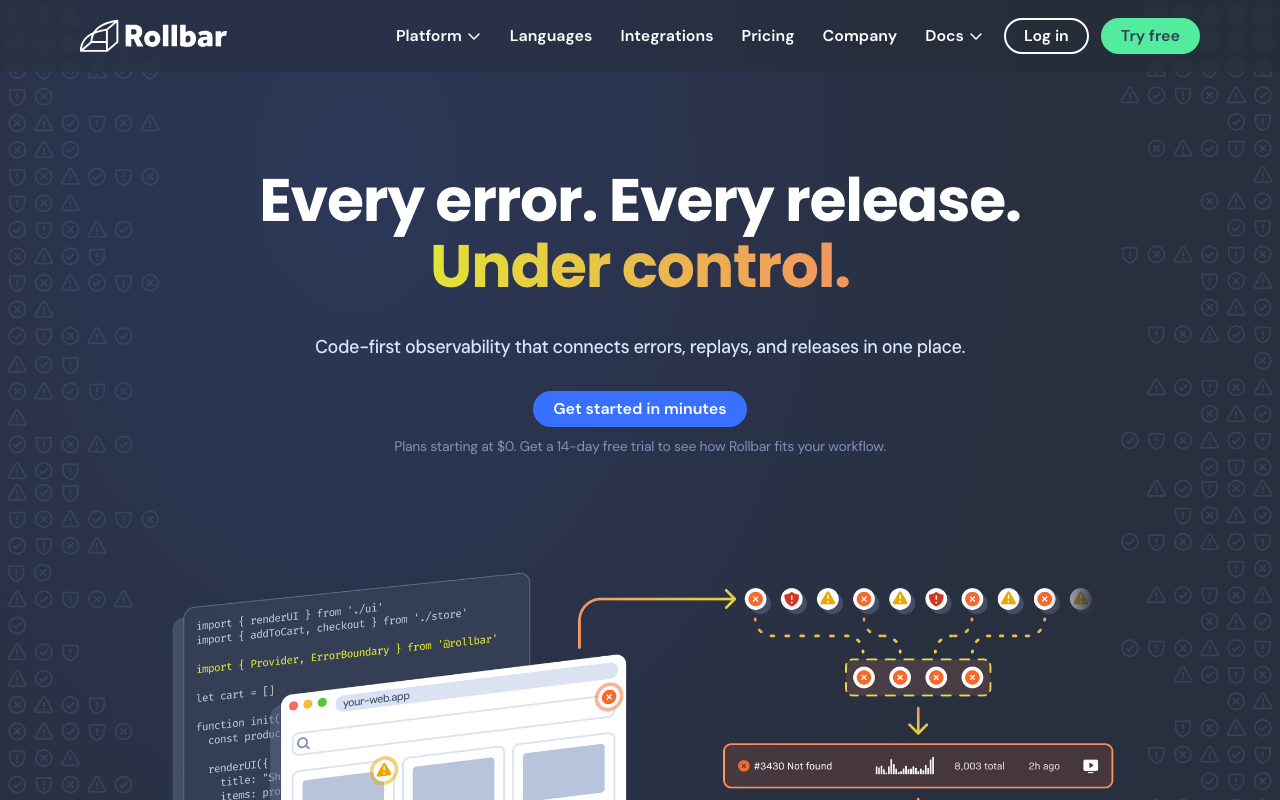
Rollbar is worth considering early if you can already see the grouping problem coming — a framework with a top-level catch-all, or a house error class wrapping everything. Its server-side grouping rules let you fix fingerprints without shipping code, which no other managed option at this price point matches, and it stays a focused error product rather than a platform.
Pros
- Server-side grouping rules fix bad fingerprints without a code change or a deploy
- Focused scope, so there is no platform surface competing for attention
- Query language over items and occurrences for triage patterns filters cannot express
- Deploy tracking with per-release error rates in the core workflow
Cons
- Event-volume pricing, so a noisy dependency moves the bill
- The interface carries a lot of history and takes longer to feel fluent than the newer tools
- No uptime, cron or performance coverage, so it is one tool among several
Best for: Startups whose codebase already has an over-merging problem and who want it fixable in configuration.
Pricing: Free tier with a monthly event allowance, then volume tiers with retention bands.
Raygun
Raygun combines crash reporting with real user monitoring under a shared session identity, so an error opens into what the user was doing when it happened. For a consumer-facing product where the report arrives as “it broke for this customer and I do not know what they clicked”, that correlation ends investigations that would otherwise take a day.
Pros
- Error and user session share an identity, which answers the “what did they actually do” question directly
- Strong web and mobile client coverage with working symbolication
- Priced on ingested events rather than per host, which fits few servers and many users
- Small enough surface to learn completely in an afternoon
Cons
- APM depth trails the dedicated platforms; treat it as context, not as your tracing tool
- Several data types on one meter makes forecasting harder than a single-purpose tool
- More product than a purely backend startup needs
Best for: Consumer-facing startups whose bug reports arrive from users rather than from dashboards.
Pricing: Volume-based across errors, RUM and APM with retention tiers rather than per-host licensing.
Better Stack
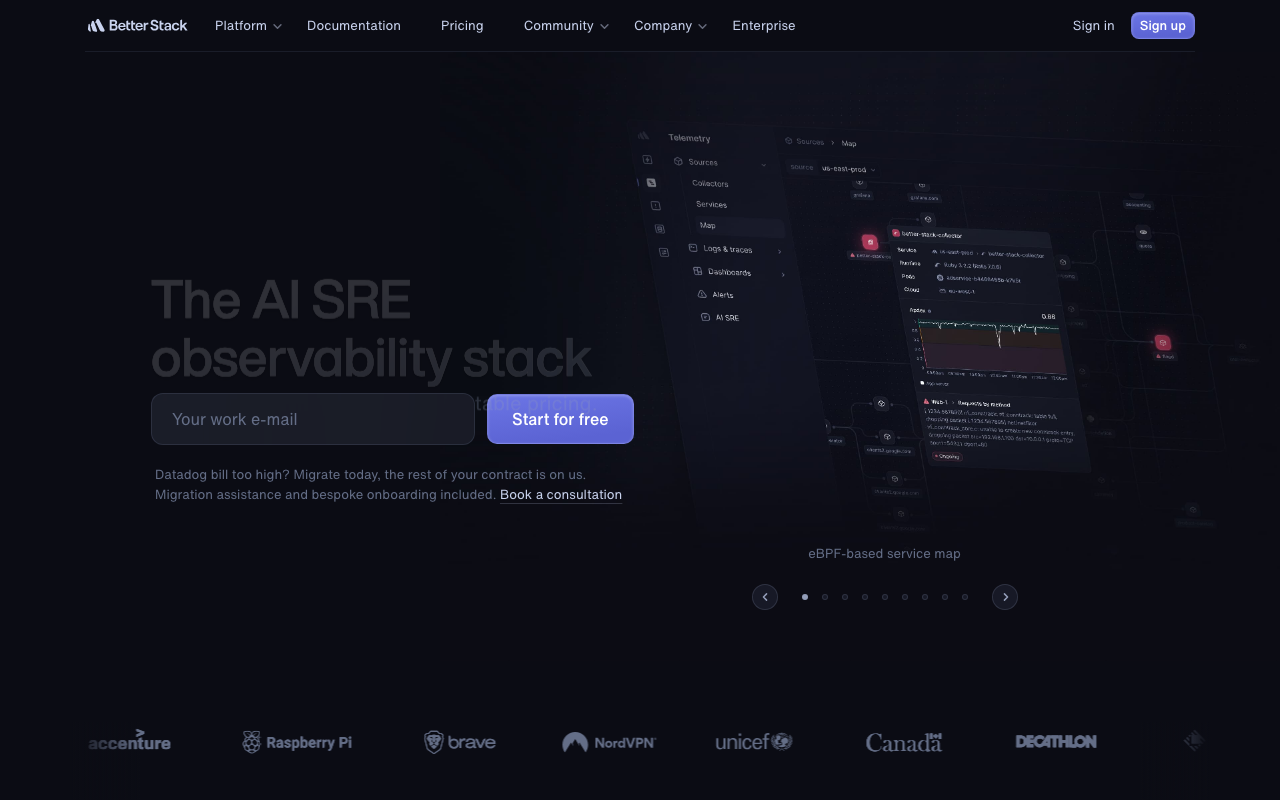
Better Stack comes at this from uptime monitoring and on-call rather than from errors, which is honest about what breaks first at this stage. For most young products the realistic incident is “the site was down and nobody noticed for twenty minutes”, not “an exception in the pricing calculation”. Logs and error visibility attach to a product whose centre is detection and escalation.
Pros
- Covers detection, escalation and status communication in one purchase, which is otherwise three tools
- Solves the failure mode that actually hurts early — nobody noticed the site was down
- On-call scheduling included, so the alerting path has no seam between vendors
- Useful monitoring exists within an afternoon
Cons
- Not a dedicated error tracker: no fingerprint control, no per-frame local variables, no release health
- Error grouping depth is well behind the specialists, which matters once you have real volume
- One vendor for monitoring and incident response concentrates risk
Best for: Pre-product-market-fit teams whose realistic incident is a total outage nobody was paged for.
Pricing: Subscription tiered by monitor count, check frequency and on-call seats, with log volume metered separately.
GlitchTip
GlitchTip is the option for a startup that cannot send stack traces to a third party — usually because an early enterprise customer’s contract says so. It implements the Sentry event protocol, so official Sentry SDKs work by changing the DSN, and it runs as a Django application with PostgreSQL. There is also a hosted plan, so you can start managed and move in-house when a contract forces it, without touching code.
Pros
- Sentry SDKs work unchanged, so instrumentation is standard and the decision stays reversible
- A Django and PostgreSQL deployment is a bounded footprint most teams can already operate
- OSI-approved open source licensing, which answers a procurement question cleanly
- Hosted plan available, so self-hosting is a choice you can defer
Cons
- Self-hosting spends the resource you are shortest of — engineering attention — on running a tool
- Grouping is simpler than Sentry’s, with fewer levers for a codebase with a catch-all handler
- Retention and PostgreSQL growth become your problem from day one
Best for: Startups with a contractual reason error data cannot leave their infrastructure, who want Sentry SDKs anyway.
Pricing: Free to self-host at infrastructure cost, with a hosted plan metered on event volume.
Bugsink
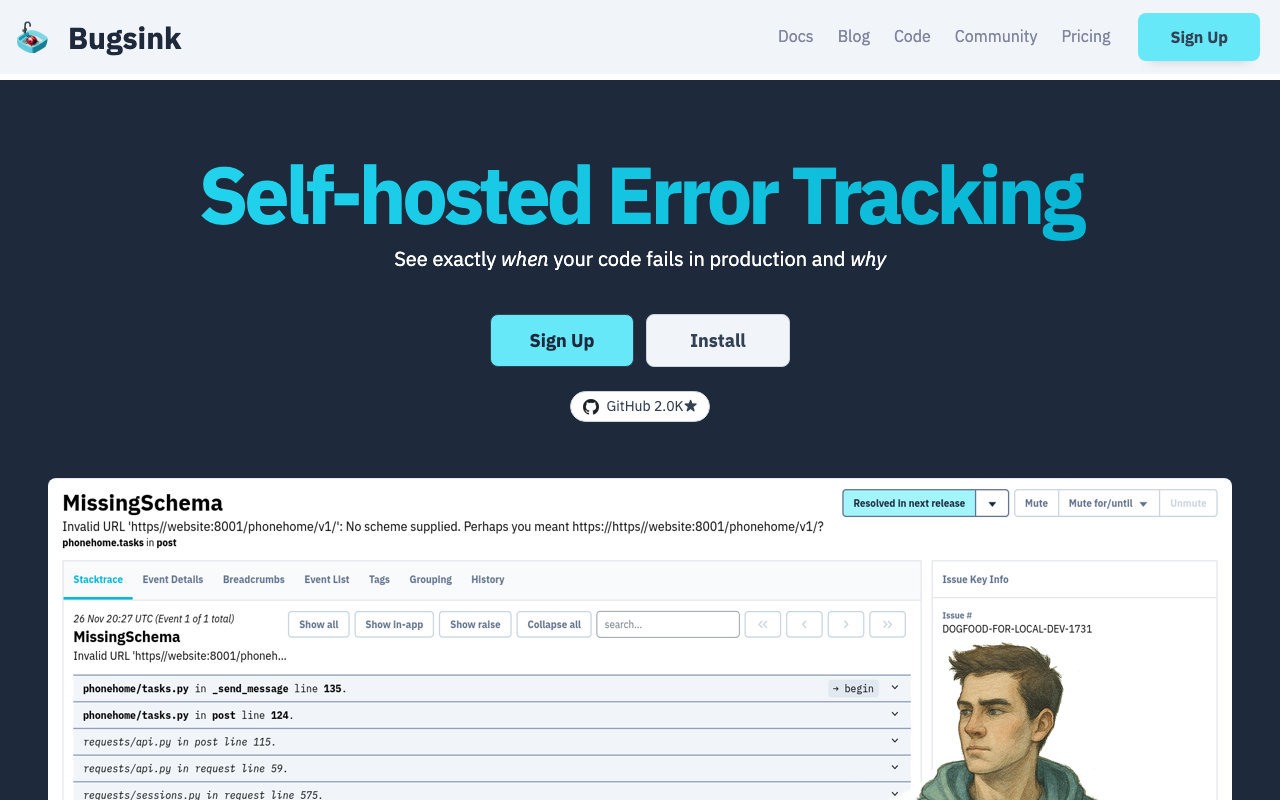
If you must self-host, Bugsink is the version that costs the least attention. It speaks the Sentry protocol and runs as a single container against a conventional database, with retention and disk limits designed in rather than discovered later. For a two-person team with a residency requirement, this is the smallest honest answer.
Pros
- Single container and one database — the lowest operational commitment in self-hosted error tracking
- Retention and disk caps are first-class, which is the failure mode that kills small self-hosted installs
- Sentry-SDK compatible, so adoption and exit are both a DSN change
- Small enough that one person can understand the whole system
Cons
- Narrow by design: no tracing, no replay, limited dashboards, few integrations
- Young project with a small ecosystem, so you are betting on continued maintenance
- Still a system you patch, back up and restore, which is not zero attention
Best for: Very small teams that need self-hosted error tracking and cannot spare anyone to operate a platform.
Pricing: Self-hosted with licence tiers by team size plus infrastructure cost; no per-event metering.
How to choose
Three questions, in order.
Do you already pay for something that groups errors? If yes, turn it on and use it for a month. Buy a dedicated tool when you hit a specific wall, not before.
Can this data leave your network? If a customer contract says no, the list is GlitchTip or Bugsink, and Bugsink if nobody has time to operate anything. Highlight.io is the open source option that also does session replay, but it is self-host only since its hosted service was deprecated, which is the wrong shape when attention is the constraint.
What actually breaks for you today? Be honest. If it is total outages, buy uptime and on-call before error tracking. If it is bugs that only reproduce for one customer, you need per-frame context and a real error SDK.
| If your situation is | Start with | Because |
|---|---|---|
| Default, no constraints | Sentry | Broadest SDKs and the best symbolication |
| Small team, wants one bill | Honeybadger | Errors, uptime and cron in one flat subscription |
| Ruby, Elixir, Node or Python | AppSignal | One agent for errors and performance |
| Grouping problem already visible | Rollbar | Server-side fingerprint rules, no code change |
| Consumer app, user-reported bugs | Raygun | Error and user session share an identity |
| Nobody noticed the outage | Better Stack | Detection and escalation before error depth |
| Data cannot leave the network | GlitchTip or Bugsink | Sentry SDKs, your infrastructure |
Whatever you pick, spend the first hour on the same four things: alert routing split into a page and a digest, the release set to your commit SHA, source map upload in CI, and noise filtered in the SDK. Those four decide whether the tool is still being read next quarter. The error tracking hub covers the mechanisms behind them, and APM tools for startups covers the adjacent purchase.
Frequently asked questions
Can we just grep the logs instead?
For a while, yes — one or two server-side services with structured logs, an error-rate panel and an alert on a new signature is a real setup. It stops working at two specific points: when you ship minified JavaScript or a compiled mobile binary, because a log store cannot resolve those frames; and when a bug only reproduces for one customer, because you need breadcrumbs, user context and per-frame local variables that your logger never printed. The log management guide covers the first half of that setup.
Which free tier limit will we hit first?
Retention, usually, if you are pre-product-market-fit — low traffic means the event quota is comfortable while a short window means the occurrence you want has expired by the time you triage. Teams with real traffic or a noisy dependency hit the event quota instead, and teams where support and founders want access hit the seat limit. Work out which axis applies to you before comparing headline numbers.
Do we need error tracking if we already have APM?
Not necessarily, and the difference is sampling. APM keeps a fraction of traces on purpose; an error tracker captures every exception on purpose. If your platform’s error view is built from sampled traces, you are seeing a sample of your bugs. That is fine early and stops being fine when a rare error matters more than a common one.
Related reading
- Best error tracking tools — how grouping, source maps and quotas work across the category.
- Sentry alternatives — what to do when the bill or the scope stops fitting.
- Best open source error tracking tools — the self-hosted tiers and what each costs to run.
- Best APM tools for startups — the performance side of the same budget decision.
- Best incident management tools — when a Slack channel stops being enough of an escalation path.