“Which one is open source” is the wrong sorting question. Several of these are, one famously is not despite everyone assuming it is, and the licence rarely changes the outcome anyway. The question that decides whether this works is what you are agreeing to operate, and for how long, and who does it when that person is on holiday.
Self-hosted error tracking has an unusual failure curve. Installation is the easy part — most of these are a compose file and an afternoon. The failure comes six to eighteen months later, when the database has quietly grown past the disk, or an upgrade needs a manual migration nobody has done before, or the person who set it up has left and the runbook is a Slack message. None of that shows up in an evaluation.
So sort by operational commitment. There are three tiers, they are genuinely different commitments, and picking the wrong tier is the mistake that makes teams give up and go back to a hosted product at a worse price.
Tier one: run it and forget it. A single binary or single container against a normal database. Bugsink is built for this.
Tier two: a real but bounded footprint. A conventional web application — Django and PostgreSQL with a worker — that you already know how to run, back up and monitor. GlitchTip lives here.
Tier three: a platform. Self-hosted Sentry is several services, including Kafka, ClickHouse, Redis and PostgreSQL. So are the OpenTelemetry platforms that treat errors as one signal among several. Capable, and a commitment with a named owner.
Key takeaways
- Sort self-hosted error trackers by operational tier — single container, single web app, or multi-service platform — because that is what actually determines whether you still run it next year.
- Sentry’s Functional Source License is source-available and converts to an OSI-approved licence after a delay. It is not OSI-approved open source on day one, which matters if your policy says it must be.
- GlitchTip and Bugsink accept events from official Sentry SDKs by changing the DSN, so instrumentation is portable and the migration cost is configuration.
- Retention is the setting that decides whether this survives. Unbounded event storage plus a fixed disk is the most common way self-hosted error tracking dies.
The licence question, answered directly
Sentry is not OSI-approved open source. It ships under the Functional Source License, which permits use, modification and redistribution but restricts competing commercial use, and converts to an OSI-approved licence after a defined delay. That is a reasonable position for a company to take and it is not what “open source” means under the OSI definition.
This matters in exactly one situation: your organisation has a policy, a customer commitment or a government procurement requirement that names OSI-approved licences. Then Sentry’s self-hosted distribution is out regardless of how good it is, and GlitchTip becomes the obvious candidate.
For everyone else the licence is not the deciding factor. You can run self-hosted Sentry, you can modify it, and the restriction only bites if you intend to sell it as a service. Do not let a licence argument make the decision that operational capacity should be making.
One practical note for the rest of this list: read the licence text yourself rather than trusting a badge. This category has projects under permissive licences, projects under source-available licences with a per-team fee, and projects that changed licence mid-life. If it matters to you, it is a five-minute check.
The Sentry event protocol: a compatibility layer, not a product
The reason self-hosted error tracking is viable at all is that Sentry’s ingest format became the de facto interchange format for the category — a DSN encoding a key and a project endpoint, and an envelope carrying an event with exception, stack trace, breadcrumbs, tags and release. It has no vendor, no dashboard and no bill; there is nothing here to buy or deploy.
What it gives you
- Official Sentry SDKs, the best-tested error SDKs in most languages, become clients for GlitchTip or Bugsink by changing one configuration value
- You do not depend on a small project to write and maintain twenty language SDKs, which is where most self-hosted alternatives would otherwise fail
- Moving between compatible backends — including back to hosted Sentry — is a configuration change, so the decision stays reversible
- Running two backends in parallel is practical, which is the only honest way to compare grouping
What it does not do
- It is not a governed standard. There is no conformance suite, no version to require, and compatibility claims are self-reported
- Coverage of newer envelope item types — session health, cron check-ins, replays, profiles — varies and is where the gaps sit
- It carries events and says nothing about grouping, so two compatible backends produce different issue lists from identical input
- SDK releases target Sentry’s own server, so a compatible backend can fall behind and the symptom is missing data rather than an error
Retention and storage growth: the thing that actually bites
Every self-hosted error tracker fails the same way. Not a crash — a full disk, eventually, on a Sunday.
The mechanism is simple and worth stating precisely. Event volume is not proportional to how many bugs you have. It is proportional to how badly the worst one is behaving, and one retry loop or one bad deploy can produce more events in an hour than the previous month. Hosted tools absorb that against your quota; a self-hosted install absorbs it into your database.
Three controls matter and you should configure all three on day one, not after the first incident:
A hard retention window. Delete events older than N days on a schedule. Almost nobody debugs from month-old occurrences, and keeping issue metadata while dropping the individual events preserves the history that is actually useful.
Per-issue event caps. Store enough occurrences of one issue to be useful and count the rest. The thousandth identical stack trace adds nothing and costs the same as the first.
Client-side filtering and sampling. The cheapest event is the one never sent. Drop known-noisy classes, sample high-volume triaged issues, and filter bot and browser-extension traffic in the SDK’s pre-send hook.
Needs first-hand data: Run your candidate for two weeks against real traffic and record database size growth per million events, then extrapolate against your worst historical spike rather than your average. The average is not the number that fills the disk.
Upgrade risk is the second thing
The other way these deployments die is an upgrade that stalls. The bigger the tier, the bigger the risk: a single-container tool with one database usually upgrades by pulling a new image, while a multi-service platform can require ordered migrations across several data stores, and skipping versions may not be supported at all.
Two rules make this survivable. Upgrade on a schedule rather than when you need a fix, because an upgrade under pressure with a broken tool is the worst version of this. And test the restore, not the backup — a PostgreSQL dump you have never restored is a belief, not a backup.
If your team cannot commit to those two things, that is not a failure of discipline, it is information. Take tier one, or take a hosted plan from an open source vendor and keep the option to move later.
GlitchTip
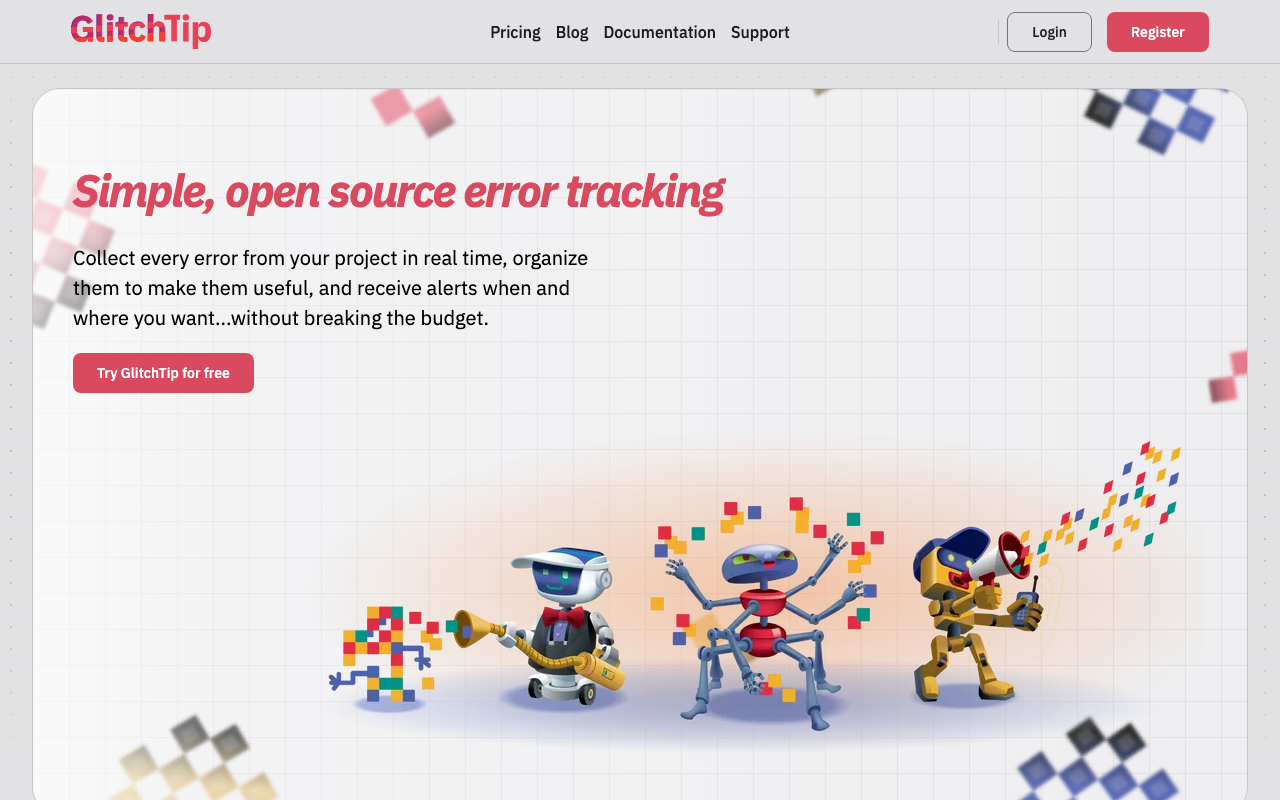
GlitchTip is the tier-two default: an open source error tracker implementing the Sentry event protocol, built as a Django application with PostgreSQL and a Redis-backed worker. That stack is the point — it is a shape most teams already run, back up and monitor, so the marginal operational load is small and the skills are not specialised. It implements Sentry’s error tracking and deliberately not the platform around it.
Pros
- Official Sentry SDKs work by changing the DSN, so instrumentation is standard and reversible
- Django and PostgreSQL is a bounded, familiar deployment with no exotic data stores
- OSI-approved open source licensing, which is the specific reason it beats self-hosted Sentry for policy-constrained teams
- A hosted plan exists, so you can start managed and self-host later without touching code
Cons
- Tracks Sentry’s error features, so replay, profiling and richer tracing envelope types are absent or partial
- Grouping is simpler than Sentry’s, with fewer levers when a catch-all handler merges unrelated bugs
- PostgreSQL growth and retention pruning are your responsibility from day one
Best for: Teams that want Sentry-SDK error tracking inside their own network with a footprint their existing operations practice already covers.
Pricing: Free to self-host at infrastructure cost, with a hosted plan metered on event volume.
Bugsink
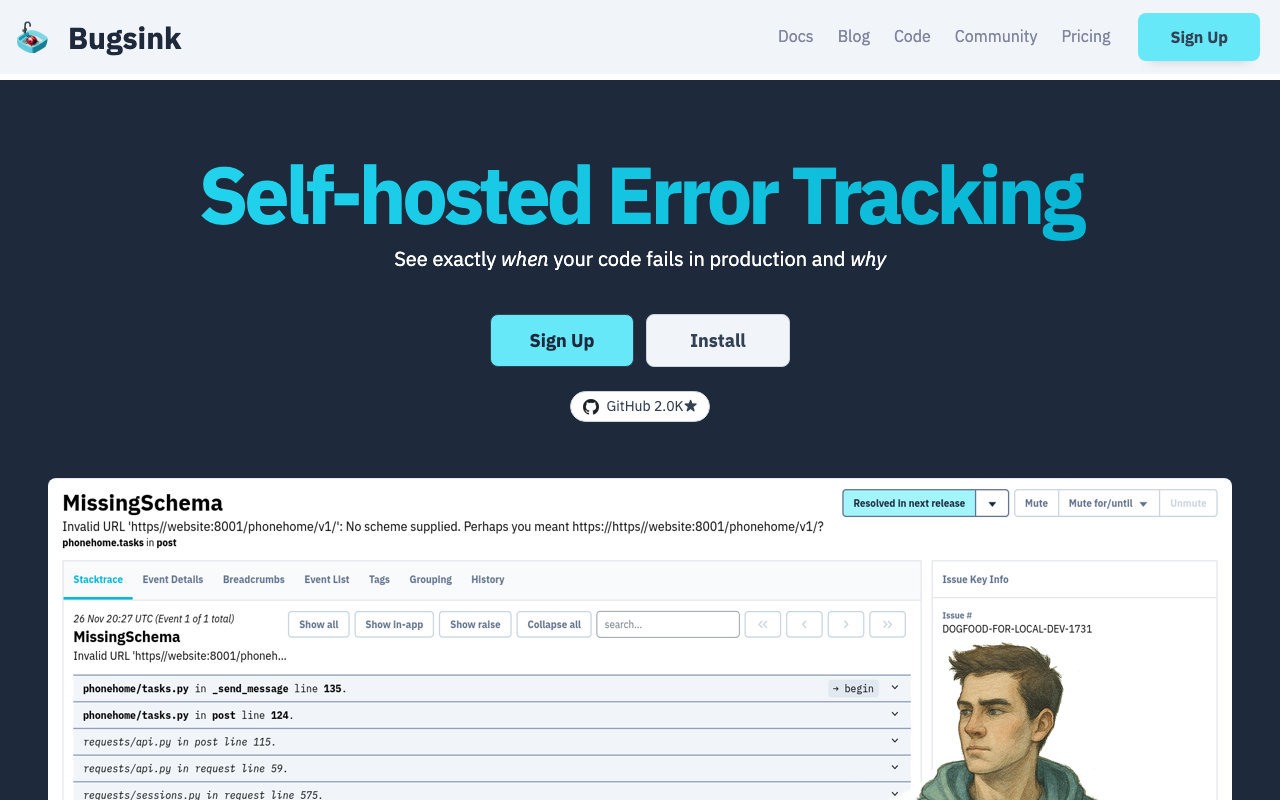
Bugsink is the tier-one option and the most honest fit for what most teams actually need. It speaks the Sentry protocol and is designed to run as a single container against a single conventional database, with bounded disk usage as an explicit design goal rather than a configuration you discover later. The bet is that a small team does not want a platform, it wants somewhere for exceptions to land that stays working without attention.
Pros
- Single container plus a normal database — the lowest operational commitment available here
- Retention and disk limits are designed in, which directly addresses the failure mode that kills self-hosted deployments
- Sentry-SDK compatible, so adoption is a DSN change and leaving is another one
- Small enough in scope that one engineer can understand the whole system
Cons
- Narrow by design: no tracing, no replay, limited dashboards, few integrations
- Young project with a small ecosystem, so continued maintenance is a bet you are taking
- Licensing is not a permissive OSI licence by default; read the terms if that is a requirement
Best for: Small teams and solo operators who want self-hosted error tracking they can install in an afternoon and ignore for a year.
Pricing: Self-hosted with licence tiers by team size plus infrastructure cost; no per-event metering.
Self-hosted Sentry
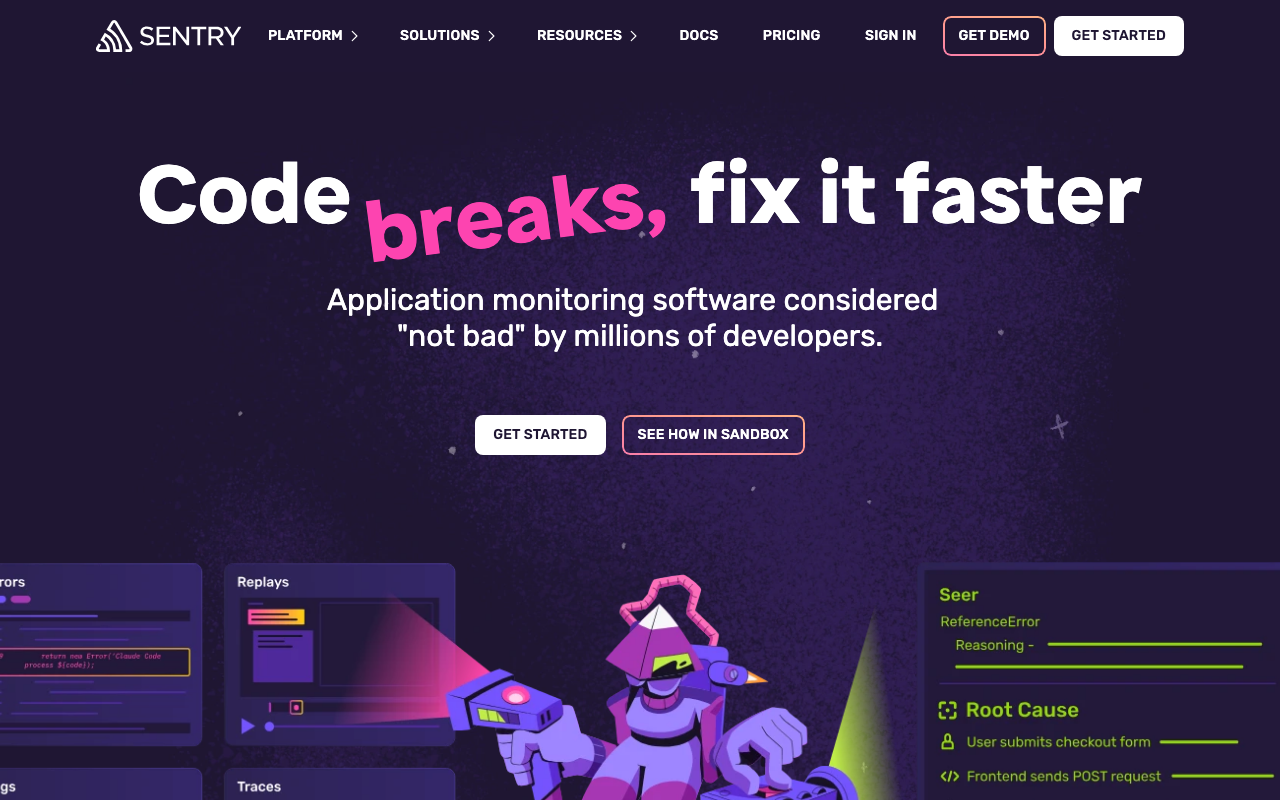
Self-hosted Sentry is tier three and it is the real product, not a cut-down edition — the same grouping, symbolication, release health and SDK matrix as the hosted service. The cost is the architecture that makes that possible: an ingest relay, processing workers, a symbolication service, Kafka, ClickHouse, Redis and PostgreSQL, all of which you now run. Teams that adopt it to escape a bill and assign it to nobody end up worse off than they started.
Pros
- Full feature parity in grouping, fingerprint rules, symbolication and release health — nothing else self-hosted comes close
- The complete SDK matrix, so every language and framework in your estate is covered on day one
- Data never leaves your infrastructure, including local variables and request bodies in stack frames
- Genuinely scales, because the architecture is the one running the hosted service
Cons
- Several services with several data stores, including Kafka and ClickHouse, each with its own operational behaviour
- Upgrades involve ordered migrations across those stores and are not something to attempt during an incident
- Resource requirements are substantial even for modest event volumes, so the infrastructure bill is not trivial
Best for: Organisations that need Sentry’s full capability inside their own boundary and have a platform team that will own the deployment by name.
Pricing: No licence fee for self-hosting; cost is infrastructure across several services plus the engineer who owns upgrades.
Highlight.io
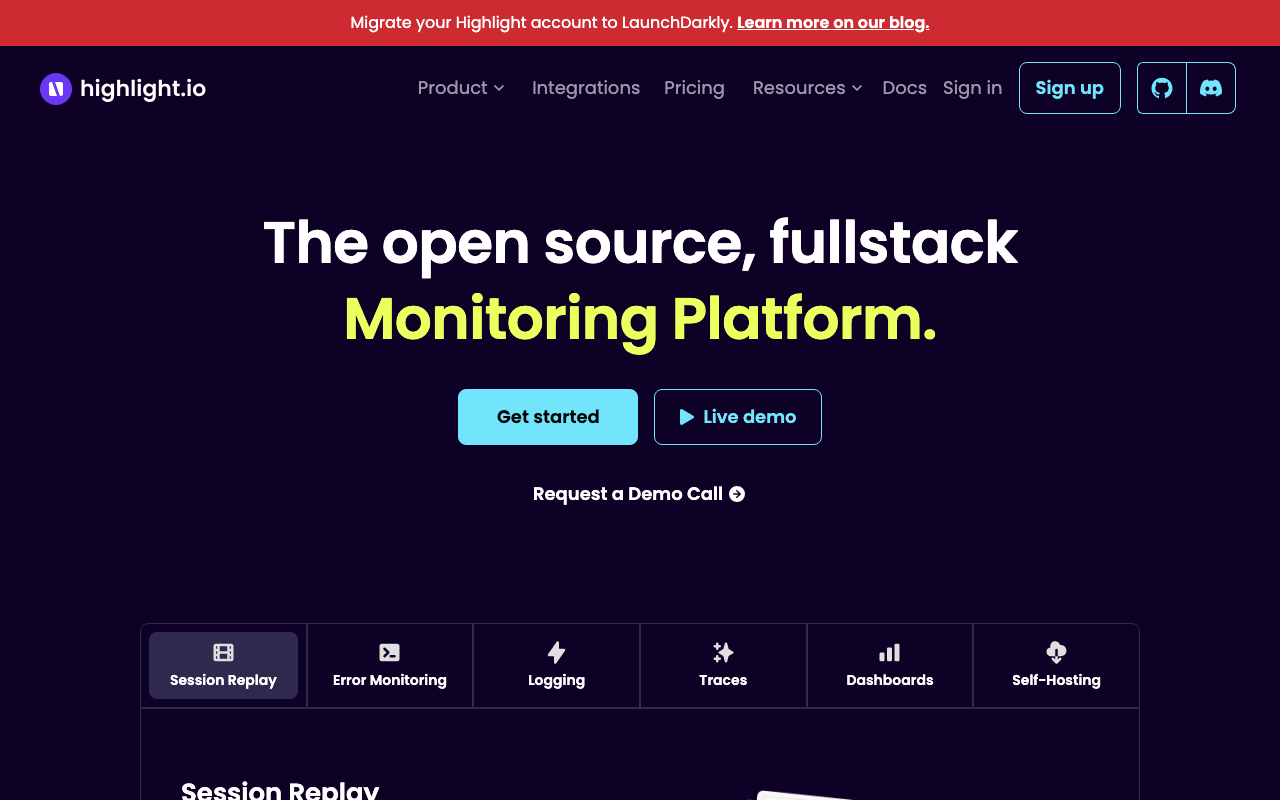
Highlight.io pairs session replay with error monitoring and backend logging in one self-hosted project, which is a combination nothing else on this list offers. Status first, though: the hosted service was deprecated on February 28, 2026 and the commercial product now lives inside LaunchDarkly Observability, so this is a self-host option only. If replay is the reason you would otherwise stay on a hosted platform, this is the open source answer, and it is tier three in effort.
Pros
- Replay, errors and backend logs in one project, so frontend-to-backend correlation is a design property rather than an integration
- Self-hosting keeps session recordings inside your boundary, which is a bigger privacy win than it is for errors alone
- OpenTelemetry alignment on the backend keeps server instrumentation portable
- Fully open source, which answers the residency and policy questions completely
Cons
- No hosted tier; if you want someone else to run it you are evaluating LaunchDarkly Observability instead
- A single-vendor open source project whose vendor has moved on is a maintenance bet you are making deliberately
- Session recording is storage-heavy and operationally demanding well beyond an error tracker, and adopting it is a re-instrumentation project rather than a DSN change
Best for: Teams that need replay and errors inside their own infrastructure and have capacity to run a recording pipeline.
Pricing: No hosted tier to price; self-hosting converts cost entirely into storage, compute and operator time.
SigNoz
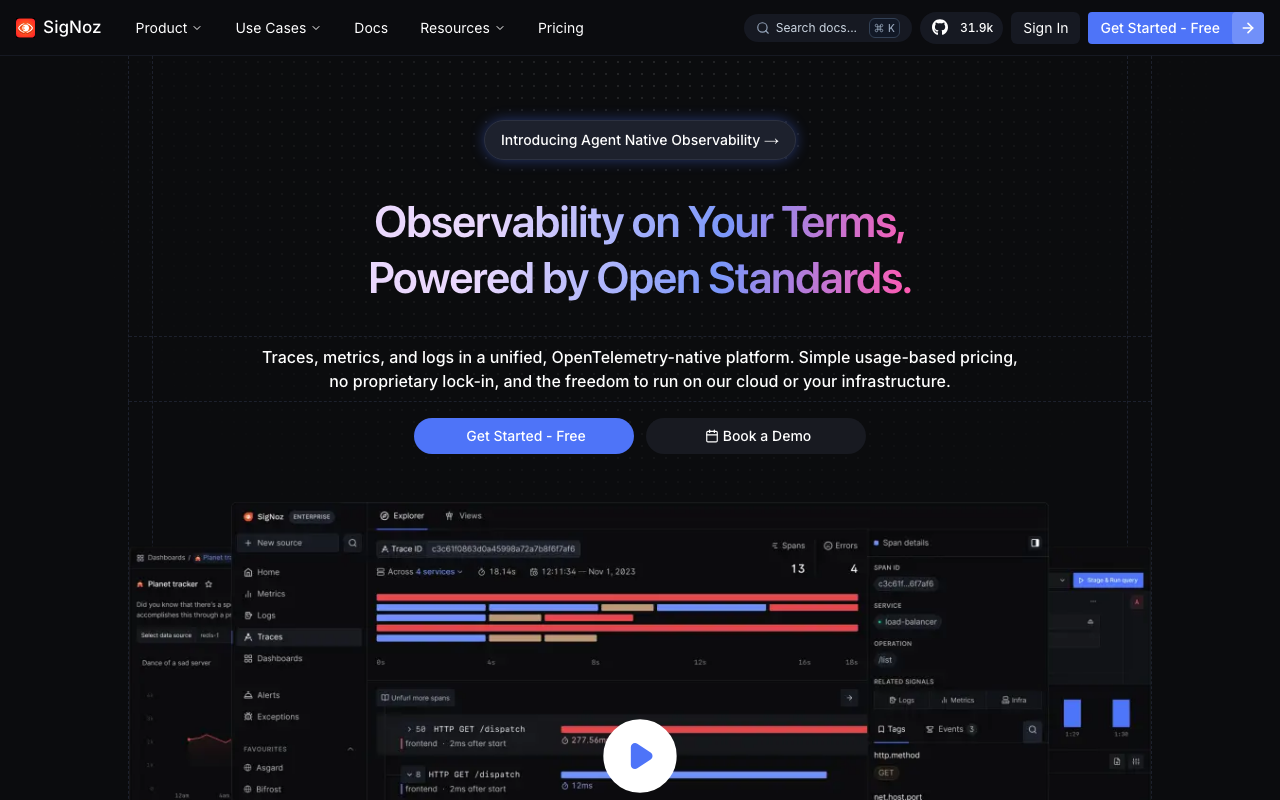
SigNoz is an OpenTelemetry-native platform on ClickHouse where errors are one view over telemetry you are already collecting — exceptions recorded on spans and error-level log records, grouped into a list you can work. If you are self-hosting observability anyway, adding a separate error tracker is a second system for data you already have. If you are not, this is a much larger commitment than an error tracker.
Pros
- Errors, traces, metrics and logs in one self-hosted store, so an exception opens into the trace that produced it
- ClickHouse handles high-cardinality attributes, so per-tenant and per-endpoint dimensions stay queryable
- Pure OpenTelemetry ingest means no vendor SDK in your dependency graph and full instrumentation portability
- Actively developed with a commercial company behind it, plus a managed cloud if you change your mind
Cons
- Errors follow your trace sampling and instrumentation coverage, so it is not equivalent to an error SDK that captures every exception
- Grouping and issue workflow are thinner than a dedicated error tool — no fingerprint rules, weaker triage state
- Self-hosted ClickHouse is real operational work as volume grows
Best for: Teams already self-hosting OpenTelemetry observability who want error triage over the telemetry they collect rather than a separate system.
Pricing: Open source and self-hostable at infrastructure cost, with a managed cloud metered on ingest volume and retention.
OpenObserve
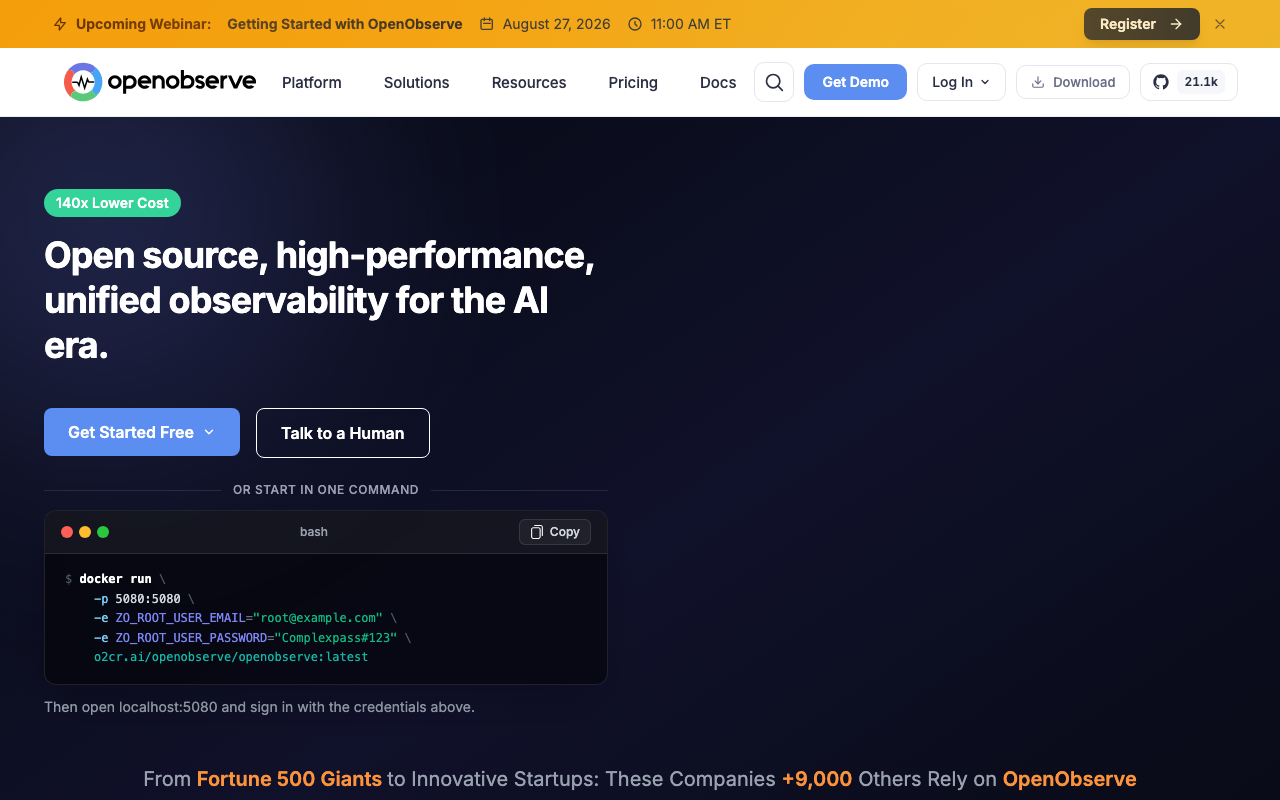
OpenObserve’s differentiator is storage design: it targets object storage as the primary backing store rather than local disks, which changes the economics of retention more than any feature comparison does. For self-hosted error and log data — where the whole problem is that volume grows and disks do not — that is the relevant property. It covers logs, metrics, traces and frontend monitoring in one binary-plus-object-store deployment.
Pros
- Object storage as the primary store means retention is a bucket policy rather than a disk expansion project
- Simple deployment for the breadth it covers, which is unusual in this tier
- Logs, metrics, traces and frontend data in one system, so errors sit next to their context
- OpenTelemetry ingest keeps instrumentation portable
Cons
- Error tracking is a feature of an observability platform, not a purpose-built issue workflow with fingerprint control
- Object-store query latency is a different performance profile than a local-disk store; verify it against your triage habits
- Younger project than the incumbents, with a correspondingly smaller ecosystem
Best for: Teams whose main self-hosting constraint is storage cost and who want errors alongside logs and traces in one system.
Pricing: Open source and self-hostable, with cost dominated by object storage; a managed cloud is metered on ingest and retention.
Uptrace
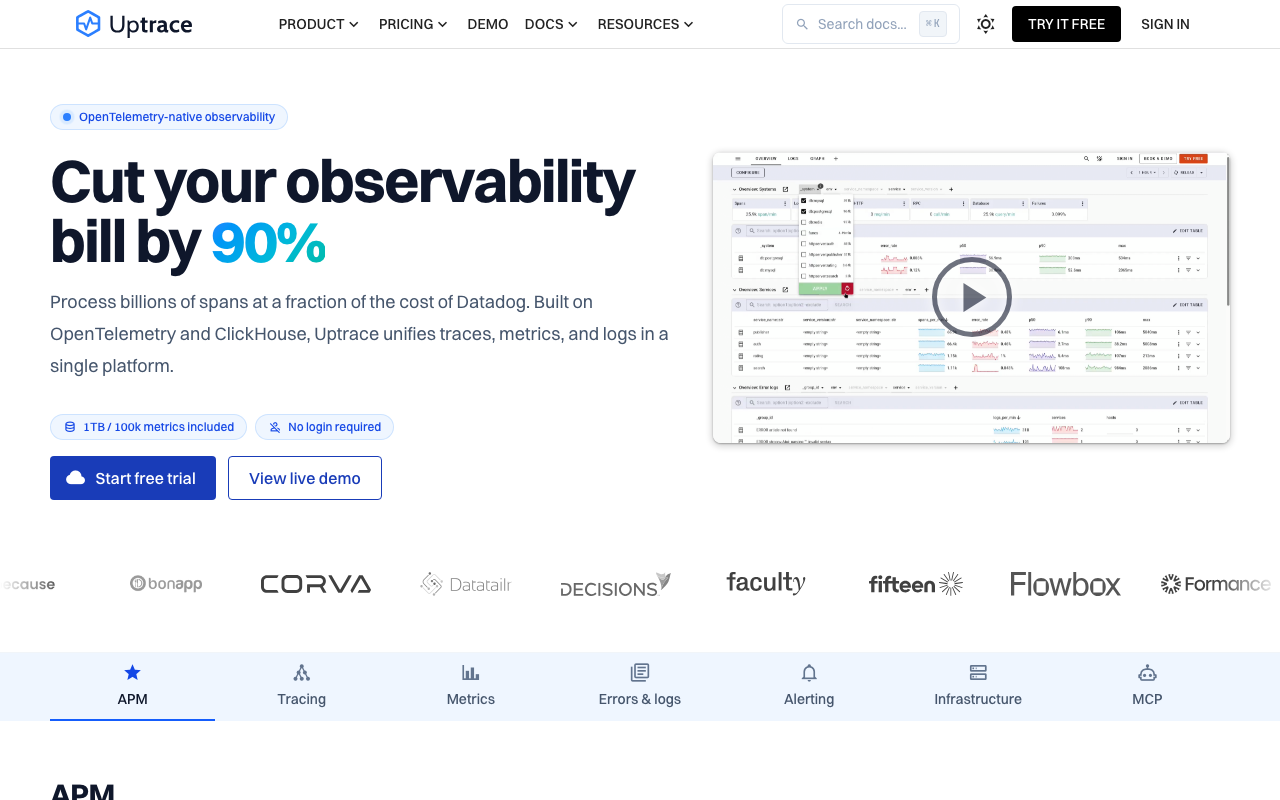
Uptrace is a smaller OpenTelemetry backend on ClickHouse, and its appeal in this context is proportion: it gives you traces, logs, metrics and error grouping without the footprint of the larger platforms. For a team that wants one self-hosted place for telemetry and does not have a platform team, the smaller thing that covers the need beats the bigger thing that covers more.
Pros
- Compact deployment for an OpenTelemetry backend, appropriate for teams without a dedicated platform function
- ClickHouse storage keeps high-cardinality attributes and long retention affordable
- Standard OTLP ingest, so instrumentation is portable to any other backend later
- Errors, traces and logs share a store, so context is one query away
Cons
- Error workflow is basic next to a dedicated tracker — expect grouping and triage state, not fingerprint rules and ownership routing
- Exception capture depends on your OpenTelemetry instrumentation quality, which is uneven across languages
- Still ClickHouse operations, which is the real cost regardless of how small the application is
Best for: Small teams that want one modest self-hosted OpenTelemetry backend covering errors alongside traces and logs.
Pricing: Open source and self-hostable at infrastructure cost, with a managed offering metered on data volume.
When querying your logs is genuinely enough
Not every team needs an error tracker, and pretending otherwise is how small teams end up with three systems they do not maintain. If your application already writes structured logs with the exception type, message and stack trace as fields, a log store plus a saved query and a Grafana panel gives you a count of errors by type over time, an alert when a new type appears, and the full trace text on demand.
That is a real answer, and it is enough when you have one or two services, one language, all server-side, and a team small enough that everyone sees every alert.
It stops being enough at four specific points, and they arrive in this order:
- Grouping. You need to know that these two differently-worded messages are one defect and this identical-looking pair are two. A log query counts strings; that is not the same operation.
- State. There is nowhere in a log index to record that someone looked at this and resolved it, so nothing distinguishes a new error from one you decided to live with.
- Symbolication. The moment you ship minified JavaScript or a compiled mobile binary, your log line contains frames named
aandtand hex addresses. A log store cannot resolve those; resolving them requires build artifacts uploaded at release time. - Context. Breadcrumbs, local variables per frame and the user or tenant affected are captured by an error SDK, not printed by your logger. The first bug that only reproduces for one customer is usually the moment this becomes obvious.
The first two are annoying. The last two are the point where the log-query approach stops being frugal and starts costing you incidents.
Needs first-hand data: Before adding an error tracker, run one month with a log-based error dashboard and count how many investigations ended in the log tool versus how many needed something it could not provide. That ratio tells you whether you have a tooling problem or a discipline problem.
Grafana Loki
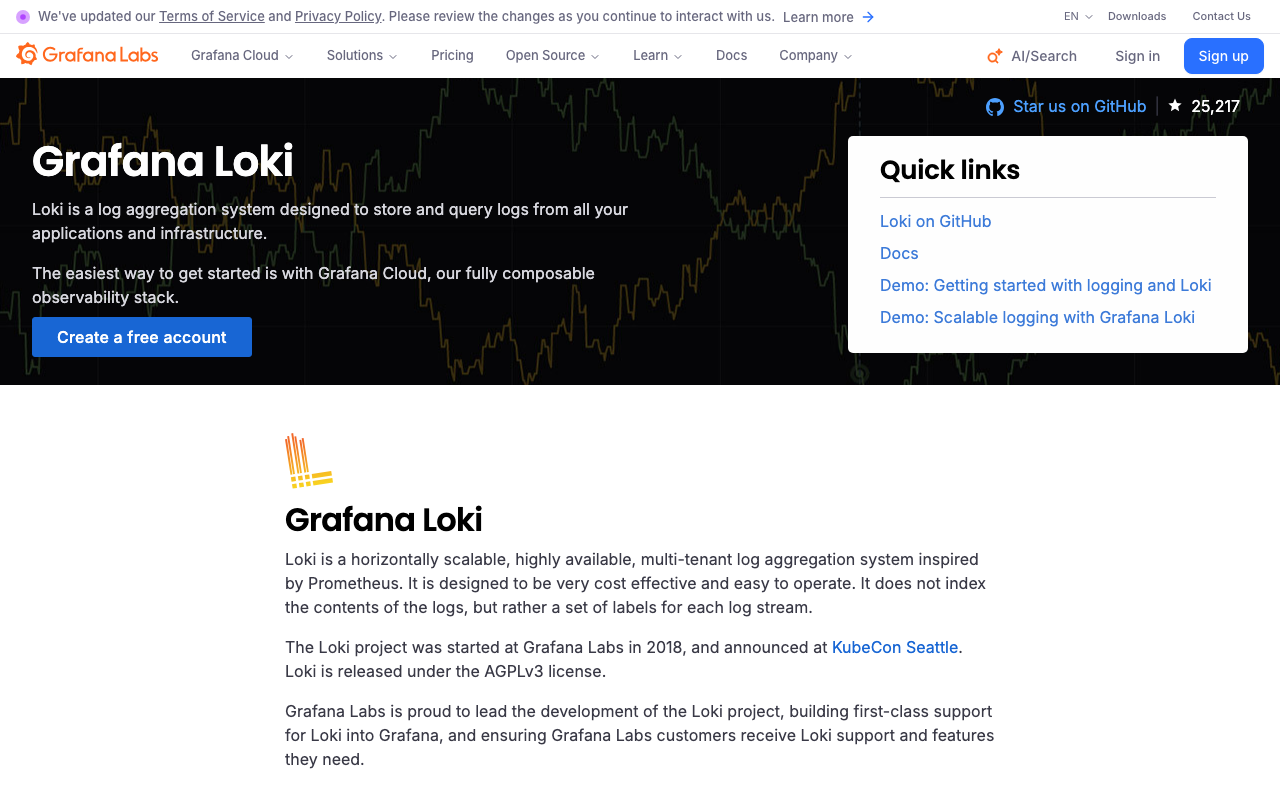
Loki indexes labels rather than log content and stores compressed chunks in object storage, which makes it cheap to keep a lot of logs and comparatively slow to search their contents. For error tracking specifically that trade is acceptable — you filter to one service and level by label, then scan a bounded window — and the fact that most teams already run Grafana means the dashboard and the alert have nowhere new to live.
Pros
- Very cheap retention because content is not indexed and chunks sit in object storage
- If Grafana is already deployed, an error-rate panel and an alert are a query away with no new system
- Label-based filtering makes narrowing to one service and level fast enough for triage
- Alerting on a new error signature is a genuinely useful early-stage substitute for issue state
Cons
- No grouping, no fingerprinting, no issue state — you are counting strings, and that is the core capability you are giving up
- Content search over a wide time range is a brute-force scan, so the slow queries are exactly the incident ones
- Label cardinality mistakes degrade the whole deployment, and error data invites exactly those mistakes
Best for: Small server-side teams already running Grafana who want error visibility without adding a system.
Pricing: Open source and self-hostable with cost dominated by object storage; Grafana Cloud meters on ingested volume and retention.
ClickHouse
ClickHouse is the other honest do-it-yourself answer: write exceptions as structured rows, and columnar storage with strong compression makes aggregation over hundreds of millions of them fast. Several products on this list use it as their backing store, which is the strongest argument that the shape fits. You are building an error tracker rather than buying one, and how far you take it is up to you — including a grouping key computed at write time, which recovers the single most important feature a log store lacks.
Pros
- Aggregation performance over very large event tables is excellent, so error-rate queries stay fast as volume grows
- Strong compression makes long retention affordable on ordinary disks
- Full SQL means you can compute a fingerprint at write time and get real grouping, unlike a log index
- The same cluster serves other analytical needs, so it is rarely a single-purpose expense
Cons
- You are building the product: ingest, schema, fingerprinting, deduplication, triage state and UI are all yours
- Operating ClickHouse well is a specialised skill, and the failure modes are not intuitive
- The build usually costs more engineering time than the tool it replaces costs in money
Best for: Teams that already run ClickHouse, have a genuine reason no product fits, and understand they are taking on a build.
Pricing: Open source and self-hostable at infrastructure cost; managed offerings meter on compute and storage.
How to choose
Pick the tier first, then the tool. The tier is a statement about your team, not about the software.
| Tier | Option | Take this when |
|---|---|---|
| One container | Bugsink | You want it installed and then invisible |
| One web app | GlitchTip | You want Sentry SDKs and a Django-shaped footprint |
| Platform | Self-hosted Sentry | You need full capability and will staff it |
| Platform | SigNoz, OpenObserve, Uptrace | You are self-hosting observability anyway |
| Platform | Highlight.io | Replay must stay inside your boundary |
| Build it | Loki or ClickHouse | You have one service and no minified code, or you have a real reason to build |
Then do three things before you commit. Configure retention and per-issue caps on day one. Restore a backup once, deliberately, before you depend on it. And verify symbolication end to end for every artifact type you ship, because the self-hosted tool that shows minified frames is worse than no tool at all.
If none of that sounds appealing, that is a legitimate conclusion. The error tracking hub and Sentry alternatives cover the managed options, and self-hosted observability stacks covers the wider version of this decision.
Frequently asked questions
Is Sentry open source?
Not under the OSI definition. Sentry’s self-hosted distribution ships under the Functional Source License, which allows use, modification and redistribution but restricts competing commercial use, and converts to an OSI-approved licence after a defined delay. You can run and modify it freely; if your policy requires OSI-approved licences specifically, GlitchTip is the usual answer.
Can I use Sentry SDKs with a self-hosted alternative?
With GlitchTip and Bugsink, yes — both implement the Sentry event protocol, so you change the DSN and keep your instrumentation. Coverage is strongest for error events; newer envelope types such as session health, cron check-ins and replays vary, so test the specific features you rely on before cutting over.
How much disk does self-hosted error tracking need?
That depends entirely on your worst incident, not your average traffic, because one retry loop can generate more events in an hour than a normal month. Size against your worst historical spike, set a hard retention window and per-issue event caps before you go live, and sample noisy issues in the SDK rather than storing them.
Related reading
- Best error tracking tools — grouping, symbolication and quota behaviour across the whole category.
- Sentry alternatives — which alternative answers which reason for leaving.
- Best error tracking tools for startups — when self-hosting is the wrong use of a small team’s attention.
- Best self-hosted observability stacks — the same decision for metrics, logs and traces together.
- Best open source APM and observability tools — the platforms that treat errors as one signal among several.
- Best log management tools — if the log-query route is the one you are taking.