Most teams do not have an alerting tool problem. They have an alert design problem, and they try to buy their way out of it.
The symptom is familiar. A deploy goes bad at 02:40 and the pager fires forty-one times in six minutes, because forty-one pods failed their readiness probe and each one had a rule. Someone acknowledges all of them, fixes the deploy, and goes back to bed. Two weeks later the same pager fires once, for something real, and nobody wakes up — because the last thirty pages were noise and the muscle memory now says “acknowledge and check in the morning.”
No product fixes that. What the products do is provide three distinct pieces of machinery, and the confusion about which piece you are buying is why teams end up with overlapping subscriptions and still get paged forty-one times.
Sort the vocabulary first, because it genuinely decides your shortlist:
- A rule evaluates a query on a schedule and produces an alert.
avg(rate(http_requests_total{status="5xx"}[5m])) > 0.05, evaluated every 30 seconds. It lives where your data lives. - A router takes those alerts and decides which ones become one notification: deduplicating identical alerts, grouping related ones, suppressing alerts caused by another alert, and honouring silences.
- A notifier delivers to a human and keeps escalating until someone acknowledges: schedules, rotations, push, SMS, phone calls, and a second person if the first does not answer.
Prometheus Alertmanager is a router with a thin notifier. PagerDuty is a notifier with a light router. Grafana Alerting is a rule engine plus a router with basic notification. Datadog Monitors is a rule engine with a router and a notifier attached. Teams buy two products that overlap on the router and neither of which does the layer they actually needed.
Key takeaways
- Rule, router and notifier are three layers. Most overlapping tool spend comes from buying two products that do the same middle layer.
- Grouping and deduplication are what turn one bad deploy into one page instead of two hundred; inhibition is what stops a node-down alert paging you for the forty pods it killed.
- A
for:duration only counts contiguous true evaluations, so a check that flickers around its threshold never fires — until the one night it does, at 3am.- Alert on symptoms your users feel, against an SLO, rather than on causes like CPU. The test of a page is whether it changed what a human did.
The three layers, and what each one actually does
Rules: where the decision is made
A rule is a query, a threshold, a duration and a set of labels. The query and threshold are the obvious part. The duration and the labels are where alert quality lives.
The duration — for: in Prometheus, “pending period” in Grafana, an evaluation window elsewhere — requires the condition to hold across consecutive evaluations before the alert fires. The mechanic people miss is that it is contiguous: if the expression evaluates false once during the window, the alert returns to inactive and the clock restarts from zero. A metric oscillating either side of its threshold therefore produces no alert at all while the underlying problem is real, and then fires the moment the oscillation stops mattering. The fix is not a longer for: — it is a query that does not oscillate, usually a longer rate window or a percentile instead of a max.
The labels on the rule become the identity of the alert downstream. alertname, severity, cluster, service, team are what every routing and grouping decision is made from, so a rule that omits service produces an alert nobody can route. Annotations — summary, description, runbook link — are the payload the human reads at 3am, and a runbook link is the single highest-value field in the whole system.
Routers: turning many alerts into one page
The router is the layer that most decides whether your pager is usable.
Deduplication collapses identical alerts. This matters more than it sounds because rule engines re-send firing alerts continuously — Prometheus re-sends every evaluation interval so the router can tell “still firing” from “resolved” by timeout. Without dedup you would get a notification every fifteen seconds for the same problem.
Grouping collapses related alerts into one notification. In Alertmanager this is group_by, plus three timers that are worth understanding because they are the difference between one page and a flood:
group_wait— how long to hold the first alert of a new group, waiting for its siblings. Short enough to be responsive, long enough to catch the rest of the deploy failing.group_interval— how long before sending an update for a group that gained new alerts.repeat_interval— how long before re-notifying about a group that is still firing and still unacknowledged.
Grouping by alertname and cluster turns “forty-one pods failed readiness” into one notification with forty-one entries. Grouping by pod turns it back into forty-one pages. This single config line is responsible for a large share of pager fatigue in Kubernetes shops.
Inhibition is grouping’s more powerful cousin and is badly underused. An inhibition rule says: while alert A is firing, suppress alert B, where A and B share some labels. Node down suppresses every pod alert on that node. A cluster-wide severity: critical suppresses the severity: warning alerts with the same service. Datacenter unreachable suppresses everything in it. Without inhibition, every large failure produces its own alert storm, and the storm buries the one alert that names the cause.
Silences and maintenance windows are the same mechanism used deliberately. A silence is a label matcher with an expiry. The operational rules that matter: always require an expiry, because a permanent silence is a deleted alert with extra steps; always require a comment naming who and why; and review active silences weekly, because the silence added during last month’s migration is now the reason nobody noticed the disk filling.
Notifiers: getting a human out of bed
The notifier owns schedules, rotations, escalation policies and delivery. Its job is narrow and physically constrained: a push notification is free and unreliable if the phone is in Do Not Disturb; SMS costs money per message; a phone call costs more and is the only channel that reliably wakes people. That is why the paging layer is the one place teams reliably pay for software — the cost of an unwoken engineer is higher than the subscription.
Escalation policy evaluation is worth stating precisely because it is where paging tools differ: an alert is assigned to the current on-call for a schedule, a timer starts, and if no acknowledgement arrives before the timer expires it escalates to the next step — another person, another schedule, or a whole team. Acknowledgement stops escalation but not resolution. The two states are different and conflating them is how an incident gets acknowledged and then forgotten.
Needs first-hand data: Take every page from the last 90 days and mark each one: did a human take an action they would not otherwise have taken? The percentage that fails that test is your actual alert quality number, and it is the only metric in this article worth tracking over time.
SLOs, error budgets and burn-rate alerting
This is a practice, not a product. Every tool below can implement it and none of them will do it for you.
The premise is that alerting on causes — CPU above 80%, memory above 90%, queue depth above 1000 — produces pages that correlate weakly with whether anything is wrong. A service can run at 95% CPU and serve every request fine. It can sit at 20% CPU while every request fails. Cause-based alerts are a guess about what will hurt users, made in advance, and they age badly.
Symptom-based alerting inverts it. Define a service level indicator your users actually feel — the proportion of requests that succeed within some latency — and a service level objective, the target for that indicator over a window. The gap between the objective and 100% is the error budget: the amount of failure you have agreed is acceptable in that window.
Alerting then becomes a question about the budget rather than a threshold on a resource. Burn rate is how fast you are consuming the budget relative to spending it evenly across the window. A burn rate of 1 exhausts the budget exactly at the end of the period. A burn rate of 14.4 consumes 2% of a 30-day budget in one hour — that arithmetic is where the commonly cited multipliers come from, not from anyone’s measurement.
The practical pattern is multi-window, multi-burn-rate:
- A fast burn — a high multiplier over a short window, confirmed by a shorter window so the alert resolves quickly when it stops — pages a human immediately.
- A slow burn — a lower multiplier over a much longer window — creates a ticket. It means the service is degrading in a way that will exhaust the budget this month, which is a real problem and not a 3am problem.
Two windows are used together for a reason: the long window makes the alert significant, and the short window makes it stop firing promptly once the burn ends. One window alone gives you either a slow-firing alert or one that will not clear.
What this buys you is a small number of alerts per service that map to user pain, plus a defensible answer to “should we ship this risky change” — you have budget or you do not. What it costs is real work: picking indicators that reflect user experience, instrumenting them consistently, and the political job of getting a team to agree that 99.9% means you accept the other 0.1%.
Needs first-hand data: For one service, compute the last quarter’s SLI from existing data and back-test it: how many times would a fast-burn rule have fired, and would each of those have been a page you wanted? Do this before replacing any existing alerts, because a badly chosen indicator produces worse pages than the CPU alert it replaced.
Prometheus Alertmanager
Alertmanager is the router, and it is the reference implementation of everything in the router section above. Prometheus evaluates the rules and pushes firing alerts to it; Alertmanager deduplicates, groups by label, applies inhibition rules, honours silences and dispatches to receivers. It runs as a small stateless-ish binary, clusters via gossip for high availability, and its entire configuration is one YAML file you keep in version control.
Pros
- The grouping and inhibition model is the most expressive in this list and is pure configuration, reviewable in a pull request
- Runs anywhere, costs nothing, and has no dependency on a vendor being reachable to make routing decisions
- Clustered mode deduplicates across replicas, so an HA pair does not double-page
- Integrates as a source into every commercial pager here, so adopting it does not preclude buying a notifier
Cons
- Notification is where it stops: no schedules, no rotations, no escalation if nobody acknowledges, no acknowledgement concept at all
- The YAML routing tree is powerful and genuinely hard to reason about; a misordered
continuesends alerts somewhere you did not intend and you find out during an incident - Silences live in its own store with a basic UI, so silence hygiene is manual
- If you self-host it in the cluster it monitors, it can be part of the outage it should be telling you about
Best for: Prometheus-native teams who want alert routing as reviewable configuration and will pair it with a separate paging product.
Pricing: Open source with no licence cost; the expense is the infrastructure it runs on and the engineer who owns the routing tree.
Grafana Alerting
Grafana Alerting covers the first two layers in one product: rules evaluated against any datasource Grafana can query — Prometheus, Loki, SQL databases, cloud metrics — and a routing layer built on the Alertmanager model with notification policies, mute timings and silences in a UI. Its distinguishing feature is that a rule can span datasources, so “error rate from Prometheus while log volume from Loki is spiking” is a single rule rather than a correlation you do in your head.
Pros
- Rules across many datasources in one place, including databases and cloud provider metrics, not just Prometheus
- The Alertmanager routing model with a UI, which makes grouping and mute timings accessible to people who will not edit YAML
- Rules can be provisioned as code, so you get the UI without giving up version control
- Alert rules live next to the dashboards people already look at, which shortens the path from graph to alert
Cons
- Notification is basic compared to a real pager: schedules and escalation belong to Grafana IRM, a separate product
- Rule evaluation happens in Grafana, so Grafana becomes a component in your alerting availability chain
- The unified alerting model changed substantially from earlier versions and older migration advice is still in circulation
- Complex multi-datasource rules are harder to test and reason about than a single PromQL expression
Best for: Teams already using Grafana as their query surface who want rules and routing without adopting a second config language.
Pricing: Open source and free to self-host; the managed cloud is metered on the underlying data volumes rather than on alerts.
Datadog Monitors

Datadog Monitors is all three layers inside the platform that already holds your data. Monitors evaluate metrics, logs, traces, synthetics and security signals; composite monitors combine them; downtimes handle maintenance windows; and notifications reach Slack, email or a pager. Because the data and the rule live together, things that are awkward elsewhere — alerting on a log pattern, on an APM error rate, on a trace-derived metric — are one form.
Pros
- Rules over every signal type Datadog holds, so alerting on logs and traces needs no export or second system
- Anomaly and forecast monitor types remove the threshold-picking problem for seasonal metrics
- Composite monitors and downtimes provide grouping and maintenance windows without a separate router
- Notification templates carry graph snapshots and context, which is a meaningful quality-of-life difference at 3am
Cons
- Only alerts on data that is already in Datadog, so it is a reason to send more data there and increase the bill
- Escalation and on-call scheduling are thin next to a dedicated pager, so most teams still pay for one
- Monitor sprawl is real: hundreds of monitors created in the UI with no version control, no owner and no review
- Cost is coupled to ingest, so improving alert coverage often means increasing spend on a separate meter
Best for: Teams already committed to Datadog who want alerts over logs and traces without moving data anywhere.
Pricing: Included with the underlying data products rather than sold separately; the meter that grows is ingest and custom metrics.
PagerDuty

PagerDuty is the notifier, and it is the category-defining one: services, escalation policies, schedules with overrides, acknowledgement and resolution states, mobile push that can override Do Not Disturb, SMS and phone escalation, plus event rules that do routing and suppression before an incident is created. Nearly every monitoring product ships a PagerDuty integration, which makes it the default aggregation point when alerts come from six different systems.
Pros
- The deepest escalation and scheduling model here: layered rotations, overrides, follow-the-sun handoffs and per-step notification rules
- Event Orchestration handles deduplication, suppression and routing before a page exists, so it also covers the router layer
- Integrations with essentially every monitoring product, which is the practical reason it survives tool churn
- Mature mobile experience, which is the only part of a pager that matters at 3am
Cons
- Per-user pricing across a large engineering organisation is the most common reason teams look at alternatives
- Capable features live in higher tiers, so the price you evaluate is rarely the price you end up on
- It is a notifier, not a monitoring system: every alert still has to come from somewhere else
- The feature surface has grown well past what most teams use, and the configuration complexity comes with it
Best for: Organisations with many teams and many alert sources who need one dependable paging layer with serious scheduling.
Pricing: Per-user monthly subscription in tiers, with the more advanced routing and automation features gated to higher tiers.
Opsgenie
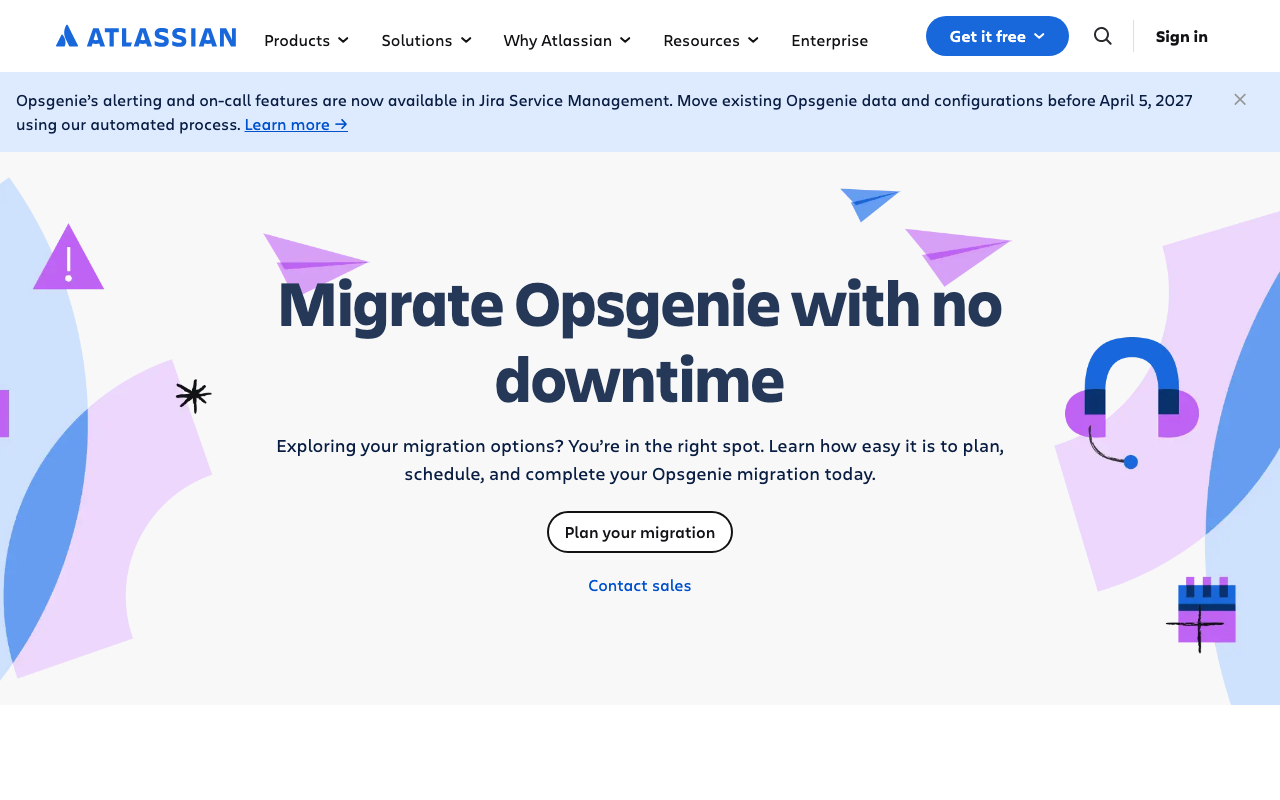
Opsgenie is being retired, and that is the only fact about it that should drive a decision today. Atlassian’s own Opsgenie page states that its alerting and on-call features now live in Jira Service Management, and that existing Opsgenie data and configuration must be moved before April 5, 2027. If you run Opsgenie you have a migration project with a date on it. If you are evaluating it new, do not.
Pros
- Long-standing alert routing, deduplication and escalation with a large integration catalogue
- Deep integration with the Atlassian estate, which is the migration path Atlassian is pointing customers toward
- Existing configuration and rotations can be moved rather than rebuilt from nothing
Cons
- A published end-of-life with a hard date for moving data and configuration, which makes new adoption indefensible
- The destination is Jira Service Management, so continuity means adopting a service management product, not just a pager
- Competitors are actively campaigning on the migration, so procurement conversations now start from a position of weakness
Best for: Existing customers, for exactly as long as it takes to run the migration to Jira Service Management or to a competitor.
Pricing: Per-user subscription tiers, now best read as the cost of the transition window rather than a long-term commitment.
ilert
ilert is a European alerting and on-call platform combining alert routing, schedules and escalation with status pages and call routing in one product. Its practical differentiator for teams in Europe is data residency and GDPR posture as a first-class property rather than an addendum, which shortens a procurement conversation that can otherwise stall for months.
Pros
- Alert routing, on-call scheduling, escalation and a status page in one subscription instead of three
- European hosting and data residency answered directly, which matters for regulated buyers
- Live call routing means voice can go to the on-call engineer, not only outbound paging
- Broad integrations including Prometheus Alertmanager, so it slots in as the notifier behind an existing router
Cons
- Smaller ecosystem than PagerDuty, so an obscure tool integration may need the generic webhook path
- Fewer worked examples and community configurations to copy when designing complex rotations
- Bundling status pages is only a saving if you actually want their status page
Best for: European teams who need on-call plus status pages with data residency answered before procurement asks.
Pricing: Per-user subscription tiers, with SMS and voice volumes allocated by tier rather than billed as a separate line.
Spike.sh
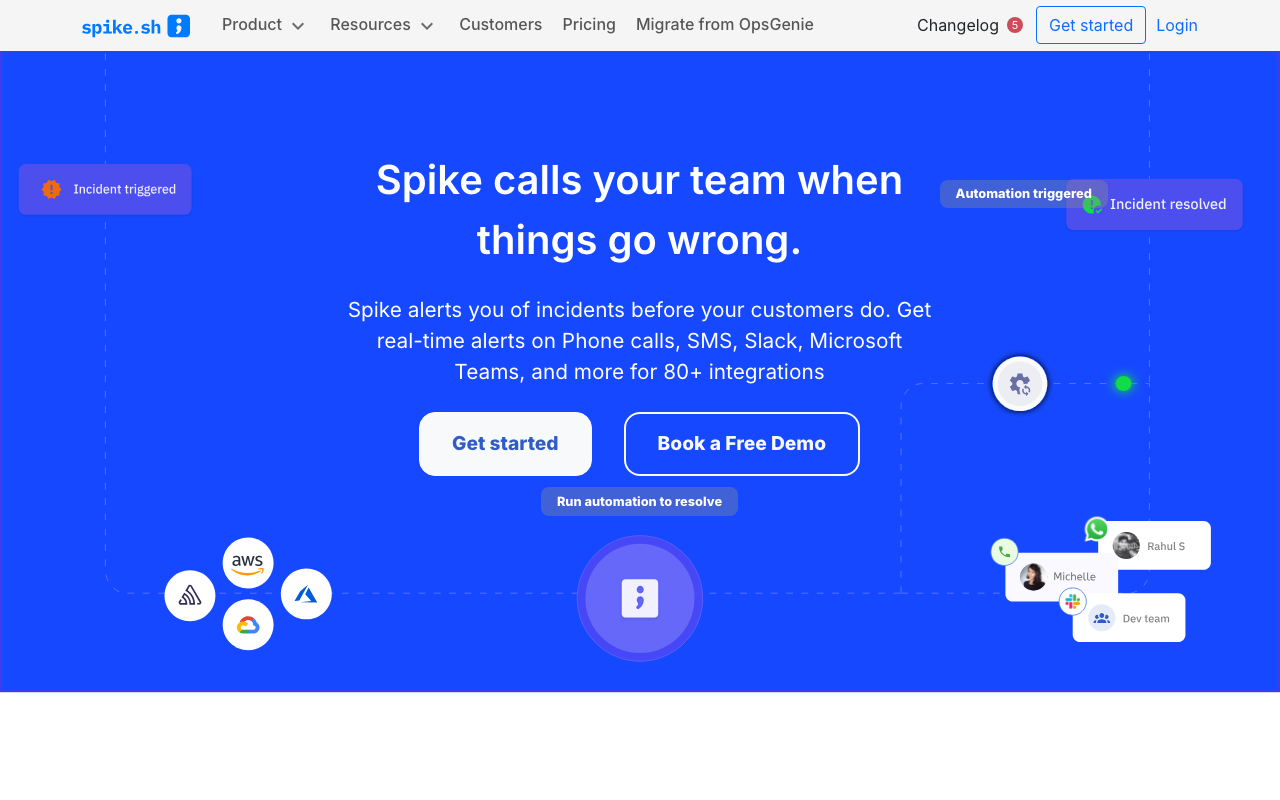
Spike.sh is a deliberately compact incident alerting and on-call product aimed at teams who want paging without the configuration surface of an enterprise platform. Its positioning is explicitly price-sensitive and migration-friendly — its navigation carries a “Migrate from OpsGenie” path, which tells you exactly which buyer it is chasing right now.
Pros
- Straightforward setup: services, escalation policies and rotations without a multi-week configuration project
- Priced for small and mid-sized teams, which is the most common reason for leaving the incumbents
- Explicit Opsgenie migration path at a moment when a lot of teams need one
- Covers the notifier layer properly — phone, SMS, push, escalation — which is what most teams actually need to buy
Cons
- Smaller integration catalogue, so unusual sources arrive by webhook and you shape the payload yourself
- Routing and suppression are simpler than Alertmanager’s or PagerDuty’s, so complex correlation belongs upstream
- Less well known in enterprise procurement, which can mean more security review work
Best for: Small and mid-sized teams who want reliable paging and rotations without enterprise pricing or enterprise configuration.
Pricing: Per-user subscription with a low entry tier; phone and SMS volumes are the variable to check against your page rate.
All Quiet
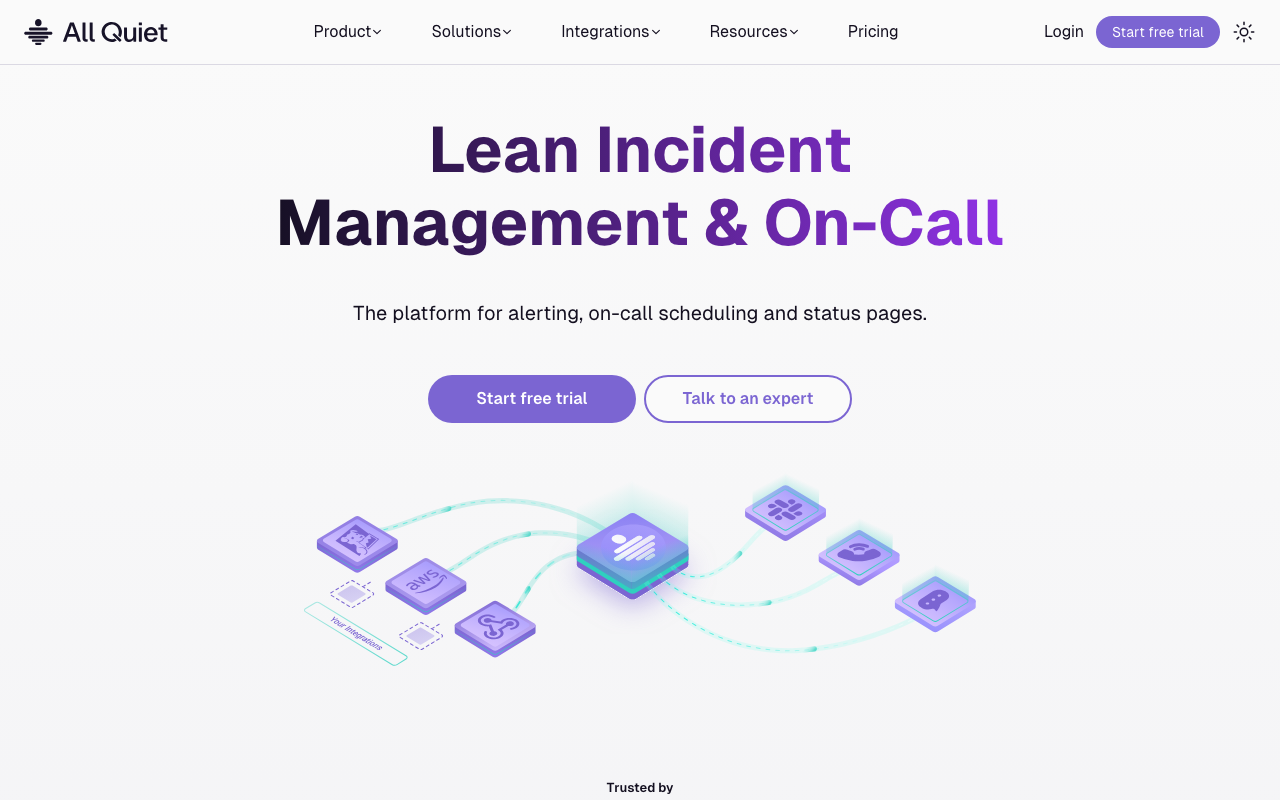
All Quiet is a newer on-call and incident alerting product with the same shape as Spike.sh — schedules, escalation, integrations, mobile paging — built for teams who find the incumbents oversized. Newness is both the appeal and the risk: a smaller, cleaner product to configure, against a shorter track record for the one system you need to work when everything else does not.
Pros
- Clean, small configuration surface: rotations and escalation without a certification course
- Accessible pricing including a free entry point, which makes evaluating it a genuine option rather than a sales cycle
- Modern integration set covering the common monitoring sources through webhooks and native connectors
- Mobile paging and escalation, which is the core function, is the focus rather than one feature among fifty
Cons
- Short track record for a component whose entire value is reliability during other systems’ outages
- Smaller integration catalogue and community than the established pagers
- Advanced routing, suppression and enterprise governance features are thinner than PagerDuty’s
Best for: Small teams setting up their first real on-call rotation who want something they can configure in an afternoon.
Pricing: Per-user tiers with a free entry level; check how SMS and voice are allocated, since that is the real variable cost.
IMR by Xurrent
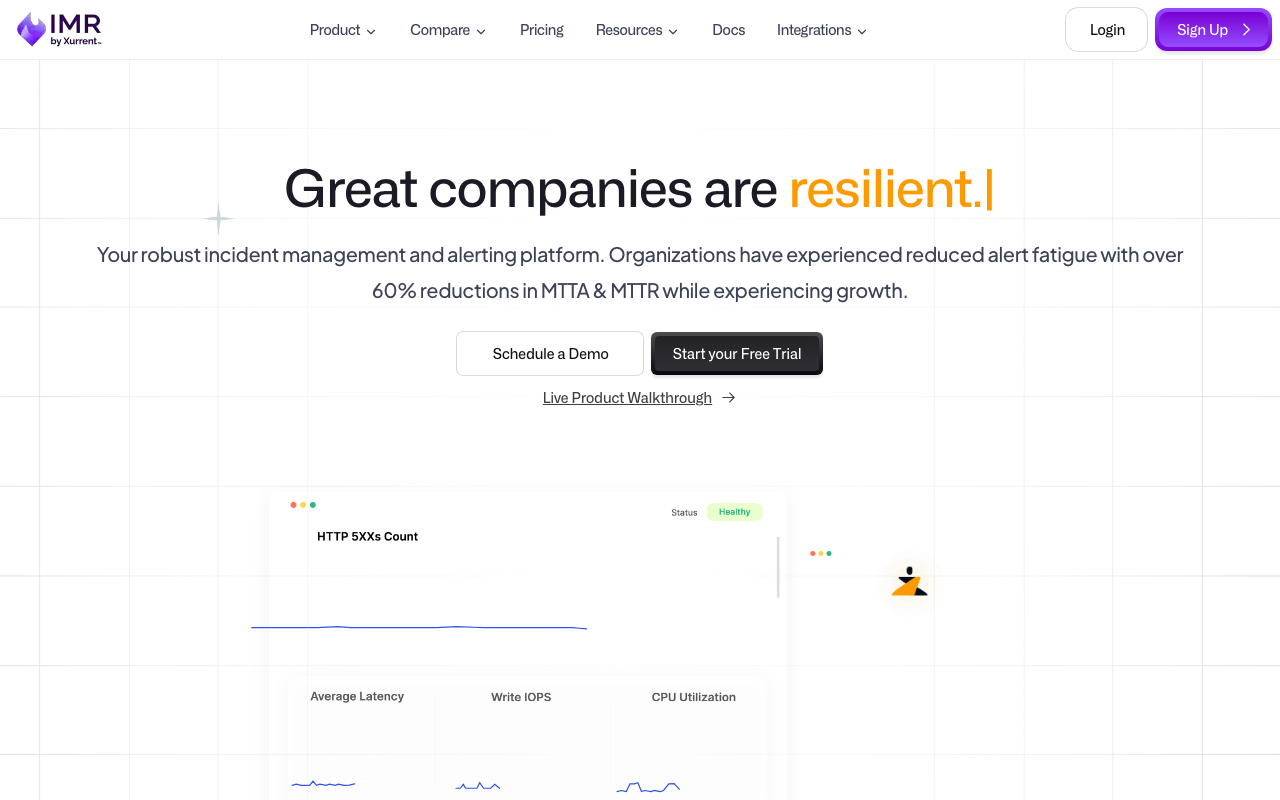
IMR by Xurrent is the product formerly known as Zenduty, now inside Xurrent’s service management portfolio. The underlying capability is a full incident response platform — alert routing and suppression, on-call schedules, escalation, incident response workflows and postmortems — and the change worth registering is context: it is now part of an ITSM vendor’s suite rather than a standalone on-call tool.
Pros
- Covers router and notifier layers together, including suppression rules and noise reduction before paging
- Incident response workflows and postmortem templates included rather than sold as a separate product
- Sits inside a service management suite, which is an advantage if your organisation already runs ITSM processes
Cons
- The rebrand means older documentation, community posts and integration guides still reference Zenduty, which makes research harder
- Being part of an ITSM suite pulls the roadmap toward service management rather than engineer-facing on-call
- Smaller mindshare among engineering teams than the products it competes with
Best for: Teams who want on-call, routing and postmortems in one product and are comfortable in a service management vendor’s ecosystem.
Pricing: Per-user subscription tiers covering on-call and incident response together rather than as separate SKUs.
Keep
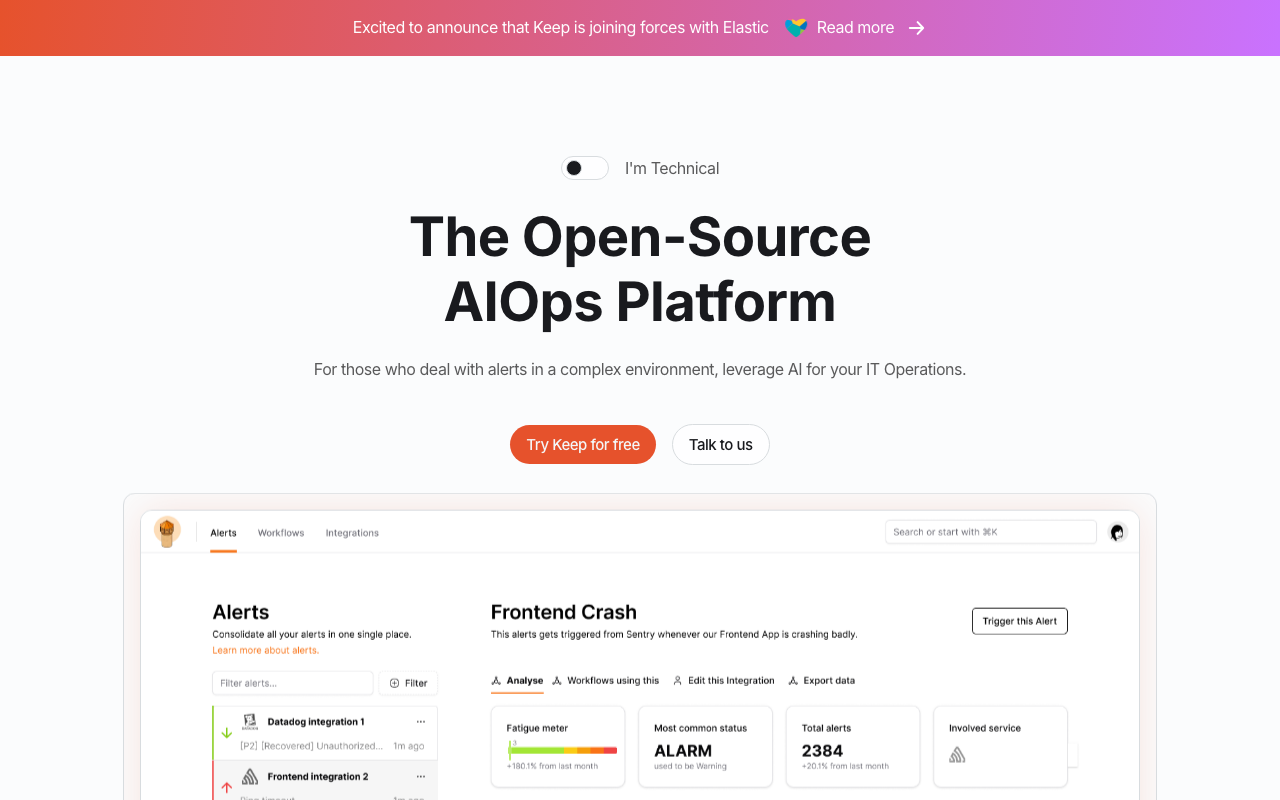
Keep is an open source alert management platform that sits squarely in the router layer: it ingests alerts from many monitoring tools, deduplicates and correlates them into higher-level incidents, and runs workflows in response. Think of it as a programmable Alertmanager that speaks to more than Prometheus. Its homepage carries a banner announcing that Keep is joining Elastic, which is material for anyone planning a long deployment on it.
Pros
- Aggregates alerts from many sources into one correlation layer, which is exactly what teams with six monitoring tools need
- Workflows in YAML, so enrichment and automated responses are reviewable code
- Open source and self-hostable, so the correlation layer does not require sending alerts to a vendor
- Fills the genuine gap between “we have alerts everywhere” and “we have one pager”
Cons
- Joining Elastic means the independent roadmap is now a larger company’s roadmap, which is a real consideration for a multi-year bet
- It is a router, not a notifier: schedules, escalation and phone calls still come from elsewhere
- Younger project, so unusual sources and correlation cases need more of your own work
- Self-hosting places another component in the path between an alert and a human
Best for: Teams with alerts from several monitoring products who want one open source correlation layer in front of their pager.
Pricing: Open source and self-hostable at infrastructure cost, with a managed offering for teams who do not want to run it.
Better Stack
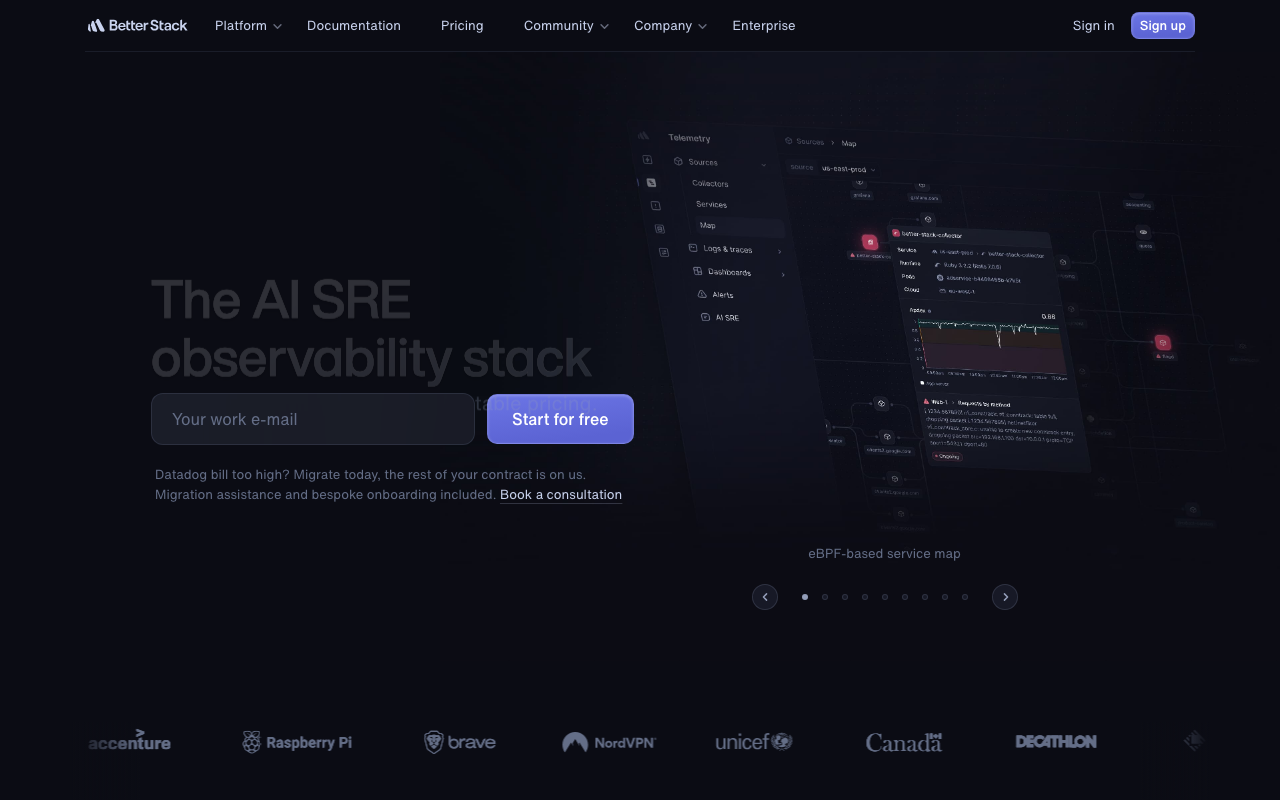
Better Stack bundles uptime monitoring, log management, on-call scheduling and status pages into one product, which makes it the consolidation option in this list. For a small team the appeal is direct: the thing that detects the problem, the thing that pages you, the logs you read next and the page your customers check are one subscription and one UI.
Pros
- Detection, paging, logs and status page in one product, removing three integrations and three invoices
- Monitoring and on-call in the same place means the alert has its context attached without a correlation step
- Quick to stand up, which matters for teams whose current state is no formal on-call at all
- Status page included, closing the loop from detection to customer communication
Cons
- Bundling means you get their opinion on each layer; if the log search or the routing model does not fit, you cannot swap just that piece
- The router layer is simpler than Alertmanager or PagerDuty Event Orchestration, so complex suppression belongs upstream
- Concentration risk: one vendor sits across detection, paging and customer communication
Best for: Small teams who want monitoring, paging, logs and a status page from one vendor rather than assembling four.
Pricing: Tiered subscriptions per product area with usage components for monitors and log volume, bundled under one account.
How to choose
Work down the layers rather than across the vendors.
Where do your alerts come from? If it is one platform that also holds your data, the rule and router layers are already bought and you only need a notifier. If it is four or five sources, you need a real router — Alertmanager if everything is Prometheus, Keep or a pager with strong event rules if it is not.
Do you need someone woken up? If pages go to a Slack channel during business hours, a router with a webhook is enough and you should not buy a pager. If a human has to wake up, buy the notifier — this is the one layer where the free option is genuinely worse, because SMS and voice cost money per message no matter what.
How many people are on the rotation? Per-user pricing decides this category more than features do. Five engineers can afford anything. Two hundred cannot afford PagerDuty’s list price without a negotiation, which is what the whole alternatives market runs on.
Are you on Opsgenie? Then your decision has a deadline. Atlassian’s stated path is Jira Service Management before April 5, 2027; every competitor here is campaigning for that migration. Deciding early is worth more than deciding perfectly.
| Option | Layer it covers | Picks itself when |
|---|---|---|
| Prometheus Alertmanager | Router | Everything is Prometheus and routing should be reviewable config |
| Grafana Alerting | Rules + router | Grafana is already the query surface across many datasources |
| Datadog Monitors | Rules + router + light notifier | Your data is in Datadog and you alert on logs and traces |
| PagerDuty | Notifier + router | Many teams, many sources, serious scheduling requirements |
| Opsgenie | Notifier + router | Never for new adoption — migrate before April 5, 2027 |
| ilert | Notifier + status page | European data residency is a hard requirement |
| Spike.sh | Notifier | Small team leaving an incumbent on price |
| All Quiet | Notifier | First real rotation, configured in an afternoon |
| IMR by Xurrent | Router + notifier + postmortems | You want on-call inside a service management suite |
| Keep | Router | Alerts arrive from six products and need correlating first |
| Better Stack | Detection + notifier + logs + status | One small team, one vendor, one bill |
Alerta deserves a mention outside the table: it is an open source alert console that consolidates alerts from many sources into one deduplicated view, which is genuinely useful as a router. Its homepage still headlines PostgreSQL 9.6 support in “Release 5,” which is a fair, checkable observation about how actively the public surface is maintained — take it into account before building a rotation on it. It is covered in more depth in the open source incident management guide.
Whatever you buy, the highest-return work is not in the tool. Delete alerts that have never once changed what a human did. Add inhibition rules so the cause suppresses the symptoms. Put a runbook link in every annotation. Those three changes cost nothing and will do more for your pager than any migration.
Frequently asked questions
What is the difference between Alertmanager and PagerDuty?
They do different jobs and are commonly used together. Alertmanager is a router: it takes alerts from Prometheus, deduplicates them, groups related ones, applies inhibition rules and silences, then dispatches. PagerDuty is a notifier: it takes an alert and gets a specific human to acknowledge it, escalating through schedules and rotations by push, SMS and phone until someone does. Alertmanager has no schedules or escalation; PagerDuty has routing but is not where your Prometheus rules live.
What happens to Opsgenie customers?
Atlassian’s Opsgenie page states that alerting and on-call features now live in Jira Service Management and that existing Opsgenie data and configuration must be moved before April 5, 2027. In practice that is a migration project with a fixed date: either into Jira Service Management or to a competitor. Several vendors — including Rootly, FireHydrant and Spike.sh — run explicit Opsgenie migration messaging, so the market for that move is active.
How do I stop one bad deploy paging me forty times?
Two configuration changes, in this order. Group by a label that describes the failure rather than the instance — alertname and cluster rather than pod — so forty pod failures become one notification with forty entries. Then add inhibition rules so a higher-severity alert suppresses the lower-severity alerts it caused: node down suppresses that node’s pod alerts, cluster critical suppresses the matching warnings. Deduplication alone does not solve this, because the forty alerts are genuinely different alerts.
Should I alert on CPU and memory?
Rarely as a page. Resource metrics are causes, and the relationship between a cause and user pain is a guess that ages badly — a service can be fine at 95% CPU and broken at 20%. Alert on symptoms your users feel, expressed against an SLO, and page on fast budget burn. Keep resource metrics as dashboards and as tickets, where they help you diagnose and plan capacity without waking anyone.
Related reading
- Best incident management tools — what happens after the page, from coordination to resolution.
- Best on-call scheduling tools — rotations, overrides and follow-the-sun handoffs in detail.
- PagerDuty alternatives — the per-user pricing exit routes, with the Opsgenie migration context.
- Best open source incident management — the self-hosted routing and paging options, and their limits.
- Best uptime and synthetic monitoring tools — external detection that produces the alerts these tools route.
- Best log management for Kubernetes — turning log-derived signals into alerts without paying to ingest noise.
- Best AIOps tools for incident response — the correlation layer, and which of its claims survive scrutiny.