“Open source incident management” is one phrase covering three different products, and most disappointment in this category comes from installing the wrong one.
Ask three engineers what they want and you get three answers. One wants a pager: schedules, rotations, escalation, a phone that rings at 3am. One wants noise reduction: six monitoring tools producing overlapping alerts and something in front of them that turns those into one incident. One wants coordination: an incident channel, a timeline, roles, a status update to customers, and a retrospective document afterwards.
The open source landscape covers these very unevenly. Paging has real options. Alert consolidation has a small number of genuinely useful projects. Incident coordination and retrospectives — the part with the most vendor money behind it commercially — has almost nothing credible that is open source, and pretending otherwise wastes a quarter.
Then there is the constraint nobody puts on a comparison page. Waking a human up costs money per message. Push notifications are free and unreliable, because a phone in Do Not Disturb ignores them. SMS and voice calls reliably wake people, they are billed per message by a telecom provider, and no amount of free software changes that. Every self-hosted pager needs your own Twilio-style account, your own number, your own delivery reliability, and your own bill. The software being free moves the cost, it does not remove it.
And one more, which is the strongest argument in the category: self-hosting your pager means your pager depends on infrastructure that may be part of the incident. A pager running in the cluster that just lost its control plane is not a pager. That is a real argument for buying the paging layer even when everything else in your stack is self-hosted — and it is why the honest version of this article includes hosted tools with usable free tiers at the end.
Key takeaways
- The phrase covers three products: paging and scheduling, alert routing and noise reduction, and incident coordination plus retrospectives. Open source is strong on the first two and weak on the third.
- Waking someone up requires SMS or a phone call, which costs money per message and needs a telecom account regardless of the software licence.
- Grafana has published that it is winding down Grafana OnCall as a standalone product, folding on-call into Grafana IRM, with the OSS repository archived — check that before building a rota on it.
- A self-hosted pager running on the infrastructure it monitors can be part of the outage. That is the main reason to buy this one layer even in a self-hosted stack.
The three things people mean, and which layer you actually need
Layer one: paging and on-call scheduling. Rotations, overrides, escalation policies, acknowledgement, and delivery that reaches a sleeping human. This is the layer that needs SMS and voice, and therefore the layer where “free” is least free. It is also the layer with the hardest availability requirement: it must work when everything else does not.
Layer two: alert routing and noise reduction. Deduplication so identical alerts collapse, grouping so one bad deploy is one incident, and suppression so a node-down alert does not drag forty pod alerts with it. This layer is well served by open source — Alertmanager for Prometheus shops, Keep or Alerta when alerts come from several products — and it is where the biggest quality improvement per hour of work lives. If your pager fires too often, the fix is almost always here rather than in the pager.
Layer three: incident coordination and retrospectives. Declaring an incident, opening a channel, assigning commander and scribe, keeping a timeline, updating a status page, and running a blameless retrospective afterwards. Commercially this is where incident.io, Rootly and FireHydrant compete. In open source there is essentially nothing that does the whole job, and the working answer for most teams is a Slack workflow plus a template repository plus discipline — which is unsatisfying and also genuinely fine. The postmortem tools guide covers what the commercial products add.
Being honest about that third gap is more useful than padding this list. What follows is strong on layers one and two, and says so where a tool does not cover layer three.
Needs first-hand data: Price a month of paging at your real volume. Count pages from the last 30 days, multiply by the number of people each page escalates to, and price that as SMS plus voice minutes with your telecom provider in every country your engineers live in. Compare it against the per-user cost of a hosted pager for the same headcount. The gap is usually smaller than teams assume.
Grafana OnCall and Grafana IRM
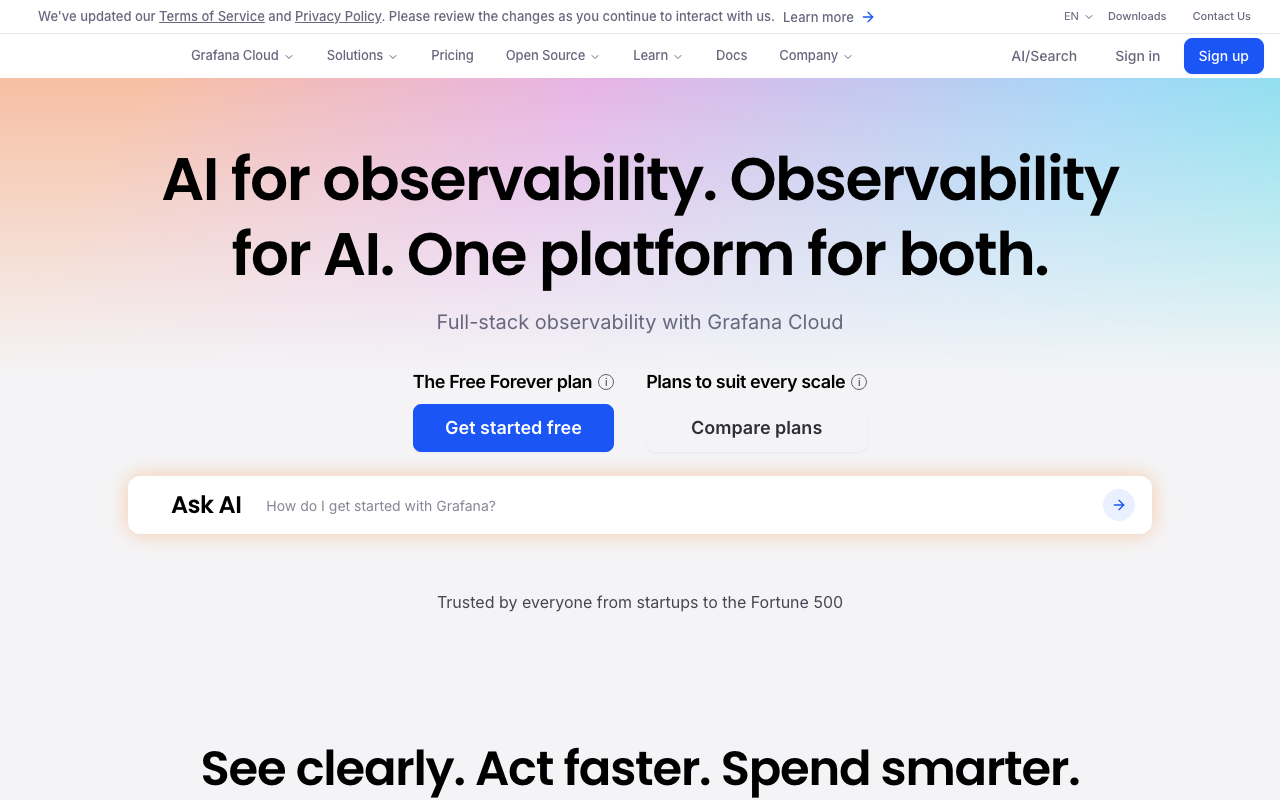
Grafana has announced that it is winding down Grafana OnCall as a standalone product, folding on-call capabilities into Grafana IRM, with the OnCall open source repository archived. That is Grafana’s published position, and it is the first thing anyone evaluating it today should know — building a rota on an archived repository is a decision, not a default.
The product itself was the strongest open source pager available: schedules defined in the UI or as iCal, escalation chains, integrations with Alertmanager and Grafana Alerting, and mobile push through a Grafana app. Its distinguishing feature was living next to the dashboards and alert rules, so the path from graph to rule to rotation stayed in one place. Grafana IRM continues that story as a Grafana Cloud product.
Pros
- Schedules, escalation chains and mobile push in a product that already understood your Grafana alert rules
- iCal-based schedules meant rotations could be defined in a calendar rather than a proprietary UI
- Existing deployments continue to run — an archived repository is not an uninstall
- Grafana IRM is a supported continuation path for teams already in Grafana Cloud
Cons
- The open source repository is archived, so new adoption means starting on a codebase that will not receive feature work
- The continuation is a Grafana Cloud product, which is a different commercial arrangement from self-hosting for free
- Mobile push depended on Grafana’s app and infrastructure, so the “fully self-hosted pager” story was never complete anyway
- Teams that adopted it as their self-hosted pager now have a migration to plan
Best for: Existing users planning a migration, and Grafana Cloud customers who want on-call inside the platform they already pay for.
Pricing: The archived open source project carried no licence cost; Grafana IRM is part of Grafana Cloud’s subscription tiers.
Prometheus Alertmanager
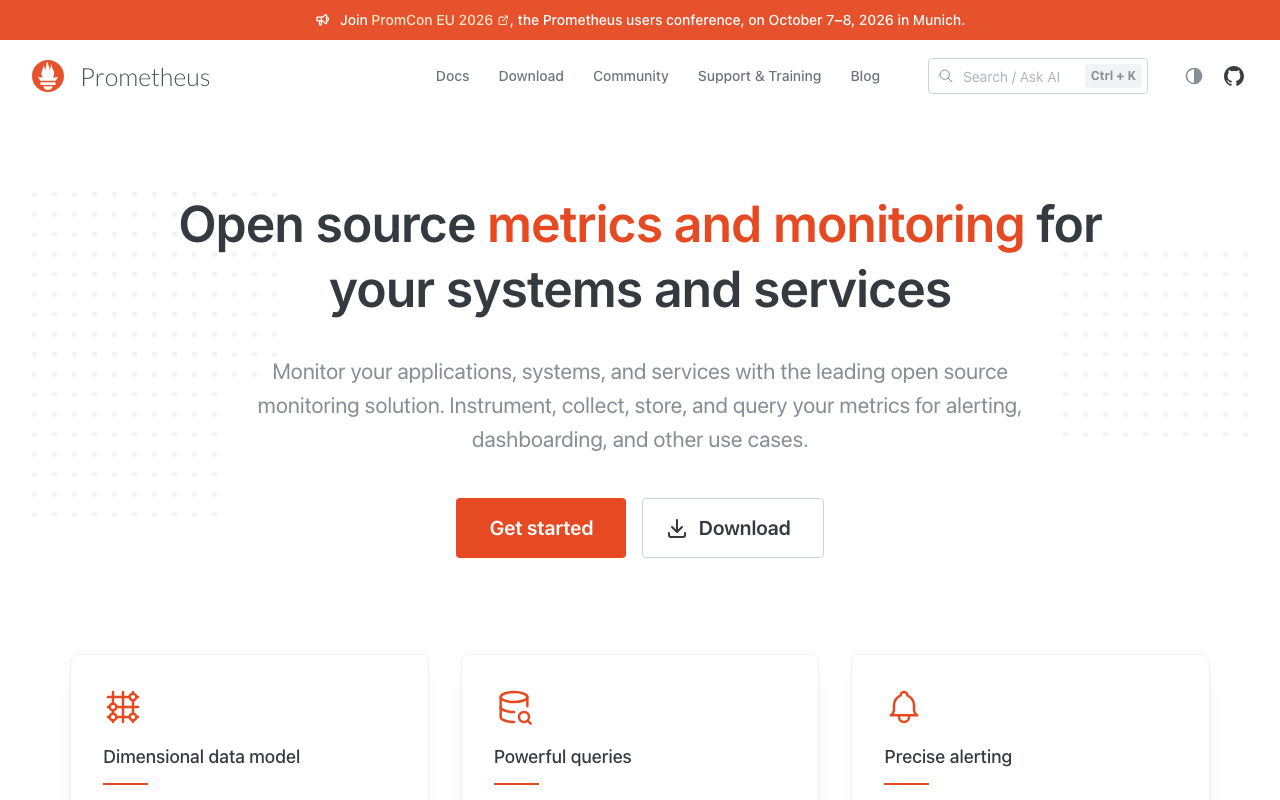
Alertmanager is layer two, and it is the reference implementation of it. Prometheus evaluates rules and pushes firing alerts; Alertmanager deduplicates them, groups by label, applies inhibition rules so a cause suppresses its symptoms, honours silences, and dispatches to receivers. Its whole configuration is one YAML file in version control, which makes routing changes reviewable in a pull request — a property no UI-driven product matches.
Pros
- The most expressive grouping and inhibition model available, free, and reviewable as code
- Gossip-based clustering means an HA pair deduplicates rather than double-paging
- Every commercial pager accepts it as a source, so adopting it does not close off buying a notifier later
- No vendor needs to be reachable for routing decisions to happen
Cons
- No schedules, no rotations, no escalation, and no concept of acknowledgement — it is not a pager
- The routing tree is genuinely hard to reason about, and a misordered branch sends alerts somewhere you find out about during an incident
- Silence management is manual, and a forgotten silence is a deleted alert with extra steps
- Self-hosted in the cluster it watches, it is part of the outage it should be reporting
Best for: Prometheus shops who want deduplication, grouping and inhibition as reviewable configuration, paired with a pager elsewhere.
Pricing: Open source with no licence cost; the expense is infrastructure and the engineer who owns the routing tree.
Needs first-hand data: Run a failover test on whatever you self-host in this layer. Take down the cluster your routing and paging components live in — properly, not by stopping one pod — and record whether a page for that outage reaches a phone, and how long it takes. If nothing arrives, you have measured the exact reason to move the paging layer somewhere else.
Keep
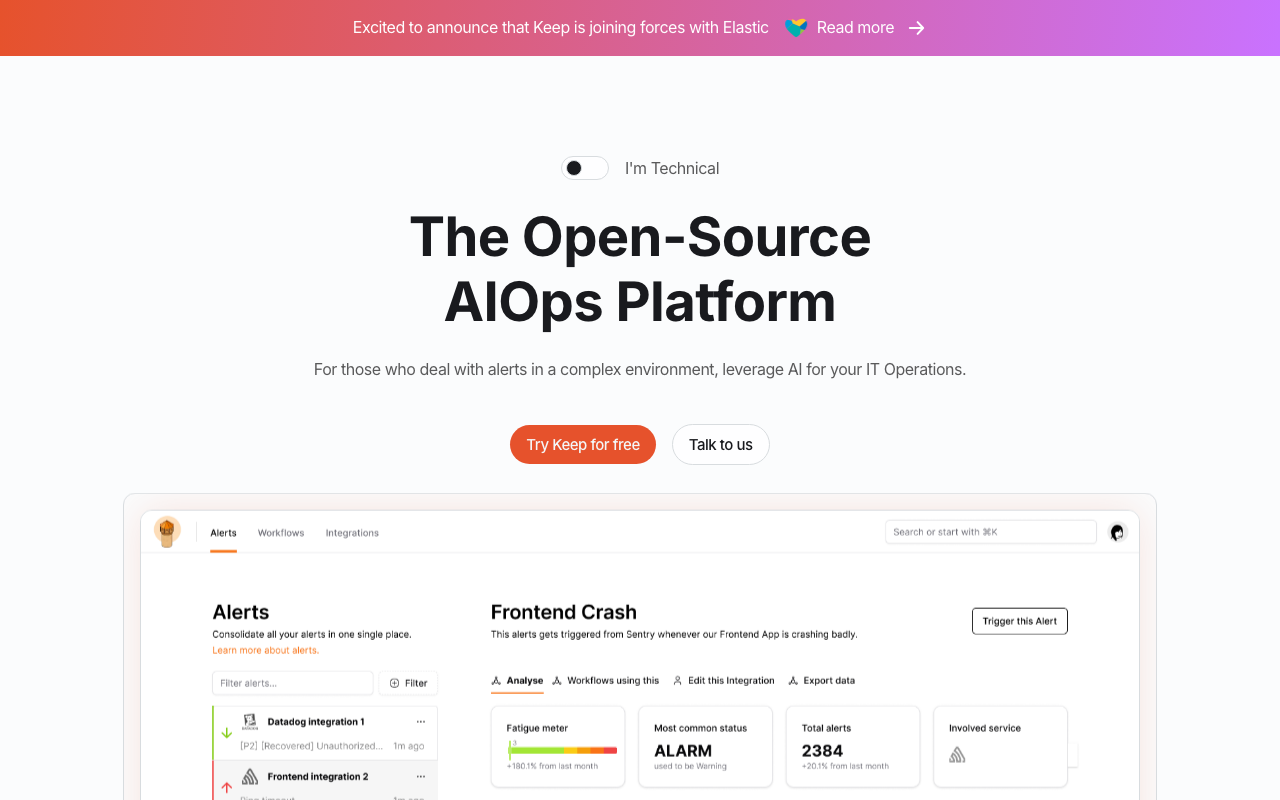
Keep is the open source answer to layer two when your alerts do not all come from Prometheus. It ingests from many monitoring tools, correlates related alerts into incidents, enriches them, and runs YAML-defined workflows in response — a programmable consolidation layer in front of whatever pages you. Its homepage carries a banner announcing that Keep is joining Elastic, which matters for anyone planning a multi-year deployment.
Pros
- Consolidates alerts from many products into one correlation layer, which is exactly the problem teams with six monitoring tools have
- Workflows in YAML, so enrichment and automated responses are reviewed like code rather than clicked into a UI
- Self-hostable, so alert data does not need to leave your network to be correlated
- Actively developed with a real community, which is not true of every project in this category
Cons
- Joining Elastic means an independent roadmap becomes a larger company’s roadmap
- It routes, it does not page: schedules, escalation and phone calls still come from somewhere else
- Younger than the incumbents, so unusual sources and correlation rules mean more of your own work
- Adds a component between an alert and a human, which is a component that can fail
Best for: Teams with alerts from several monitoring products who want one self-hosted correlation layer before the pager.
Pricing: Open source and self-hostable at infrastructure cost, with a managed offering for teams who prefer not to run it.
Alerta
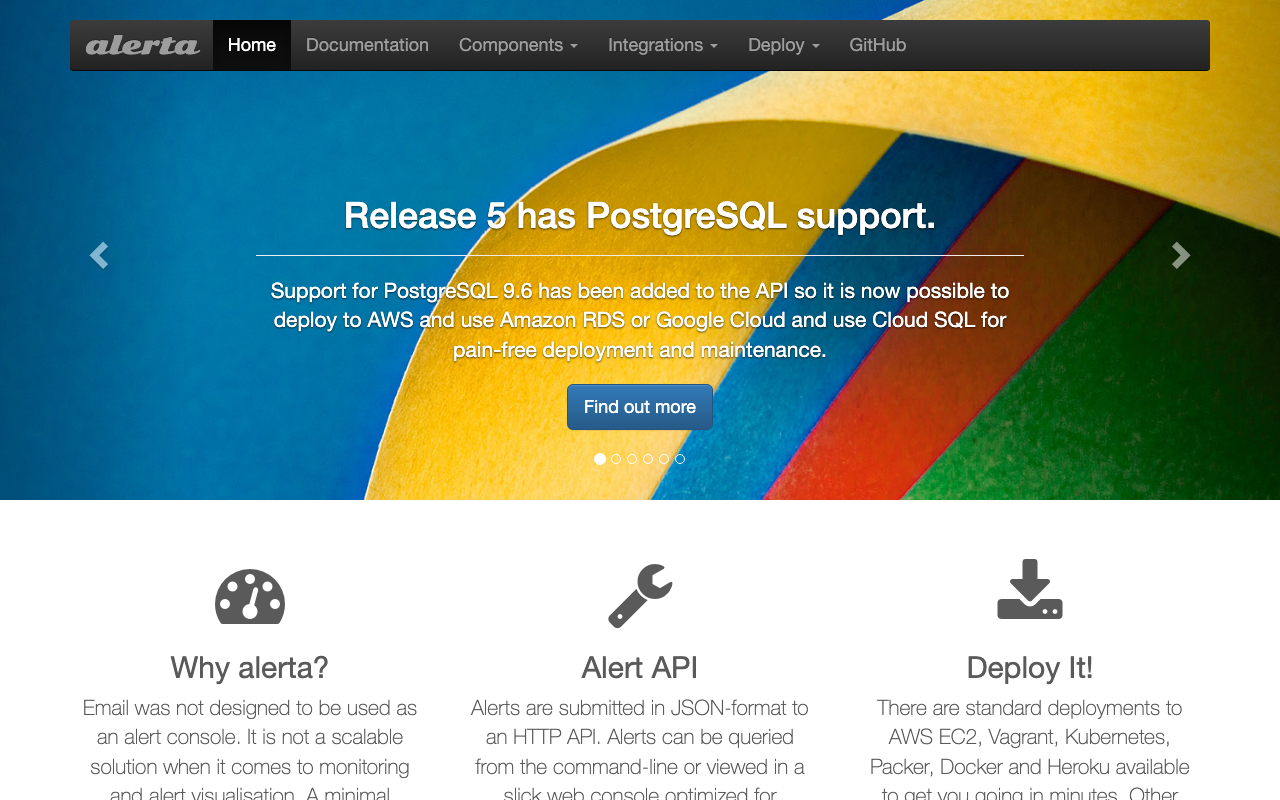
Alerta is an alert console: many sources in, one deduplicated, filterable view out, with a simple severity model and an API that is easy to push to from anything. As a lightweight consolidation layer for teams whose alerts arrive from Nagios, Zabbix, Prometheus and a pile of cron scripts, it does a real job with very little to operate. One honest signal about the project’s activity: its homepage still headlines PostgreSQL 9.6 support in “Release 5,” which is a checkable observation about how current the public surface is.
Pros
- Very small operational footprint for what it does — a service, a database, a web console
- Straightforward API means any script or legacy tool can push alerts without a plugin
- Deduplication and severity-based correlation give an immediate improvement over a wall of email
- Long-standing project with plugins for the older monitoring tools nobody has migrated off
Cons
- The public site headlining PostgreSQL 9.6 support is a fair signal that the project is quiet; check activity yourself before committing
- No paging: no schedules, no escalation, no acknowledgement that survives someone going back to sleep
- Correlation is simpler than Alertmanager’s inhibition model or Keep’s workflows
- UI and integrations feel their age next to newer options
Best for: Teams consolidating alerts from a mixed estate of older monitoring tools who want one console with minimal operational cost.
Pricing: Open source with no licence cost; you run the service and the database.
Robusta
Robusta is Kubernetes-specific and sits between layers two and three: it watches cluster events and Prometheus alerts, attaches context automatically — the pod’s logs, the recent deployment, the container’s exit reason, a relevant graph — and delivers the enriched alert to Slack or a pager. Its value is not routing, it is that the alert arrives with the first three things you would have gone and looked up anyway.
Pros
- Automatic enrichment turns “CrashLoopBackOff on payments-api” into an alert that already contains the crash logs and exit code
- Playbooks are declarative, so “on this alert, run this action and attach the output” is configuration
- Deep Kubernetes awareness: deployment changes, OOM kills and node conditions are first-class rather than generic events
- Cuts real minutes off the start of an incident, which is where the time is actually lost
Cons
- Kubernetes only — nothing outside the cluster is in scope
- Not a pager and not an incident coordination tool; it improves the alert, then hands it on
- Its actions run with cluster permissions, so the enrichment layer becomes something with meaningful access
- The most useful automations tend to sit in the commercial tier rather than the open source core
Best for: Kubernetes teams whose alerts are technically correct and practically useless without three lookups attached.
Pricing: Open source core at infrastructure cost, with a paid SaaS tier for the hosted platform and its additional automations.
K8sGPT
K8sGPT scans a Kubernetes cluster for broken resources — failing pods, unbound claims, misconfigured services, bad ingress — and explains them in plain language, optionally routing the explanation through a language model. It is a diagnosis tool rather than incident management, and it belongs in this article for exactly one reason: for a small team without a Kubernetes specialist, the gap between “the alert fired” and “I understand what is broken” is where the time goes, and this closes some of it.
Pros
- Finds and explains the common cluster misconfigurations without anyone needing to know the right
kubectl describeincantation - Runs as a CLI or in-cluster operator, so it fits both ad hoc use and scheduled scanning
- Model backend is pluggable, including local models, so cluster details need not leave your network
- Genuinely useful for teams whose Kubernetes knowledge is thin, which is most teams
Cons
- Not incident management in any layer: no routing, no paging, no coordination, no record
- Explanations from a language model are plausible-sounding by construction and must be treated as hypotheses, never findings
- Coverage is the well-known failure patterns; a novel or application-level failure gets you nothing
- Sending cluster state to a hosted model is a data question you have to answer before enabling it
Best for: Small Kubernetes teams without a platform specialist who want common cluster failures explained during triage.
Pricing: Open source with no licence cost; any model inference you route to a hosted provider is billed by that provider.
Uptime Kuma
Uptime Kuma is the most-installed self-hosted monitoring tool for a reason: one container, a clean UI, HTTP, TCP, ping, DNS and certificate checks, notifications to more than ninety services, and a built-in status page. It is detection rather than incident management, but it is the source of most alerts in small self-hosted stacks, and its notification breadth means it can page a phone through a gateway without another product.
Pros
- One container to run, with a UI simple enough that non-specialists can add checks
- Very large notification integration list, so it reaches Slack, Telegram, webhooks and SMS gateways directly
- Built-in status page covers the customer-communication side for small deployments
- Certificate expiry and keyword checks catch the boring failures that cause real outages
Cons
- No on-call schedules, escalation or acknowledgement — a notification that nobody sees is simply missed
- Single-instance by design, so it becomes a monitoring system with no monitoring of its own
- Checks run from wherever you host it, so it sees what that one location sees
- Deduplication and grouping are minimal, so a broad failure produces a notification per check
Best for: Small teams and homelab-scale deployments who want external checks and a status page from one container.
Pricing: Open source with no licence cost; the bill is the small host it runs on and any SMS gateway you attach.
Cachet
Cachet is the long-standing open source status page: components with status, incidents with updates, scheduled maintenance, subscriber notifications, and an API to drive all of it from your own automation. It covers the customer-communication part of layer three, which is the one piece of incident coordination open source does handle properly.
Pros
- Self-hosted status page with no per-subscriber pricing, which is where hosted status pages get expensive
- API-driven, so incident updates can be posted from your own tooling rather than by hand during an outage
- Scheduled maintenance and component-level status cover what most customers actually want to see
- Full control over branding and hosting, which matters when the status page is a customer-facing surface
Cons
- Hosting your status page on your own infrastructure defeats its purpose during a real outage — it must live somewhere independent
- Project momentum has been uneven over the years, so evaluate current activity rather than the reputation
- No detection: something else must decide the component is down and call the API
- Nothing on incident roles, timelines or retrospectives — this is the public face only
Best for: Teams who want a branded, self-hosted status page driven from their own automation, hosted outside their production estate.
Pricing: Open source with no licence cost; hosting it independently of your production infrastructure is the real requirement, not the expense.
ilert

If you accept the argument that the pager should not run on the infrastructure it watches, ilert is a reasonable hosted answer for a European team: alert routing, on-call schedules, escalation, live call routing and status pages in one product, with data residency and GDPR posture answered directly rather than as a follow-up question. It accepts Alertmanager as a source, so it drops in behind an otherwise self-hosted stack without changing the routing you already own.
Pros
- Slots in as the notifier behind Alertmanager or Keep, so your self-hosted routing layer stays as it is
- European hosting and data residency answered up front, which shortens procurement for regulated buyers
- SMS and voice included in the subscription rather than billed as a separate telecom account you manage
- Status pages bundled, covering the customer-facing side without another vendor
Cons
- It is hosted, so the self-hosted-everything requirement is not met — that is the deliberate trade
- Smaller integration catalogue than PagerDuty, so unusual sources arrive by generic webhook
- Bundled status pages are only a saving if you were going to use theirs
Best for: European teams running a self-hosted monitoring stack who want the paging layer to live somewhere their outage cannot reach.
Pricing: Per-user subscription tiers with SMS and voice allocated by tier rather than billed separately.
Spike.sh
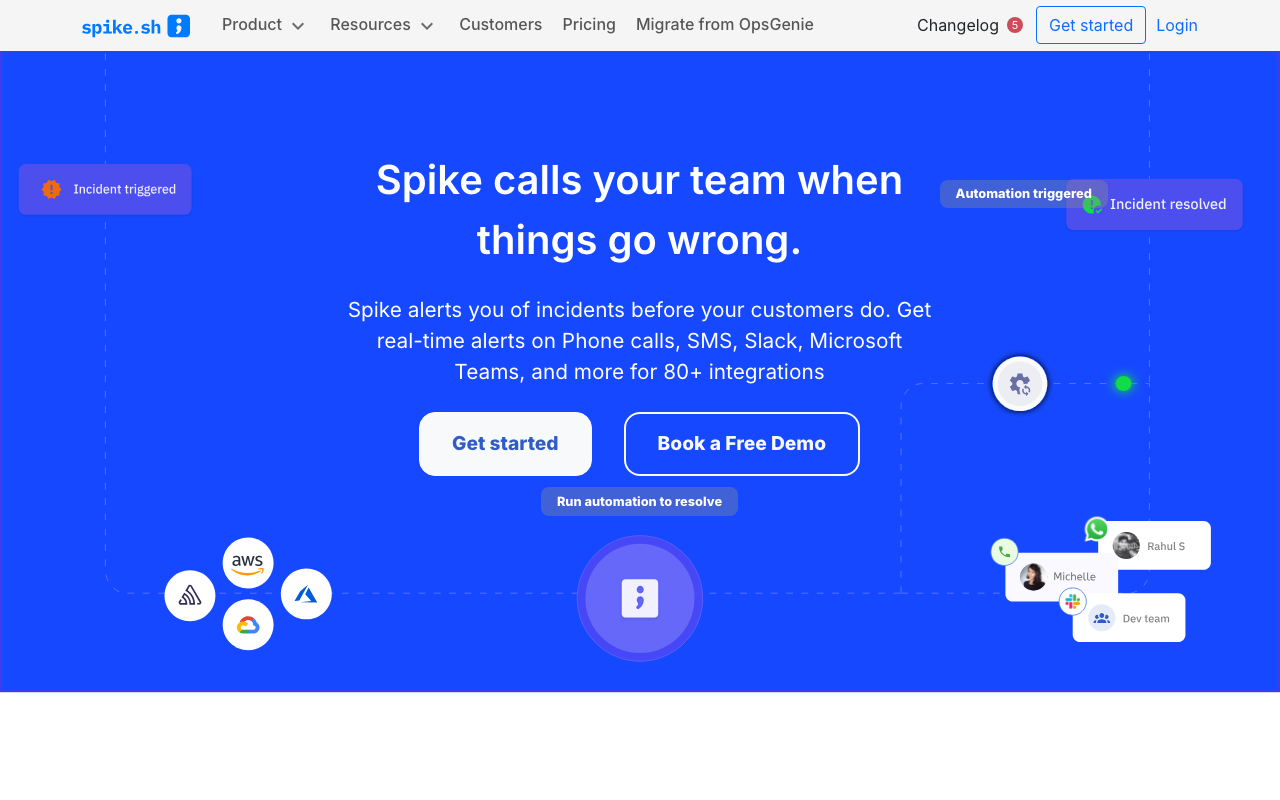
Spike.sh is the small-team hosted pager: services, escalation policies, rotations and mobile paging without an enterprise configuration project or enterprise pricing. It sits in this article because for a two-to-ten engineer team, the honest comparison to a self-hosted pager is not “free versus paid” — it is “your SMS gateway bill plus your operational risk” versus a low per-user subscription. Its navigation carries a “Migrate from OpsGenie” path, which tells you which buyer it is chasing.
Pros
- Covers the paging layer properly — phone, SMS, push, escalation — which is the layer open source covers worst
- Priced for small teams, so the comparison against a self-hosted pager plus telecom account is genuinely close
- Fast to configure, which matters when the alternative is another quarter of “we should set up on-call properly”
- Accepts webhooks from anything, so it works behind Alertmanager, Keep or Uptime Kuma
Cons
- Hosted, so it does not satisfy a hard self-hosting requirement
- Smaller integration catalogue, meaning custom sources need you to shape the webhook payload
- Routing and suppression are simpler than Alertmanager’s, so keep correlation upstream
- Less recognised in enterprise procurement, which can mean more security review
Best for: Small teams whose self-hosted stack is fine but whose on-call is currently “whoever notices the Slack message.”
Pricing: Per-user subscription with a low entry tier; check the SMS and voice allocation against your real page rate.
All Quiet
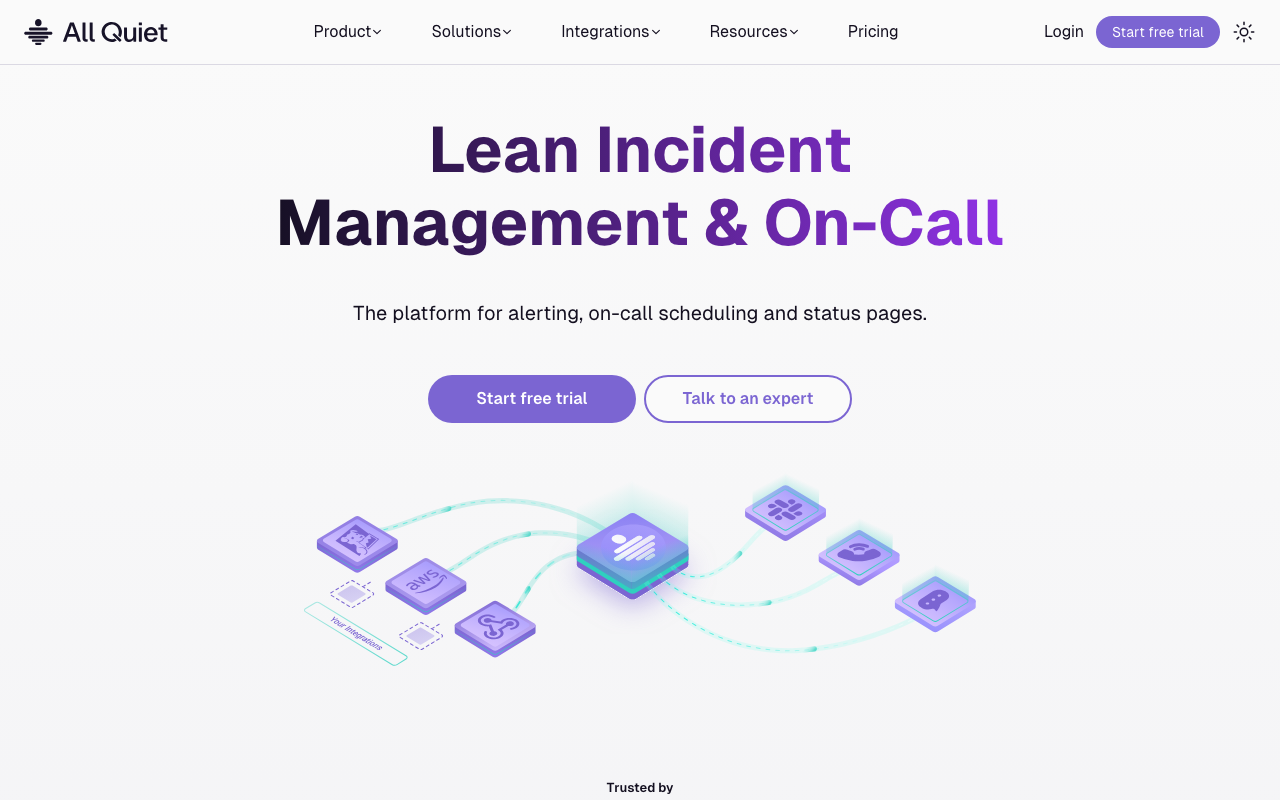
All Quiet is a newer hosted on-call product with a free entry tier that is genuinely usable rather than a demo, which is why it belongs in an open-source-minded comparison. The configuration surface is small — schedules, escalation, integrations, mobile paging — and for a team setting up its first rotation that is a feature, not a limitation.
Pros
- Free entry tier that covers a real small-team rotation, making evaluation a weekend rather than a sales cycle
- Small enough to configure in an afternoon, which is the difference between having on-call and planning to
- Modern integration set plus webhooks, so it sits behind a self-hosted monitoring stack cleanly
- Mobile paging and escalation are the focus rather than one feature among many
Cons
- Short track record for a component whose whole value is being reliable during other systems’ failures
- Hosted only, so a strict self-hosting policy rules it out
- Advanced routing, suppression and governance features are thinner than the incumbents’
Best for: Small teams standing up a first on-call rotation who want a real pager without a procurement conversation.
Pricing: Per-user tiers with a free entry level; the variable to check is how SMS and voice minutes are allocated.
How to choose
Decide which layer is actually broken, then pick within it.
If your pager fires too often, do not buy a pager. The fix is layer two: grouping so one failure is one notification, and inhibition so a cause suppresses its symptoms. Alertmanager if everything is Prometheus, Keep if alerts arrive from several products, Alerta if you have a mixed estate of older tools and want one console cheaply. This is the highest-return work in the category and it costs nothing.
If nobody reliably wakes up, buy the pager. Open source cannot solve delivery, because delivery is SMS and voice, and those are metered by a telecom provider. Add the operational risk that a self-hosted pager may be inside the outage, and the case for a hosted notifier is strong even in a fully self-hosted stack. Start with the free and low-cost tiers — All Quiet, Spike.sh, ilert — before assuming you need enterprise pricing. The PagerDuty alternatives guide covers the wider market.
If your incidents are chaotic rather than undetected, accept that open source will not fix it. A Slack workflow that creates a channel, a pinned template naming commander and scribe, a timeline that someone actually keeps, and a retrospective document from a repository template will get you most of the value. Cachet handles the customer-facing part. Everything past that is where the commercial products in incident management earn their money.
| Option | Layer | Self-hosted | Picks itself when |
|---|---|---|---|
| Grafana OnCall / IRM | Paging | Archived OSS; IRM is cloud | You are already in Grafana Cloud |
| Prometheus Alertmanager | Routing | Yes | Everything is Prometheus and routing should be code |
| Keep | Routing | Yes | Alerts arrive from six different products |
| Alerta | Routing console | Yes | A mixed estate of older monitoring tools needs one view |
| Robusta | Alert enrichment | Yes | Kubernetes alerts arrive without the context to act on |
| K8sGPT | Diagnosis | Yes | Nobody on the team is a Kubernetes specialist |
| Uptime Kuma | Detection | Yes | You need external checks and a status page from one container |
| Cachet | Status page | Yes | You want a branded status page hosted outside production |
| ilert | Paging | No | European residency plus a self-hosted monitoring stack |
| Spike.sh | Paging | No | Small team, low budget, leaving an incumbent |
| All Quiet | Paging | No | First rotation, configured this week |
Needs first-hand data: Time the whole path on each candidate, from
docker compose upor signup to a phone actually ringing in someone’s hand with a real alert attached. Do it for two people in two countries if your team is distributed. That number — not the feature list — is what decides whether the rotation gets set up this quarter or slips again.
Two more worth knowing. Gatus is a lightweight health-check and status-page tool defined entirely in YAML, which suits teams who want their checks in version control rather than a UI — a good fit alongside Alertmanager. OpenStatus is an open source synthetic monitoring and status page project taking a more modern approach to the same job. Both are covered in the uptime and synthetic monitoring guide.
Frequently asked questions
Is there a fully open source PagerDuty replacement?
Not one that covers the whole job today. Grafana OnCall was the closest, and Grafana has published that it is winding it down as a standalone product with the OSS repository archived, folding on-call into Grafana IRM. The remaining open source projects cover routing and noise reduction well — Alertmanager, Keep, Alerta — but none provides schedules, escalation and reliable delivery to a sleeping engineer. That last part is where teams end up paying.
Why does self-hosted on-call still cost money?
Because waking someone up is a physical problem, not a software one. Push notifications are free and unreliable — a phone in Do Not Disturb ignores them. SMS and voice calls reliably wake people, and they are billed per message by a telecom provider. A self-hosted pager therefore needs your own account with a messaging provider, your own phone numbers, and your own responsibility for delivery in every country your engineers live in. The licence is free; the pager is not.
Should I self-host my pager?
Usually not, even when everything else is self-hosted. A pager that runs on the infrastructure it monitors can be part of the outage it exists to report, and that failure is silent — no page arrives and nothing tells you why. If you do self-host it, run it in a separate failure domain from production: a different cloud, a different account, a different region at minimum. For most teams a low-cost hosted notifier behind a self-hosted routing layer is the better shape.
What should I use for postmortems if there is no good open source option?
A template in a repository and a calendar invite. The value of a retrospective comes from a written timeline, a blameless discussion, and action items with owners and dates that someone tracks — none of which requires software. Commercial tools help by capturing the timeline automatically from chat and alerts, which is a genuine saving during a long incident, but it is an accelerant rather than the substance. See best postmortem tools for what that automation is worth.
Related reading
- Best incident management tools — the full category including the commercial coordination products.
- Best alerting tools — the rule, router and notifier layers explained in depth.
- Best on-call scheduling tools — rotations, overrides and escalation compared in detail.
- PagerDuty alternatives — where teams go when per-user pricing stops working.
- Best status page tools — hosted and self-hosted options for the customer-facing side.
- Best open source APM tools — the detection layer that produces most of these alerts.
- Best uptime and synthetic monitoring tools — external checks, including Gatus and OpenStatus.