AIOps is the most oversold category in operations software, and it also contains something that genuinely works. Both are true, and the marketing makes them impossible to tell apart, because vendors sell three separable capabilities under one word.
Separate them and the buying decision becomes tractable:
Alert correlation and noise reduction. Taking hundreds of alerts and grouping them into a handful of incidents. This is mature, mechanical and genuinely valuable. It is clustering on time proximity, topology relationships and text similarity — not intelligence, and none the worse for it. If your pager fires forty times for one bad deploy, this is the part that helps.
Anomaly detection. Learning what a metric normally does and flagging deviation. It works well on metrics with real seasonality — request rate that follows a weekday pattern, a queue that drains overnight. It produces confident nonsense on anything bursty, spiky, or driven by a small number of large customers, which describes a lot of production systems.
Root cause analysis and automated remediation. The claim to interrogate hardest. “Root cause” in most products means “the alert with the earliest timestamp in the correlated group whose service is upstream in the topology graph.” That is often useful and occasionally right. It is not causal reasoning, and a product that presents a ranked guess as a determination will send someone down the wrong path at 3am with false confidence.
Then there is the newer layer, and it is the one being sold hardest right now: LLM-based investigation agents that read your alerts, logs, recent deploys and dashboards and write a summary of what appears to be happening. This is genuinely useful for the first five minutes of an incident — it does the four lookups you were about to do and puts them in one place. It is genuinely dangerous the moment anyone treats the summary as a finding, because a language model produces a fluent, plausible narrative whether or not it has the evidence for one. The failure mode is not “it says I do not know.” The failure mode is a confident, well-written, wrong explanation that a tired engineer accepts.
Key takeaways
- AIOps is three things: correlation (mature and mechanical), anomaly detection (good on seasonal metrics, bad on bursty ones), and root cause or remediation (the claim to test hardest).
- Most “root cause” output is the earliest alert in a correlated group weighted by topology. Useful as a starting point, wrong as a conclusion.
- LLM investigation agents save real time on the first five minutes of an incident and are dangerous the moment a summary is read as a finding.
- Pricing shape matters more than feature lists here: “per event ingested” and “per node” behave completely differently on the day you have an alert storm.
What actually works, and how it works
Correlation is clustering, and you can understand it. The signals are time proximity, shared labels or entities, topology relationships from a service map or CMDB, and text similarity between alert descriptions. A good engine combines them and shows you which one drove the grouping. A deterministic, rule-visible engine — “these alerts were grouped because they share the cluster label and fired within 90 seconds” — is debuggable at 3am. A learned model that groups by similarity to past incidents is more powerful and less explainable, and when it groups two unrelated incidents into one you will not be able to say why.
Prefer explainable correlation. The value of correlation is that it collapses noise; the cost of a wrong grouping is that a real incident hides inside another one. You need to be able to see and override the rule.
Anomaly detection is a forecast plus a residual. The model predicts what the metric should be — usually a seasonal decomposition or a similar time-series method — and alerts when the actual value departs far enough from that prediction. The three ways this fails in production are consistent. It needs weeks of history to learn a weekly pattern, so it is useless for anything new. It learns your incidents as normal if they happened during training. And a metric driven by a handful of large customers is not seasonal at all — one customer’s batch job is an anomaly every time it runs, correctly and uselessly.
The practical rule: anomaly detection on aggregate business-shaped metrics (checkout rate, sign-ups, request volume) earns its place. Anomaly detection on infrastructure metrics mostly adds noise, and you get more from a well-chosen SLO burn-rate rule. That trade-off is covered in the alerting tools guide.
Root cause needs a topology, and your topology is probably wrong. Ranking causes requires knowing which service calls which. Products build that from traces, from eBPF-observed connections, from a service mesh, or from a manually maintained CMDB. Trace-derived and eBPF-derived maps are the ones worth trusting, because they reflect what actually happened rather than what someone documented in 2023. Ask specifically where the topology comes from — the answer predicts the quality of every causal claim the product makes.
Automated remediation is where blast radius becomes the whole question. Restarting a pod is low risk and mostly what these actions do. Scaling a deployment, failing over a database, draining a node or rolling back a release are not low risk, and a wrong automated action during an incident makes the incident worse in a way that is hard to unwind. Start with actions that gather information rather than change state, require approval for anything that mutates, and log every action into the incident timeline.
Needs first-hand data: Replay 30 days of your historical alerts through a candidate correlation engine and measure two numbers: the reduction ratio from alerts to incidents, and how many of the resulting groups a human on your team would have split or merged differently. The second number is the one vendors never quote and the one that decides whether you can trust it.
What to check before you buy
Five questions, and the answers vary far more between products than the feature grids suggest.
What data does it need, and where does that data have to live? Some products correlate the alerts you already send them, which is a small integration. Others need your logs, metrics and traces in their platform to do anything useful, which is a data migration and a second bill. “AIOps” priced as a feature on top of a platform you already pay for is a different purchase from an independent correlation layer, even when the demo looks the same.
Is the correlation deterministic and explainable, or a black box? Ask to see why two specific alerts were grouped. If the answer is a similarity score with no visible reason, you have bought something you cannot debug during the incident when it matters.
What happens on a failure it has never seen? Every one of these systems is strongest on the recurring failures you already understand and weakest on the novel one that is actually taking you down. Ask what the product does when confidence is low. A system that says “these alerts are related, cause unknown” is more useful than one that always produces a ranked cause.
Can it act, and what is the blast radius of a wrong action? Get the list of actions it can take without a human, and the mechanism for approval on the rest. Then ask what the rollback is for each one.
How is it priced, and how does that behave on your worst day? This is the question teams skip and regret. Per-event and per-alert pricing is cheap in steady state and spikes exactly when you have an alert storm — you get billed most on the day you are already having your worst outage. Per-node and per-host pricing is predictable and unrelated to how noisy your monitoring is. Per-incident pricing sounds aligned until you realise it penalises declaring incidents, which is a behaviour you want to encourage.
Needs first-hand data: Find your largest alert storm from the last year, count the events it generated, and price that single day under each candidate’s meter. Compare it against the same day priced per node. That one calculation reorders most shortlists.
BigPanda

BigPanda is the purest expression of the correlation layer: it ingests alerts from your existing monitoring estate, deduplicates and clusters them into incidents, enriches them with topology and change data, and hands the result to your ticketing and paging systems. It does not want to be your monitoring tool, which is exactly the point for large organisations running twelve of those already. Correlation combines time, topology and change events, and change correlation — linking an incident to the deploy that preceded it — is the part that pays for itself.
Pros
- Vendor-neutral by design: it sits above whatever monitoring you already have rather than replacing it
- Change correlation ties incidents to recent deploys and config changes, which is the most common real cause
- Enrichment from CMDB and topology data makes the grouped incident actionable rather than just smaller
- Built for estates with many monitoring tools, which is the situation that actually needs correlation
Cons
- Enterprise sales motion and pricing; this is not a product a team adopts on a card
- Correlation quality depends on the enrichment data you feed it, so a stale CMDB produces confident, wrong groupings
- Value is proportional to how many monitoring tools you have — with one or two, your existing router already does this
- Adds another system between the alert and the human, with its own availability to consider
Best for: Large organisations with many monitoring tools whose primary problem is alert volume across an estate nobody can consolidate.
Pricing: Enterprise subscription scaled by event or alert volume and integrations, negotiated rather than listed.
Moogsoft
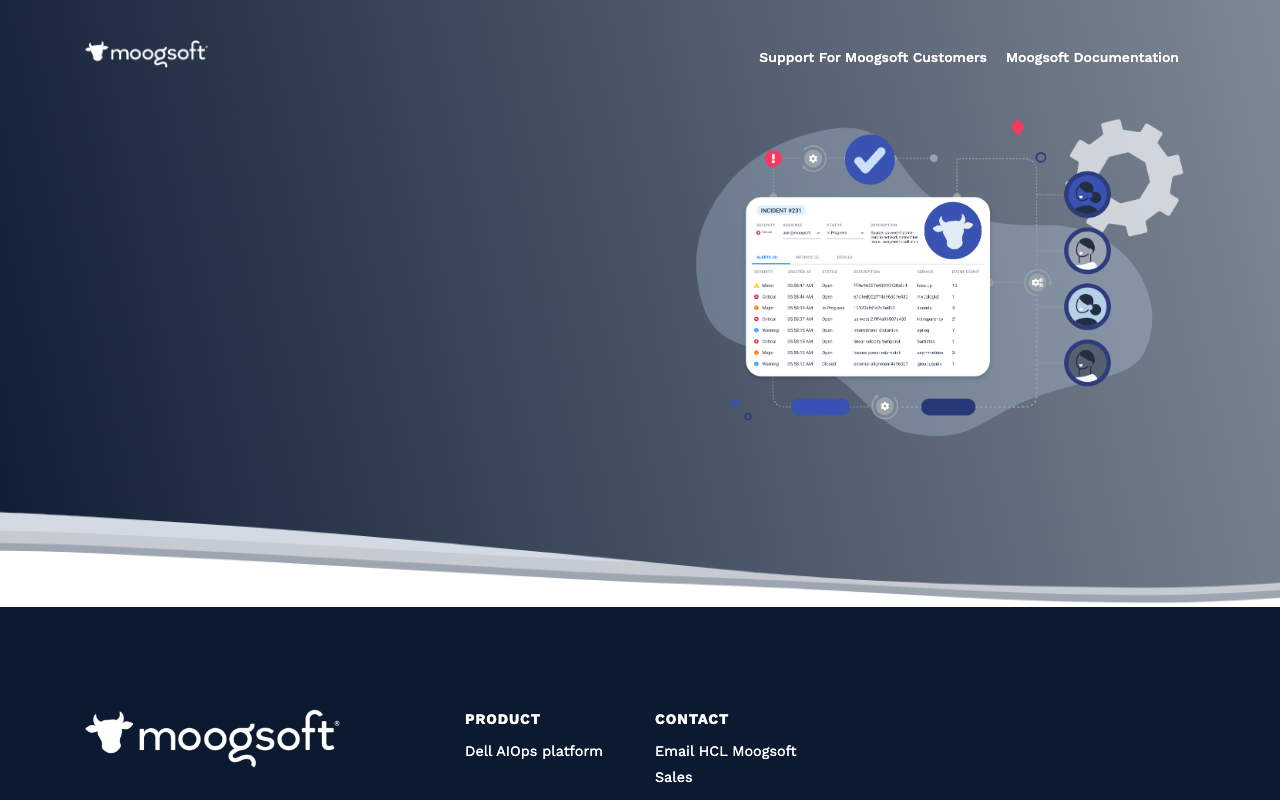
Treat Moogsoft as legacy. It was one of the two products that defined algorithmic event correlation, and its site is now effectively a shell pointing customers toward the Dell AIOps platform and HCL Moogsoft sales. The technology was real — probabilistic clustering of events into situations, without requiring a pre-built topology — and the buying reality today is that you are entering a portfolio transition, not adopting an independent product.
Pros
- Genuinely mature correlation technology that defined the category’s approach to event clustering
- Works without a pre-built topology, which was a meaningful advantage over CMDB-dependent approaches
- Existing deployments continue to function and are supported through the acquiring vendors
Cons
- The public product surface now redirects to two other vendors, which is not a position to start a new evaluation from
- Roadmap and support ownership are split across an acquisition, so continuity questions are the first thing procurement will ask
- New buyers get a better answer from a product whose vendor is the one selling it
Best for: Existing customers evaluating whether to follow the platform transition or migrate — not new adoption.
Pricing: Enterprise licensing through the acquiring vendors rather than a published model.
Datadog Watchdog

Watchdog is Datadog’s automated detection layer, and its advantage is structural: it already has your metrics, traces, logs and deploy events, so it can correlate an anomaly with the release that preceded it without any integration work. It surfaces unusual error rates and latency shifts you did not write a monitor for, and its newer investigation features assemble a summary of related signals when something fires. If your data is already in Datadog, this is the lowest-friction AIOps you can get.
Pros
- No integration project: it works on data the platform already holds, including deploy markers
- Surfaces problems nobody wrote a monitor for, which is the honest gap in threshold-based alerting
- Correlation across metrics, traces and logs in one model rather than three products stitched together
- Anomaly and forecast monitor types are available as explicit rules when you want control rather than automation
Cons
- Only sees what is in Datadog, so its quality is a function of how much you send — and sending more increases the bill
- Detection quality on bursty or low-traffic services is poor, and it will tell you about them anyway
- Explanations are correlational; the “related” signals it surfaces are not ranked by anything causal
- Deepens platform lock-in, since the value comes from everything living in one place
Best for: Teams already sending most of their telemetry to Datadog who want anomaly detection and correlation without a second vendor.
Pricing: Bundled with the underlying Datadog products rather than sold separately; the meter that grows is ingest and custom metrics.
Dynatrace Davis
Davis is the strongest causal story in this list, and it earns that from architecture rather than modelling. Dynatrace’s agent builds a live dependency map — processes, services, hosts, containers and their actual call relationships — and Davis reasons over that graph rather than over alert text. Because the topology is observed continuously rather than declared in a CMDB, its causal claims have something real underneath them. It also means the whole thing depends on running Dynatrace’s agent everywhere.
Pros
- Causal analysis over a continuously observed dependency graph, not text similarity between alerts
- Deterministic and explainable: it shows the path through the topology it used to reach a conclusion
- Automatic baselining per entity removes most of the threshold-picking work
- Problem-centric model means one incident is one problem record, not a stream of alerts to group
Cons
- Requires the OneAgent across the estate; anything it does not instrument is invisible to the causal graph and silently excluded
- The most expensive way to get correlation, and you are buying a full APM platform to get it
- Novel or application-logic failures outside the observed topology get much weaker answers
- Licensing and consumption units are complex enough that forecasting the bill is its own exercise
Best for: Enterprises willing to standardise on one agent everywhere in exchange for the most defensible automated causal analysis available.
Pricing: Consumption-based licensing across separate units for hosts, ingested data and other capabilities, typically on an annual commitment.
New Relic
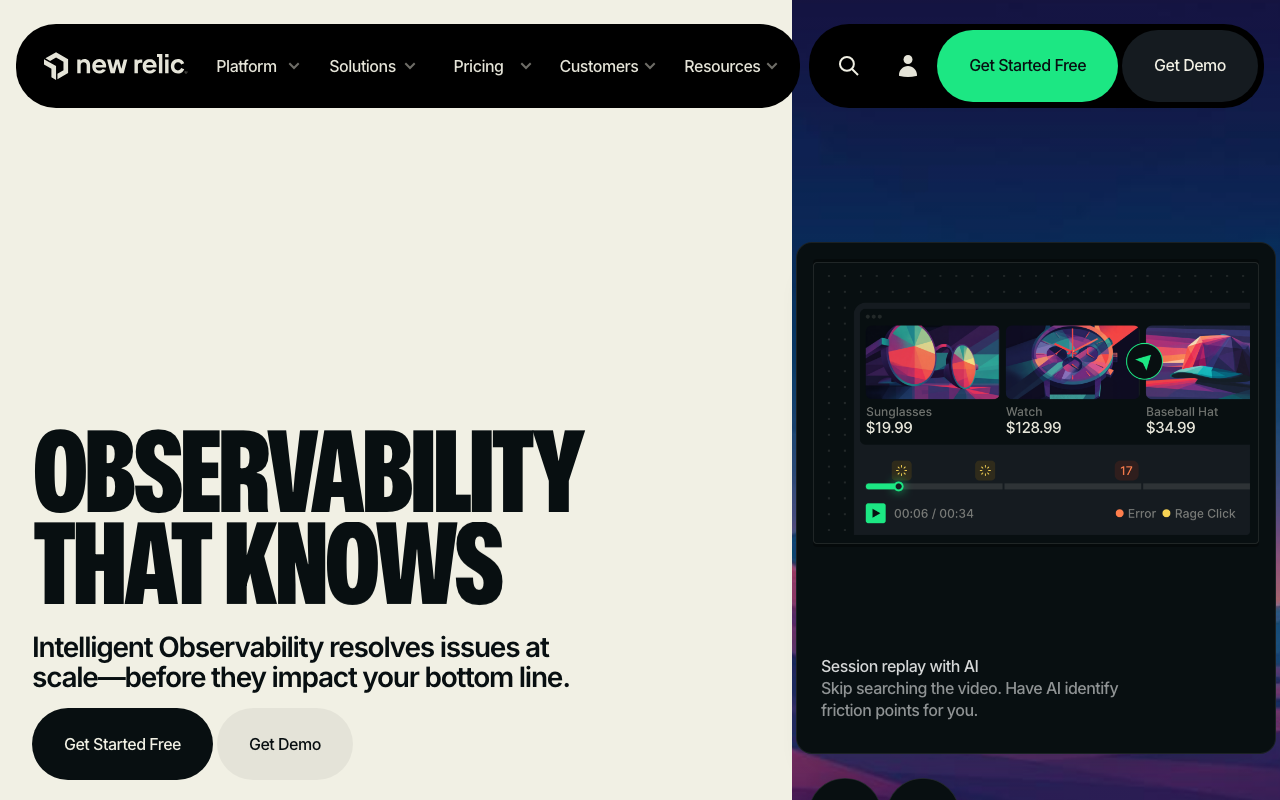
New Relic’s applied intelligence layer does anomaly detection, alert correlation into issues, and increasingly an assistant that answers questions about your telemetry in plain language. Its distinguishing commercial property is the pricing model — data ingested plus billable users, rather than per host — which changes the AIOps calculation, because the intelligence features are included rather than sold as a premium tier on top.
Pros
- Correlation and anomaly detection included in the platform rather than gated as a separate AIOps SKU
- Ingest-plus-users pricing means adding hosts does not multiply the cost of the intelligence features
- Assistant-style querying lowers the barrier for engineers who do not know the query language
- Correlates across the full telemetry set it holds, including deploy markers and errors
Cons
- Same structural limit as every platform-native option: it only reasons about data you send it
- Correlation is grouping rather than causal analysis, despite framing that sometimes implies otherwise
- Ingest-based pricing makes the “send everything so the AI can see it” advice directly expensive
- Assistant answers are as good as the underlying data model and will confidently summarise incomplete telemetry
Best for: Teams on New Relic’s ingest-based pricing who want correlation and anomaly detection without a separate AIOps purchase.
Pricing: Metered on ingested data volume plus billable full-platform users, with the intelligence features included rather than tiered separately.
PagerDuty
PagerDuty approaches AIOps from the pager end, which is a defensible place to do it: it already receives every alert from every source, so it can deduplicate, suppress transient noise, group related alerts into one incident, and surface past incidents that looked similar. Event Orchestration provides the deterministic, rules-based half — routing and suppression you write and can read — with the learned grouping layered on top. That combination of explicit rules plus statistical grouping is the right shape.
Pros
- Sits at the natural aggregation point: every alert already flows through it, so no new data pipeline
- Event Orchestration gives deterministic, reviewable suppression and routing rules alongside the learned grouping
- Past-incident surfacing is genuinely useful, because most incidents are variations on previous ones
- Correlation improvements reduce pages directly, which is the outcome you were buying
Cons
- Sees alerts, not telemetry, so it cannot reason about the underlying metrics or logs that would explain the group
- The intelligence features sit in higher pricing tiers, on top of per-user pricing across a large organisation
- Grouping quality depends on the label hygiene of the alerts you send, which is work on your side
- No topology of its own unless you feed it one, which limits causal claims
Best for: Organisations already using PagerDuty as the aggregation point who want noise reduction where the pages actually happen.
Pricing: Per-user subscription tiers, with the correlation and automation capabilities gated to the higher tiers.
incident.io
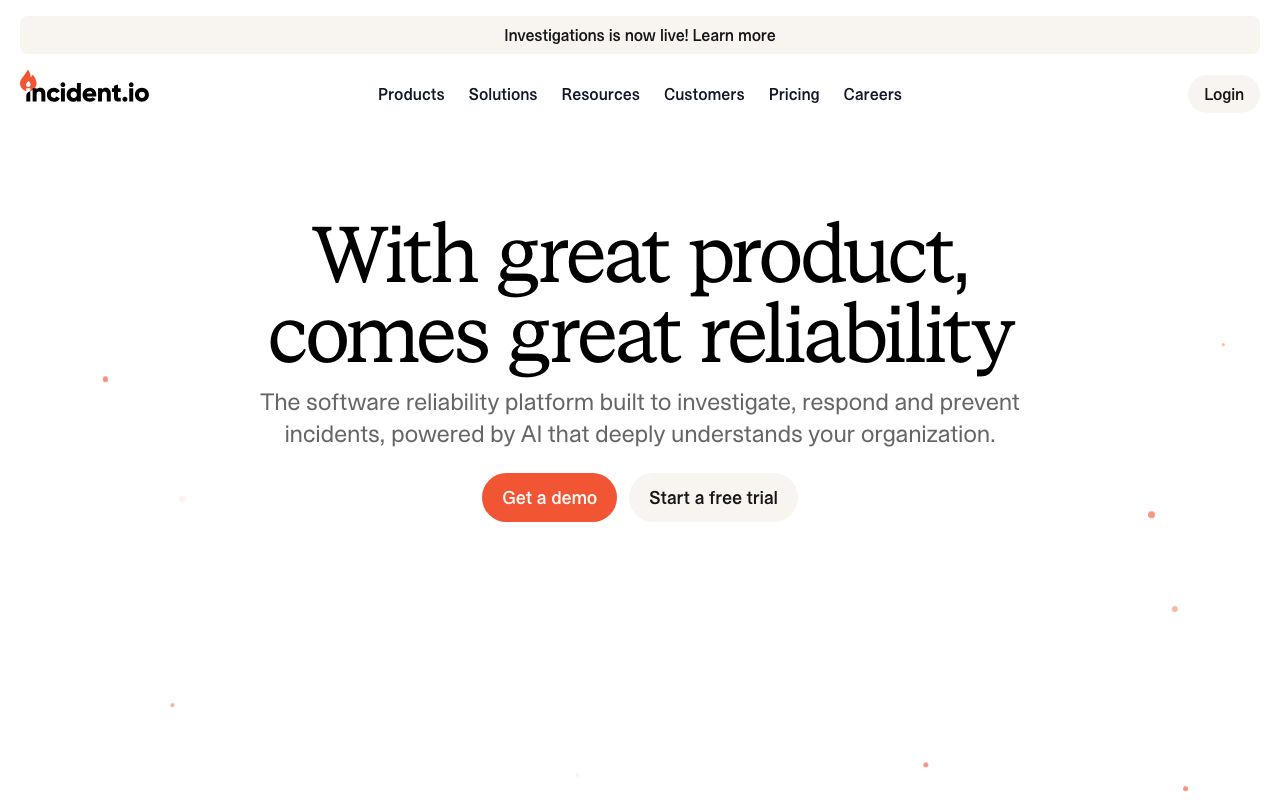
incident.io is an incident coordination product — declare, channel, roles, timeline, status page, retrospective — that has added an investigation layer on top: when an incident is declared, it assembles related alerts, recent deploys and relevant context into a summary for the responder. That framing is the honest one. It is not claiming to find root cause; it is claiming to do the gathering that a human would otherwise do in the first ten minutes while also trying to run the incident.
Pros
- Investigation output lands inside the incident channel and timeline, where the responders already are
- Coordination, status page and retrospective in one product, so the summary is captured rather than lost in chat
- Framed as assistance for the first minutes rather than as automated root cause, which is the correct claim
- Integrates with existing alerting and paging rather than replacing them
Cons
- Not a correlation engine for raw alert volume — noise reduction still belongs upstream
- Quality of any generated summary depends entirely on what integrations it can read, which is your setup work
- Per-user pricing across a large engineering organisation adds up alongside a pager you already pay for
- LLM-generated summaries in an incident channel carry a real risk of being read as findings by whoever joins next
Best for: Teams whose incidents are chaotic to run rather than hard to detect, and who want the first-five-minutes gathering automated.
Pricing: Per-user subscription tiers covering incident response, status pages and the assistive features together.
Rootly
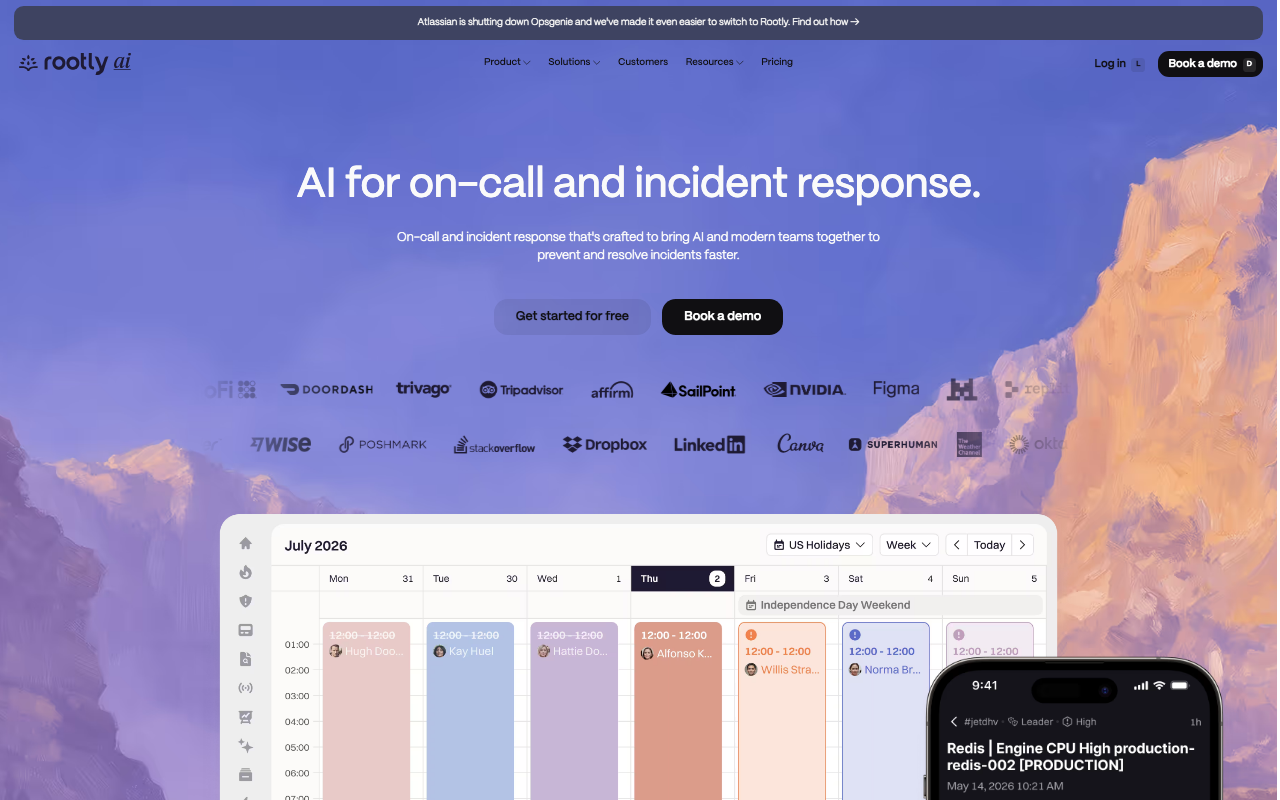
Rootly occupies the same coordination space as incident.io — workflows, roles, timelines, status pages, retrospectives — with a heavy emphasis on automation: workflows that fire on incident events, create the channel, page the right team, open the ticket and post the update without anyone doing it manually. Its AI layer summarises incidents and drafts retrospectives from the timeline. It is also running explicit Opsgenie migration messaging on its homepage, which tells you where it is competing right now.
Pros
- Workflow automation is deterministic and configurable, which is the reliable kind of automation during an incident
- Retrospective drafting from the captured timeline saves genuine hours on the least popular part of the process
- Strong integration surface across chat, ticketing and paging, so it fits an existing stack
- Actively competing for the Opsgenie migration, which means migration tooling and attention
Cons
- Coordination-layer product: it does not reduce alert noise, which is where most teams’ pain actually is
- Drafted retrospectives are a starting point, and a team that ships them unedited learns nothing from the incident
- Per-user pricing on top of the pager and monitoring you already buy
- Overlaps substantially with incident.io, so the choice is fit and price rather than capability
Best for: Teams who want incident process automated end to end and retrospectives drafted from the timeline rather than written from memory.
Pricing: Per-user subscription tiers, with the automation and AI capabilities distributed across the higher tiers.
Keep
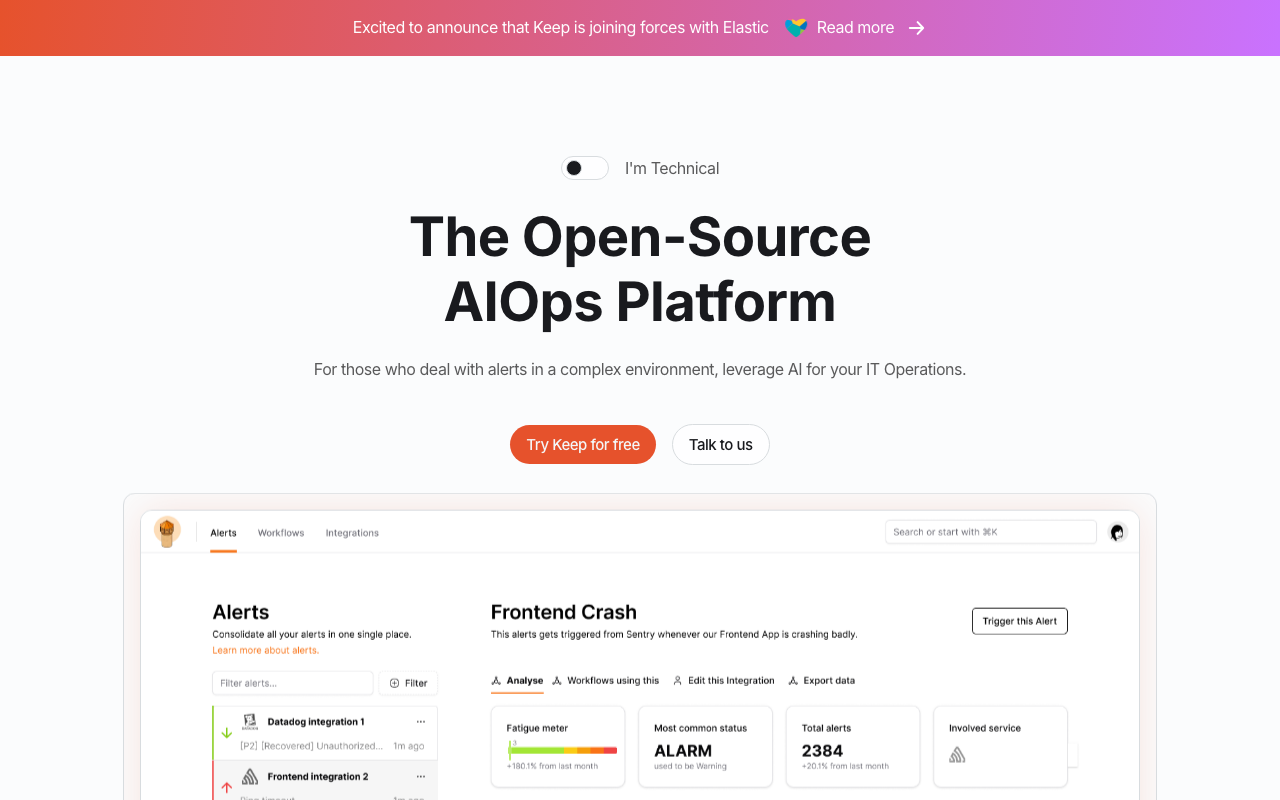
Keep is the open source option in the correlation layer: ingest alerts from many monitoring products, deduplicate and correlate them into incidents, enrich them, and run YAML-defined workflows in response. For teams who want the BigPanda shape without the enterprise contract, it is the credible starting point. Its homepage announces that Keep is joining Elastic, which is worth registering before making it the centre of your alerting architecture.
Pros
- Vendor-neutral correlation you can self-host, so alert data does not have to leave your network
- Correlation rules and workflows are YAML, so grouping logic is explainable and reviewable — the property that matters most at 3am
- Cheapest way to find out whether correlation actually helps your alert volume before buying an enterprise product
- Genuine multi-source ingestion rather than one platform’s view of itself
Cons
- Joining Elastic means the independent roadmap becomes a larger company’s, which is a real factor for a long deployment
- No topology of its own, so causal claims are limited to what your labels and rules express
- Younger project: unusual sources and correlation cases mean more of your own engineering
- Self-hosting places another component in the path between an alert and a human
Best for: Teams who want to test whether correlation helps, on their own infrastructure, before committing to a commercial engine.
Pricing: Open source and self-hostable at infrastructure cost, with a managed offering available.
Robusta
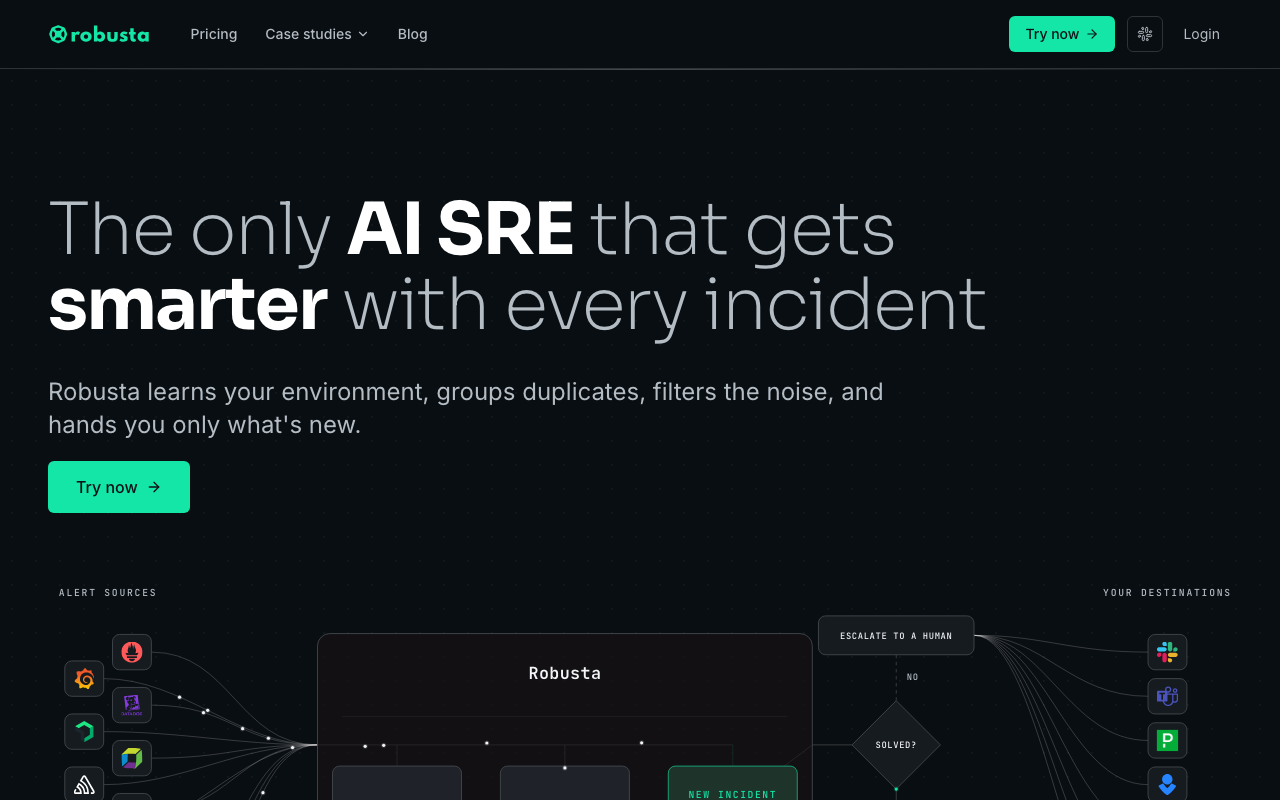
Robusta is the Kubernetes-specific version of the useful half of AIOps, and it is refreshingly unglamorous about it: when an alert fires, it automatically attaches the pod’s logs, the container exit reason, the recent deployment change and a relevant graph, then delivers that enriched alert to chat or a pager. No causal claims, no confidence scores — just the four lookups you were about to do, already done. Its assistant layer adds a language-model explanation on top for teams who want it.
Pros
- Enrichment is deterministic: it runs defined actions and attaches real output, so nothing is inferred
- Kubernetes-native understanding of OOM kills, crashloops, node conditions and deployment changes
- Playbooks are declarative configuration, so “on this alert, run this and attach the result” is reviewable
- Cuts real minutes from the start of an incident, which is the measurable part of this whole category
Cons
- Kubernetes only; nothing outside the cluster is in scope
- Enrichment, not correlation — it improves each alert without reducing how many you get
- Its actions run with cluster permissions, so the enrichment layer holds meaningful access
- The richer automations sit in the commercial tier rather than the open source core
Best for: Kubernetes teams whose alerts are technically correct and practically useless without three manual lookups attached.
Pricing: Open source core at infrastructure cost, with a paid SaaS tier for the hosted platform and additional automations.
K8sGPT
K8sGPT scans a cluster for broken resources — failing pods, unbound volume claims, misconfigured services and ingresses — and explains what it found in plain language, optionally through a language model with a pluggable backend including local models. It is the smallest, most honest instance of the LLM-investigation idea: narrow scope, well-understood failure patterns, and an output that reads as a hypothesis rather than a verdict.
Pros
- Explains the common Kubernetes misconfigurations without anyone needing the right
kubectl describesequence - Pluggable model backend including local models, so cluster details need not leave your network
- Runs as CLI or in-cluster operator, fitting both ad hoc triage and scheduled scanning
- Narrow scope is a feature: it is checking known failure patterns, not claiming general reasoning
Cons
- Coverage stops at well-known resource-level failures; an application-logic incident gets you nothing
- Model-generated explanations are fluent by construction and must be treated as hypotheses to verify
- No correlation, no incident record, no routing — it is a diagnostic aid, not incident management
- Sending cluster state to a hosted model is a data-handling decision to make before enabling it
Best for: Small Kubernetes teams without a platform specialist who want common cluster failures explained during triage.
Pricing: Open source with no licence cost; any hosted model inference is billed by that model provider.
How to choose
Match the tool to which of the three capabilities you actually need, then check the price shape.
If your problem is alert volume, you want correlation, and you should try it before you buy it. Keep, self-hosted, replaying your historical alerts, tells you within a week whether grouping helps enough to justify a commercial engine. If it does and you have many monitoring tools, BigPanda is the vendor-neutral answer; if all your alerts already flow through one pager, PagerDuty’s event rules and grouping may be enough with no new vendor.
If your problem is that nobody wrote the right monitor, you want anomaly detection, and it should be part of the platform holding your telemetry rather than a separate product. Datadog and New Relic both include it. Be selective about where you enable it — aggregate business metrics, not every infrastructure series.
If your problem is diagnosis time, the honest answer is enrichment rather than intelligence. Robusta attaching the crash logs to the crashloop alert saves more minutes than any causal model, and you can verify what it did. Dynatrace Davis is the option worth the money if you want real causal analysis and will run one agent everywhere to get it.
If your problem is that incidents are chaotic to run, you are in the coordination category, not AIOps: incident.io or Rootly, and the incident management guide covers that decision properly.
| Option | What it actually does | Explainable | Picks itself when |
|---|---|---|---|
| BigPanda | Cross-tool alert correlation | Rules plus learned grouping | Many monitoring tools, enterprise estate |
| Moogsoft | Event correlation (legacy — site redirects to other vendors) | Probabilistic clustering | Existing deployments only |
| Datadog Watchdog | Anomaly detection + correlation | Correlational, not causal | Your telemetry is already in Datadog |
| Dynatrace Davis | Causal analysis over observed topology | Yes, shows the graph path | You will run one agent everywhere |
| New Relic | Anomaly detection + issue grouping | Correlational | Ingest-based pricing suits your fleet |
| PagerDuty | Alert grouping + deterministic suppression | Rules are readable | Every alert already flows through it |
| incident.io | Incident coordination + first-minutes summary | Assistive, clearly framed | Incidents are hard to run, not hard to detect |
| Rootly | Coordination + workflow automation + drafted retros | Workflows are deterministic | You want the process automated end to end |
| Keep | Open source multi-source correlation | Yes, YAML rules | Testing whether correlation helps at all |
| Robusta | Kubernetes alert enrichment | Yes, runs defined actions | Alerts arrive without the context to act |
| K8sGPT | Kubernetes resource diagnosis | Model output, verify it | No Kubernetes specialist on the team |
Two more worth naming. Grafana includes investigation and assistant features in its cloud offering that assemble related signals when something fires, which is the natural fit if Grafana is already your query surface — see Grafana Cloud versus Datadog for how that platform choice plays out. And Causely takes a genuinely different approach, building a causal model from service dependencies rather than correlating alerts after the fact; it is early, and worth watching if the causal question is what you care about.
Whatever you buy, set one rule before it goes live: an AI-generated summary is a hypothesis, and the incident notes must record what was verified rather than what was suggested. The productivity gain is real. The failure mode — a fluent, wrong explanation accepted by a tired engineer — is also real, and it costs more than the tool saves.
Needs first-hand data: Take three resolved incidents with known root causes, feed the same alerts, logs and deploy history to the candidate’s investigation feature, and grade each output on whether it named the actual cause, named a plausible wrong cause, or declined to conclude. The middle category is the one that matters, and no vendor will run this test for you.
Frequently asked questions
Does AIOps actually reduce alert noise?
Correlation does, reliably, and it is the part of AIOps worth buying first. Grouping alerts by shared labels, time proximity and topology turns one bad deploy into one incident instead of two hundred pages, and that is mechanical rather than speculative. The caveat is that a large share of the same benefit is available for free from deduplication, grouping and inhibition rules in a router you already run — see best alerting tools. Fix that first, then measure what is left before paying for a correlation engine.
Can AI find the root cause of an incident?
Not in the sense the word implies. What these products produce is a ranked hypothesis, usually the earliest alert in a correlated group weighted by position in a dependency graph. Dynatrace Davis has the strongest version because its topology is continuously observed rather than declared, so its reasoning has real structure underneath. Even then it is bounded by what the agent instruments. Treat every causal claim as a starting point to verify, and be most suspicious when the failure is novel — that is exactly when these systems are weakest and most confident.
Are LLM investigation agents worth it?
For the first five minutes, often yes. They do the four lookups you were about to do — recent deploys, related alerts, error logs, the relevant dashboard — and present them together, which is real time saved during the worst part of an incident. The risk is entirely in how the output is used. A summary that reads as a finished explanation will be believed by whoever joins the channel next, and language models produce fluent narratives regardless of evidence. Adopt them with an explicit norm: summaries are hypotheses, and the timeline records what was verified.
How should I price-compare AIOps tools?
On your worst day, not your average one. Per-event and per-alert pricing is cheap in steady state and peaks precisely during the alert storm you bought the tool to handle, so the bill spikes on the day of your worst outage. Per-node and per-host pricing is predictable and independent of how noisy your monitoring is. Take your largest alert storm from the last year, count the events, and price that single day under each model before comparing anything else.
Related reading
- Best incident management tools — the coordination category these products sit alongside.
- Best alerting tools — the deduplication, grouping and inhibition you should fix before buying correlation.
- Best open source incident management — self-hosted routing and enrichment, including Keep and Robusta.
- Best APM for Kubernetes — where the topology data behind causal analysis actually comes from.
- Best log management for Kubernetes — the log data any investigation agent needs to read.
- Best APM tools — the platforms whose anomaly detection is included rather than sold separately.