Your uptime check is green. Your error rate is flat. A customer emails to say your API has been broken since Tuesday.
They are both right. The check hits /health, which returns 200 because the process is alive. The endpoint the customer integrates with, /v1/orders, still returns 200, still returns valid JSON, and now returns an empty array for a third of requests because a downstream service started returning a slightly different date format and a lenient parser silently dropped the rows it could not read. Nothing that any conventional monitor watches has changed.
This is the gap API monitoring exists to close, and it is not the same gap that uptime monitoring or APM close. Uptime monitoring answers “is it reachable”. APM answers “where is time being spent inside my system”. Neither answers the question your customer is asking, which is “does this endpoint still behave the way the contract says it does”.
There is a second gap that matters just as much and gets even less attention: the APIs you consume. Your payment processor, your identity provider, your shipping rate service, your model provider. When one of those degrades, your service degrades, and you will find out from your own users long before a status page updates. Alerting on the APIs you depend on is a different discipline from alerting on the API you serve, and almost nobody sets it up until after the first incident.
Most teams reading this already have some monitoring. The question is what to add and where the current setup is structurally blind.
Key takeaways
- A global availability number hides the endpoint that matters. SLOs belong per endpoint, weighted by what breaks for the customer when that specific endpoint fails.
- Status codes are an unreliable error signal for many APIs. GraphQL, gRPC and several RPC styles return 200 on failure, so your error SLI has to read the payload or read a trailer.
- Contract drift is the failure mode conventional monitoring cannot see: valid responses that no longer match the documented schema. Detecting it requires comparing live traffic against a spec, continuously.
- Monitor the APIs you consume with the same rigour as the ones you serve, measured from your own network with your own credentials. A vendor status page is a lagging, self-reported signal and should never be your alert source.
API monitoring is three different jobs
Vendors sell all three under one word, which is why comparison is confusing. They have different data sources, different blind spots and different costs.
Synthetic checks. A prober somewhere on the internet calls your endpoint on a schedule with known inputs and asserts on the response. Its strength is that it works when there is no traffic, which is the only way to catch a break at three in the morning on a low-volume endpoint, and it tests the full path including DNS, TLS and your CDN. Its weakness is that it only tests what you wrote a check for, and checks rot: the assertion written eighteen months ago passes against a response that has changed in ways nobody encoded.
Real-traffic observation. An agent, middleware or gateway records actual requests and responses and computes rates, latencies and error patterns from them. Its strength is coverage of everything real users actually do, including the parameter combinations you never thought to test. Its weakness is that it sees nothing when traffic is absent, it cannot distinguish “no requests because it is quiet” from “no requests because clients cannot reach us”, and capturing response bodies creates a data store with all the sensitivity that implies.
Contract verification. Comparing observed request and response shapes against a specification, or against a learned baseline of what they used to be. This is the one most teams do not have, and it is the only one that catches the failure in the opening paragraph.
You want at least the first and third. The second is where the APM tools you already run and the analytics layer overlap, and it is often already partly covered.
Endpoint-level SLOs
An availability number for “the API” is close to meaningless. If /v1/search serves most of your traffic and /v1/refunds serves very little, a global success rate is essentially a report on search, and refunds can be entirely broken without moving it. Meanwhile refunds failing is the one your CEO hears about.
So define objectives per endpoint, or per small group of endpoints that share a failure mode and a consumer. That means a real decision per endpoint, which is work, and it is the work that makes the rest of the system useful.
Pick the SLI deliberately. Availability as “the proportion of requests that did not fail” needs a definition of failure that matches reality. Three traps:
- A 4xx is usually the client’s fault and should not consume your error budget, except that a 429 you emitted because your own capacity planning was wrong absolutely should, and a 404 on a resource that should exist is your bug wearing a client error’s clothes.
- Many APIs return 200 on failure. GraphQL puts errors in a body field. gRPC puts the status in a trailer. Various RPC-over-HTTP styles return an error object with a success status. If your SLI reads only the HTTP status, it is measuring whether the transport worked, which is not what you meant.
- A partial response is a failure your customer experiences and your status code does not report. The empty array in the opening paragraph is a 200.
Latency SLIs need a threshold, not an average. “Average latency under 300 milliseconds” is not an objective anyone can act on, because the average is dominated by the fast majority. State it as the proportion of requests served faster than a threshold, and pick the threshold from what the consumer’s timeout actually is. If your customer’s HTTP client gives up after a certain duration, that duration is your threshold, and everything slower is an error regardless of whether it eventually succeeded.
Alert on burn rate, not on the SLI. Alerting whenever the error rate crosses a line produces pages for brief blips that consumed almost none of the budget, and silence during a slow leak that will exhaust it by Thursday. Burn-rate alerting asks how fast the error budget is being consumed relative to the window, with a fast burn triggering a page and a slow burn opening a ticket. Two windows, two thresholds, two severities. This is the single highest-value change most teams can make to their alerting, and it needs nothing more than the SLI you already compute.
Know which endpoints are unmonitored. The list of endpoints with a defined objective is almost never the list of endpoints you serve. Diff them. The endpoints on the second list and not the first are where your next surprise lives, and inventorying them is its own small project, which the API management layer is usually the best source of truth for.
Needs first-hand data: Take the last six months of customer-reported API incidents and, for each one, record whether any existing monitor fired, how long before the customer report it fired, and which signal it was. The proportion of incidents your customers discovered first is the honest measure of your monitoring, and it is the only number that should drive what you buy next.
Contract drift: the failure conventional monitoring cannot see
Contract drift is when the API keeps working and stops matching its documented shape. It is quiet, it is common, and it is almost always discovered by a consumer rather than a monitor.
The changes worth distinguishing, in rough order of how badly they break consumers:
- A field disappears, or becomes null where it never was. Immediately breaks strictly-typed consumers and any client generated from the spec. The most severe and the easiest to detect.
- A field changes type. A numeric identifier becomes a string, a timestamp changes format, a scalar becomes an object. Some consumers coerce silently and corrupt data downstream, which is worse than crashing.
- An enum gains a value. Entirely valid from your side, and a consumer with an exhaustive switch either throws or falls through to a default that is wrong. This one is routinely shipped without anyone considering it a change at all.
- A field is added. Harmless for tolerant consumers and breaking for strict validators, which is exactly why the tolerant reader principle matters and why some of your consumers ignored it.
- An endpoint appears that is not in the spec. Shadow endpoints, usually internal or debug routes that shipped to production. They are undocumented, unmonitored and unreviewed, and they are a security finding waiting to happen.
- An endpoint stops receiving traffic entirely. A zombie endpoint you could remove, or a broken integration nobody reported. You cannot tell which without asking, and you cannot ask until you know it exists.
There are two ways to detect any of this. Spec-based validation compares live traffic against your OpenAPI document, flagging responses that fail schema validation and requests using parameters the spec does not describe. It gives precise, explainable violations and it only works if your spec is accurate, which means it doubles as a test of whether your spec is maintained. The OpenAPI tooling side of this is where the spec comes from in the first place.
Inferred-schema comparison builds a model of each endpoint’s actual request and response shape from observed traffic and alerts when it changes. It needs no spec, which makes it the only option for the many APIs whose spec is aspirational, and it reports changes rather than violations, so you must decide for each whether it was intended.
The strongest setup runs both: the spec as the declared contract, inference as the check on whether the spec is telling the truth. If they disagree, one of them is wrong and you want to know which.
One thing to plan for before turning any of this on: contract detection requires seeing response bodies. That is a data classification decision, not a monitoring setting. Decide what gets redacted at capture time, before the payload leaves your process, rather than relying on a vendor-side scrub.
Needs first-hand data: Run schema inference over a week of production traffic on an API you believe is well documented, then diff the inferred shapes against your committed OpenAPI document endpoint by endpoint. Count undocumented endpoints, undocumented fields, and fields whose real nullability differs from the spec. Publish those three counts. Every team assumes the number is near zero and I have never seen that turn out to be true.
Alert on the APIs you depend on, not just the one you serve
Your service’s availability is bounded by the availability of everything it calls synchronously. That is arithmetic, and yet dependency monitoring is almost always an afterthought.
The wrong signal is the vendor’s status page. It is self-reported, it updates after a human decides an incident is worth declaring, it reflects the vendor’s global view rather than your region and your account, and partial degradation affecting a subset of customers frequently never appears on it at all. By the time it turns yellow you have been paging for an hour.
The right signals come from your own side, and there are two complementary ones.
Passive, from your client. Instrument every outbound call to a third party with the same rigour you apply to inbound: success rate, latency distribution, timeout rate and retry rate, tagged by dependency and operation. Then treat those as SLIs with their own objectives. The retry rate is the most useful early indicator in the set, because retries absorb degradation and hide it from your success rate until they stop being enough. If you run circuit breakers, export their state as a metric, because a breaker that opened is a dependency incident your application already detected and nobody was told about.
Active, from synthetic checks. Passive monitoring only sees the traffic you happen to send, which means a dependency used by a nightly job is unmonitored for twenty-three hours a day. Run a scheduled check against each critical dependency using a real credential and a real operation, from your own network egress. This catches the cases that matter most and are hardest to see otherwise: your credential expired, your IP got rate limited, the vendor changed a response field, a certificate in the chain is about to expire, or DNS resolution from your VPC specifically is failing while the rest of the world is fine.
Keep these checks cheap and read-only, and be honest that you are adding load to someone else’s service. A sensible check calls a lightweight read endpoint at a modest interval, not a write path.
The deeper reason to do this is organisational rather than technical. When a vendor degrades, the argument inside your company is always “is it them or us”, and it consumes the first half of every incident. Having your own measurement of their API, collected continuously, from your network, ends that argument in a minute. It also gives you something concrete to put in front of them, which changes the support conversation entirely. The overlap with general uptime probing is covered in the uptime and synthetic monitoring guide.
Treblle
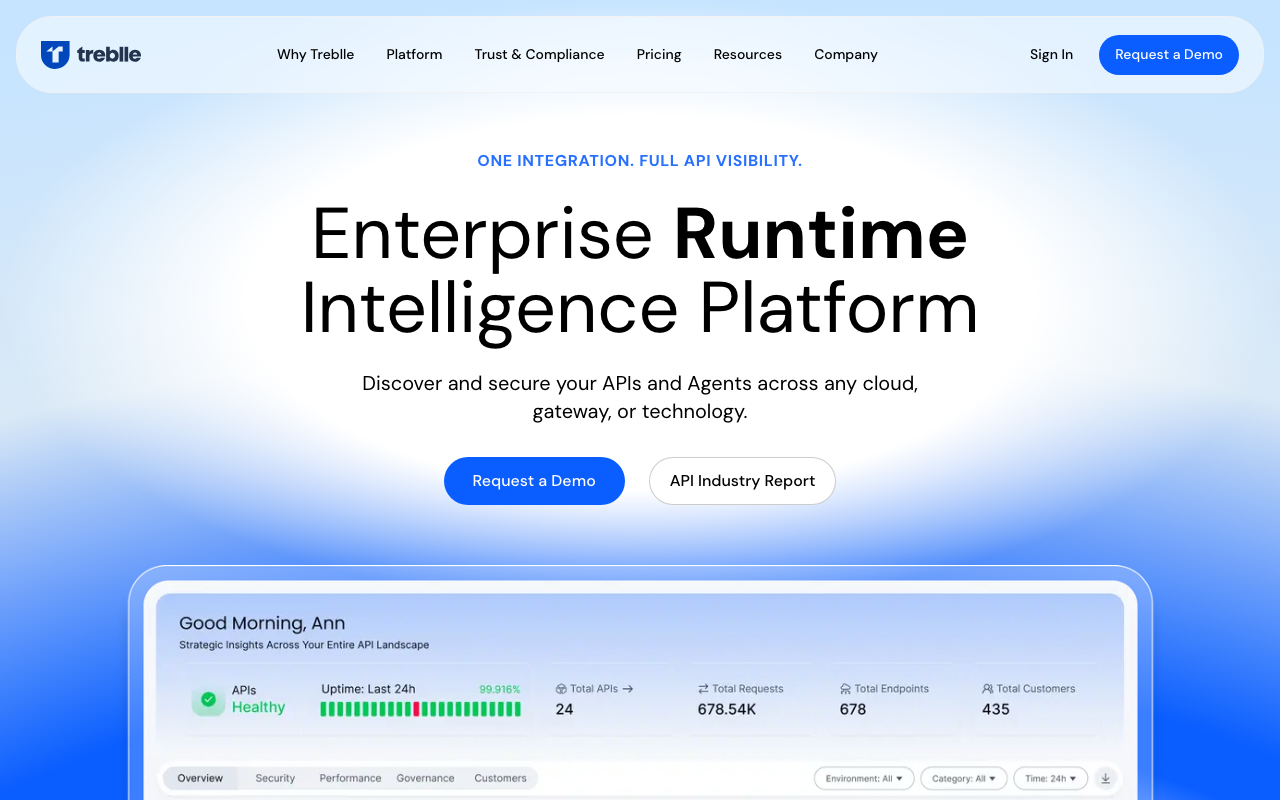
Treblle installs as middleware or an SDK inside your application and observes real API traffic from the inside: per-endpoint request and response capture, latency and error breakdowns, automatically generated documentation derived from observed traffic, and quality and security scoring of each endpoint. Being in-process means it sees the request as your framework saw it, including routes that never appear in any spec.
Pros
- Documentation generated from observed traffic means the docs describe what the API does rather than what someone intended, which surfaces undocumented endpoints automatically
- Per-endpoint views are the design centre rather than a drill-down, which matches how API problems are actually scoped
- In-process capture sees the real route and the real payload, so shadow endpoints and unexpected parameters show up without extra configuration
- Endpoint scoring gives non-specialists a concrete signal about API quality, which is useful for driving cleanup work across teams
Cons
- Request and response payloads leaving your process means redaction configuration is load-bearing, and getting it wrong creates a sensitive data store by accident
- In-process middleware is a dependency in your request path with its own overhead and failure modes, which you must be willing to own
- Coverage depends on an SDK existing and being current for each language and framework you run, and polyglot estates will find gaps
- It observes traffic, so it cannot tell you an endpoint is broken when nobody is calling it, which means you still need synthetic checks
Best for: Teams who want per-endpoint visibility and traffic-derived documentation with a middleware install rather than a monitoring project.
Pricing: Usage-based metering on requests observed with tiered plans adding retention, team features and enterprise controls.
Moesif
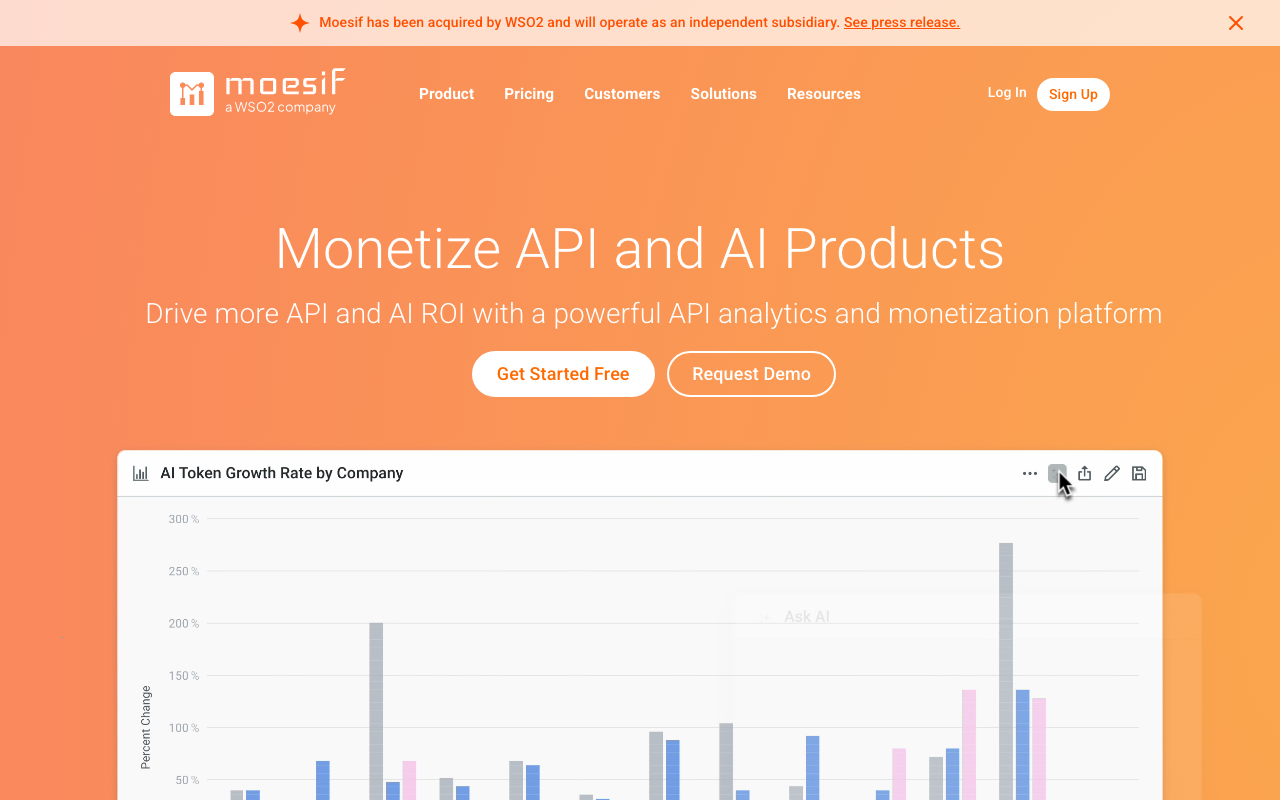
Moesif sits closer to the analytics end of this category: it captures API traffic and organises it by the customer and user behind each call, so you can see which consumer is affected by an error, which endpoints a given account uses, and how usage is trending per customer. It also supports governance rules that act on live traffic and alerting built on those same dimensions.
Pros
- Attribution to a customer and user identity turns “error rate is up” into “these four accounts are affected”, which changes what you do about it
- Behavioural cohorts and funnels across API usage answer adoption and deprecation questions no infrastructure monitor can
- Governance rules acting on live traffic let you block, warn or meter specific consumers without a gateway change
- Alerting keyed on per-customer behaviour catches the case where one important account breaks while aggregate metrics look normal
Cons
- The analytics orientation means it is not a replacement for operational monitoring, and you will still run uptime and synthetic checks alongside it
- Capturing traffic with customer identity attached produces a rich and sensitive dataset, which raises the stakes on retention and access control
- Pricing that scales with events makes high-volume, low-value traffic expensive to observe, which pushes teams into sampling exactly where they need completeness
- It is a broad platform and the setup effort to get value beyond basic dashboards is real, so it rewards commitment rather than a trial
Best for: Teams who need to know which specific customers are affected by an API problem, and who will also use the usage data commercially.
Pricing: Usage-based metering on API events ingested with tiered plans, and enterprise agreements adding governance and retention.
Checkly
Checkly is monitoring as code. Checks are defined in a repository, including Playwright-based browser flows and API checks with assertions, then deployed with a CLI or infrastructure-as-code alongside the service they monitor. Checks run from multiple global locations on a schedule. The pitch is that a monitor belongs in the same pull request as the endpoint it monitors, and it is a good pitch.
Pros
- Checks living in the repository means they get reviewed, versioned and updated in the same change that alters the endpoint, which is the only thing that stops check rot
- API checks with real assertions on response bodies catch contract changes that a status-code probe never would
- Multiple global locations distinguish “the API is down” from “the API is unreachable from one region”, which is a distinction that matters more than teams expect
- The same tool covers API checks and browser flows, so the customer-facing journey and the API behind it are monitored from one definition
Cons
- Synthetic only: it sees exactly what you wrote a check for and nothing about real user traffic, so it cannot find problems you did not anticipate
- Monitoring as code requires a team that will actually maintain the checks, and one that will not is better served by something click-configured
- Frequent checks from many locations multiply quickly against usage-based pricing, so meaningful coverage needs a deliberate budget
- Contract drift detection is only as good as your assertions, which means it is manual, and broad schema validation is work you author yourself
Best for: Engineering teams who will treat monitors as code and want API and browser checks reviewed alongside the services they cover.
Pricing: Usage-based metering on check runs with tiered plans by frequency, locations and retention.
Postman
If your team already maintains Postman collections, monitors are the shortest path to scheduled checks: an existing collection runs on a schedule from selected regions, the tests you already wrote become assertions, and failures alert. The value is not depth, it is that the artifact already exists and the incremental cost of scheduling it is close to zero.
Pros
- Reuses collections and tests the team already wrote, so scheduled monitoring costs almost nothing to start
- Multi-step collection runs naturally test sequences like authenticate, create, read and delete, which single-request probes cannot
- Non-specialists can create and adjust monitors without writing code, which broadens who can add coverage
- Results sit next to the collections and documentation, keeping the API’s surface in one place
Cons
- Monitoring is a secondary feature of a design and testing product, and it shows in alerting depth, run frequency and diagnostic detail
- Collections drift from reality unless someone maintains them, and a stale monitor that passes is worse than no monitor
- No view of real production traffic at all, so contract drift on parameter combinations nobody wrote a test for is invisible
- Run frequency and regions are constrained by plan in ways that limit it as a primary operational monitor
Best for: Teams already standardised on Postman who want scheduled checks on existing collections without adopting another tool.
Pricing: Included with paid plans on a per-user basis with monitored run allowances, and additional runs metered above the plan allowance.
Datadog

Datadog’s API tests and multistep tests run from managed global locations or from private locations inside your network, with assertions on status, headers, body content and response time. The reason to choose it over a specialist is correlation: a failing synthetic test links directly to the traces, logs and infrastructure metrics from the same window, in the platform your on-call already opens.
Pros
- A failed synthetic check leads straight into the trace and logs for that request, which collapses the first ten minutes of an investigation
- Private locations run checks from inside your own network, which is the only way to monitor internal APIs and to measure a third-party dependency from your real egress path
- Multistep tests handle authenticated sequences with variables extracted between steps, covering realistic flows rather than single calls
- One alerting, escalation and on-call configuration covers synthetics alongside everything else, so there is no second notification pipeline
Cons
- Another meter on a bill that is frequently already the largest line item in the observability budget, and synthetic runs are metered separately from everything else
- Contract validation is assertion-based and manual; there is no schema inference telling you an endpoint’s shape changed
- The breadth that makes it valuable also makes it heavy for a team that wants API monitoring and nothing else
- Per-endpoint SLO definition across a large API surface is significant configuration work, and nothing generates it for you
Best for: Teams already on Datadog who want synthetic API checks correlated with traces and logs without introducing a second vendor.
Pricing: Usage-based metering on synthetic test runs, priced separately for API and browser tests, layered on the existing platform subscription.
Better Stack
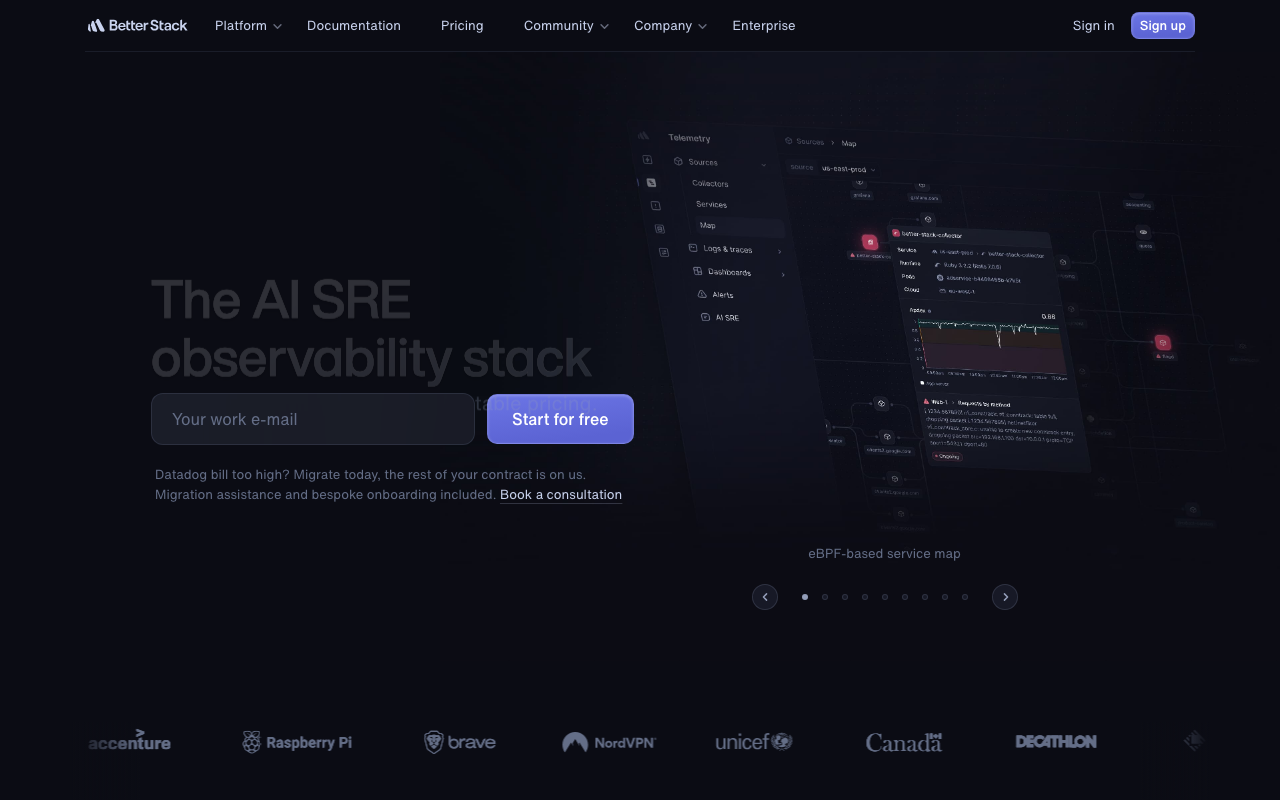
Better Stack packages uptime monitoring with incident management, on-call scheduling and status pages in one product. For API monitoring specifically that means HTTP monitors with assertions, heartbeat monitoring for scheduled jobs, and a direct path from a failed check to a paged human and a public status update, without integrating three tools to get there.
Pros
- Detection, escalation and public communication are one product, which removes the integration work and the failure mode where an alert fires and nobody is paged
- Heartbeat monitoring covers scheduled jobs and batch integrations, which is the category of failure that silently produces nothing and alerts nobody
- Fast to configure, so meaningful coverage exists the same day rather than after a monitoring project
- Status pages driven by the same checks keep customer communication consistent with what you are actually seeing
Cons
- HTTP checks with assertions are shallower than a purpose-built synthetic platform, and complex authenticated multistep flows are awkward
- No visibility into real production traffic, so it cannot detect contract drift or per-customer failures
- Breadth across monitoring, on-call and status means each piece is competent rather than best in class
- Deep per-endpoint SLO modelling with burn-rate alerting is not its strength, so sophisticated objectives need another layer
Best for: Small teams that want uptime checks, on-call and a status page from one vendor with minimal setup.
Pricing: Tiered subscription by number of monitors and check frequency with seat-based components for the on-call and incident features.
APIToolkit
APIToolkit is aimed directly at the contract problem. It observes live API traffic, infers each endpoint’s request and response schema, and alerts when the observed shape changes, including new fields, changed types, disappearing fields and endpoints that were never documented. That inference is the capability most of this list lacks, and it is the one that catches the failure this article opened with.
Pros
- Schema inference from live traffic detects contract drift without requiring an accurate OpenAPI document, which matters because most specs are not accurate
- Surfaces undocumented and shadow endpoints automatically, giving you an inventory you almost certainly do not have
- Combines anomaly detection with per-endpoint performance and error views, so one tool covers drift and operational monitoring
- Generated documentation from observed behaviour keeps the published contract closer to reality than a hand-maintained spec
Cons
- Inference reports changes rather than violations, so someone must triage each one as intended or not, and a noisy period after onboarding is guaranteed
- Payload observation means the same sensitivity and redaction questions as any traffic-capturing tool, and they must be settled before you enable it
- A smaller vendor and ecosystem than the incumbents, which affects integration breadth and the depth of available operational knowledge
- Traffic-based by design, so quiet endpoints stay invisible and synthetic checks remain necessary alongside it
Best for: Teams whose API contract drifts faster than their documentation and who need drift detected from real traffic rather than from a spec nobody updates.
Pricing: Usage-based metering on requests observed with tiered plans, and a self-hosted option for teams that cannot send payloads out.
How to choose
Work through this in order and you will end up with two tools, occasionally three, which is the correct answer for most teams.
Start with the incident archaeology. Pull the last six months of API problems and sort them into three buckets: it was unreachable, it was slow or erroring, or it returned something structurally wrong. Whichever bucket is largest determines what you buy first, and it is very often the third, which is the one nobody has tooling for.
Then answer whether your spec is true. If your OpenAPI document is generated from code and validated in CI, spec-based contract testing is cheap and you mostly need assertions in synthetic checks. If your spec is written by hand and drifts, you need inference, and no amount of discipline will substitute.
Then decide whether payloads can leave your network. This eliminates faster than any feature comparison. If they cannot, you are looking at self-hosted options or at synthetic-only monitoring where you control the request and response entirely.
Then add dependency monitoring regardless of what else you chose, because it is cheap, it is almost certainly missing, and it pays for itself in the first vendor incident.
A realistic end state: synthetic checks defined as code next to the service, one traffic-observing tool for per-endpoint behaviour and drift, per-endpoint SLOs with burn-rate alerts wherever your metrics already live, and a handful of scheduled checks against each critical third-party dependency running from your own network.
| Tool | Data source | Contract drift | Dependency checks | Picks itself when |
|---|---|---|---|---|
| Treblle | In-process middleware | Traffic-derived docs | No | You want per-endpoint visibility from a middleware install |
| Moesif | Traffic capture with identity | Limited | No | You need to know which customers are affected |
| Checkly | Synthetic, code-defined | Manual assertions | Yes | Monitors belong in the same pull request as the code |
| Postman | Synthetic, collection runs | Manual assertions | Yes | The collections already exist and are maintained |
| Datadog | Synthetic plus correlated telemetry | Manual assertions | Yes, via private locations | A failed check must land next to traces and logs |
| Better Stack | Synthetic plus heartbeats | No | Yes | Detection, on-call and status page from one vendor |
| APIToolkit | Traffic capture with inference | Yes, inferred | No | The contract drifts faster than the documentation |
Frequently asked questions
Is API monitoring different from APM?
Yes, and the distinction is about the boundary. APM instruments the inside of your system to explain where time goes and which component failed. API monitoring watches the contract at the edge: does this endpoint return what it promised, within the latency the consumer expects, for the consumers who depend on it. You want both, and APM will not tell you that a response field changed type.
How many synthetic checks should I run against each endpoint?
Fewer than you think, against the endpoints that matter most, with real assertions on the body rather than a status-code check. A small number of well-maintained checks on critical paths beats broad shallow coverage, because breadth encourages the status-code-only check that would have passed straight through the failure this guide opened with. Add coverage when an incident shows you a gap.
Can I detect contract drift without an OpenAPI spec?
Yes, through schema inference from live traffic, which builds a baseline of each endpoint’s observed shape and alerts on deviations. It needs no spec, which is exactly why it works on the many APIs whose spec has quietly stopped being true. The tradeoff is that it reports changes rather than violations, so every alert needs a human decision about whether it was intended.
How do I monitor an API I do not control?
From your own network, with your own credentials, calling a cheap read-only operation on a schedule, and separately by instrumenting every outbound call your application already makes with success rate, latency, timeout rate and retry rate. Do not rely on the vendor’s status page as an alert source. It is self-reported and it lags, and regional or account-scoped degradation frequently never appears on it.
Should error budget alerts page someone?
A fast burn should page, because at that rate the budget is gone within hours. A slow burn should open a ticket, because it needs attention this week and not tonight. Alerting on the raw SLI crossing a threshold does neither well: it pages for blips that cost nothing and stays quiet during the leak that actually matters.
Related reading
- Best API management platforms — the control plane that usually holds the endpoint inventory your SLOs need.
- Best APM tools for developers — the inside-the-system half of the picture that API monitoring does not cover.
- Best uptime and synthetic monitoring tools — the broader probing layer, including the dependencies you do not control.
- Best API analytics tools — the same traffic read for adoption and per-consumer usage rather than failure.
- Best OpenAPI and Swagger tooling — where an accurate spec comes from, which decides whether contract testing is cheap.
- Best alerting tools — routing burn-rate alerts to a human without waking the wrong one.