Engineering analytics platforms sell a single promise: visibility into a function that has historically been opaque to everyone outside it. Finance can read its own numbers. Sales has a pipeline. Engineering has a roadmap, a headcount, and a recurring conversation where someone asks why the thing is taking so long and gets an answer nobody can verify.
The platforms in this category answer that by instrumenting the systems engineers already use. Git, the forge, the tracker, the CI pipeline, the incident tool, sometimes the calendar and the IDE. From those events they compute delivery metrics, work allocation, cycle-time breakdowns, capacity models and, in several cases, per-person activity summaries.
The capability is real. So is the failure mode, and it is not subtle. These tools are installed by managers, configured by managers, and read by managers, about work done by people who were not consulted and cannot see what is being said about them. That dynamic, not the accuracy of any particular chart, is what determines whether the rollout produces better decisions or a quiet collapse in candour that takes two years to notice.
Most buying guides for this category skip that entirely and rank on feature count. I would rather cover it first, because if you get it wrong the feature comparison does not matter.
Key takeaways
- Delivery metrics are the commodity here. What separates these platforms is allocation reporting, survey data, capacity modelling and forecast support, so pick on which of those you need.
- Accuracy is bounded by your data hygiene. Allocation reporting reflects your tracker labelling, not reality, and it looks equally authoritative either way.
- Individual-level metrics damage trust, and the damage does not reverse when you disable the feature. Decide the policy before the pilot, not after the first uncomfortable dashboard.
- The deployment that works has the team seeing its own data first, definitions published internally, and an explicit written commitment that none of it enters performance reviews.
What these platforms do beyond the four delivery metrics
Every product here computes deployment frequency, lead time, change failure rate and recovery time. Those four come from a research framework covered in detail in engineering metrics and DORA tools, and they are table stakes rather than a differentiator. What actually varies:
Cycle time decomposition. Splitting the life of a change into coding, pickup, review and deploy stages. This is the most practically useful capability in the category, because pickup time, the gap between a PR being ready and someone starting to read it, is usually the largest single stage and the easiest to fix. A total cycle time tells you things are slow. A stage breakdown tells you which meeting to have.
Investment and allocation reporting. What share of engineering effort went to new product work, maintenance, keeping the lights on, incident response, and platform work. This is the question executives are usually asking when they ask for engineering metrics, and it is the hardest one to answer honestly, because the answer is derived from issue labels that engineers apply inconsistently under time pressure.
Capacity and forecast modelling. Given historical throughput, when is this epic likely to land. Useful as a range, dangerous as a date, and the products differ on whether they present it as a distribution or as a commitment.
Developer experience surveys. Structured periodic questions about friction: build times, test flakiness, deployment confidence, clarity of ownership, time lost waiting on other teams. This catches everything that never touches git, which is a large share of what actually slows people down.
Work-type and rework analysis. How much of the code written this month replaced code written last month. Interesting as a signal about requirements churn or architectural instability, and easy to misread as a signal about individuals.
Cost and capitalisation support. Mapping engineering time to projects for finance purposes. Unglamorous, and often the reason the budget for one of these tools exists at all.
Incident and on-call load. How much of a team’s capacity is being consumed by operational work. This one is frequently the most actionable output in the whole product, because it turns “the team feels underwater” into a number a planning conversation can act on.
Pick two of those that you actually need. Every platform will demo all of them.
SPACE: the framework that exists because delivery metrics are not enough
SPACE is a productivity framework published by researchers who were explicit that no single metric captures developer productivity, and that measuring only what systems emit will systematically miss most of it. The acronym covers five dimensions: Satisfaction and wellbeing, Performance, Activity, Communication and collaboration, and Efficiency and flow.
Its central instruction is that you should measure across at least three of those dimensions, and that at least one should be a perceptual measure, meaning you ask people rather than instrument them. That is the part vendors quote least often, because surveys are harder to sell than dashboards.
What it gives you
- A structured argument against single-metric productivity measurement, which is useful ammunition when someone asks for one number
- Explicit legitimacy for perceptual data, so “the team says the build is unbearable” becomes evidence rather than anecdote
- A reminder that activity metrics, the easiest ones to collect, are the least meaningful in isolation
- Coverage of collaboration and flow, which are invisible to any tool reading only git history
What it does not do
- It supplies no thresholds, no benchmarks and no scoring. There is no SPACE number, and any vendor implying otherwise has invented it
- It does not tell you which metrics to use within each dimension, which is where all the real work is
- Applying it properly requires running surveys, which needs sustained participation and something visibly changing afterward
- It is a measurement philosophy, not an improvement plan. Knowing satisfaction is low does not tell you what to fix
Treat SPACE the way you would treat a research method: it constrains what conclusions you are allowed to draw, and that is its value. It is not something you buy.
Data source requirements, and what each one costs you
Accuracy here is entirely a function of what you connect and how disciplined your team is inside those systems. Worth knowing before the sales call, because the demo runs on clean data.
Git and the forge. Universally required, and the cheapest to connect. Gives commits, PRs, reviews, timestamps and branch history. Caveats: squash-merge workflows collapse commit history, monorepos need path-based service mapping that someone has to maintain, bot commits distort everything unless filtered, and vendored dependency updates can swamp the signal. Ask how each product handles all four.
The issue tracker. Required for anything about allocation, investment or forecasting. This is where accuracy goes to die. Allocation reporting works by reading issue types, labels, epics and links, so the output is a direct function of whether engineers label a ticket honestly at 5pm on a Friday. Two teams with different labelling habits will produce incomparable allocation charts, and the chart gives no indication of that.
CI and deployment systems. Needed for deploy frequency and lead-time-to-production that means anything. Many teams connect the forge and stop, which leaves lead time measured to merge rather than to production, quietly excluding the part of the pipeline most likely to be the bottleneck.
Incident and on-call tooling. Needed for change failure rate and recovery time, and for operational load reporting. Inherits your incident declaration discipline entirely, which is its own can of worms.
Calendar data. Some products ingest it to compute meeting load and focus time. Genuinely useful as a team aggregate, and the single most invasive integration in this list when it is not aggregated. Treat it with suspicion.
IDE and local activity telemetry. A small number of products offer it. My position is plain: do not. The marginal insight is low, and the cost of your team learning that their editor reports upward is a change in working relationship that no dashboard repays. If a vendor leads with this, it tells you who they think the customer is.
Needs first-hand data: Before a pilot, pull one quarter of your own tracker data and calculate what share of completed issues have a type or label that a machine could map to an investment category. If it is low, allocation reporting will be fabrication with a chart around it, and the honest first project is labelling discipline, not a platform purchase.
Team pushback is real, and it is usually correct
Here is what actually happens when one of these gets installed without groundwork.
Someone mentions in standup that a dashboard now shows PR counts. Within a week, three things change. PRs get smaller in a way that does not correspond to smaller units of work, because two PRs look better than one. Reviews get faster and shallower, because review latency is on a chart and review depth is not. And the quiet work stops being volunteered, because pairing with a struggling colleague for an afternoon shows up as a day with no commits.
None of that is bad faith. It is a rational response to being measured on a proxy. The engineers are behaving exactly as the incentive system instructs, and the incentive system was installed by whoever turned on the dashboard.
The second-order effect is worse and slower. People stop saying things are hard. If the tool is understood to be reporting upward, the cost of admitting that a subsystem is a mess, or that you spent two days reading code before making a change, goes up. What you lose is the flow of honest information that made engineering management possible in the first place, and you lose it permanently, because trust is much slower to rebuild than to spend.
Individual-level metrics are the trigger. This is the specific line. Team-level aggregates describe a system. Per-person dashboards describe people, and every person can see that they do. The metrics available at individual level, commit count, PR count, lines changed, review throughput, coding days, all reward volume and penalise the exact behaviours senior engineers are paid for: deleting code, preventing projects, mentoring, and spending a day thinking before writing fifty lines.
What works, in order:
- Decide the policy first and write it down. Team-level aggregation only, nothing in performance reviews, the team sees its own data before anyone above them. If you cannot get that agreed, you have learned something important about why the tool was requested.
- Tell the team before installing, not after. Including what is collected, who can see it, and what it will be used for. Someone discovering the tool by accident is the worst possible start.
- Publish the definitions. Which event starts the lead-time clock, how change failure rate is inferred, what counts as a deployment. Let people argue with the measurement. An argument about definitions is healthy; resentment about a number nobody can interrogate is not.
- Start with one metric and one problem. Pickup time is the best candidate: nobody is individually to blame for it, it responds to a review rotation within a fortnight, and fixing it visibly helps the people being measured. A first win that benefits the team buys you the rest of the programme.
- Do not set targets on the metrics that are classification policy. Change failure rate and recovery time both improve instantly if you declare fewer incidents.
Needs first-hand data: Run a short anonymous question to your engineers before the pilot: do you expect this data to be used in performance evaluation. Record the distribution. If the expectation is yes, the metrics will be optimised against from the first week, and what you will be measuring is the optimisation. That result is worth more than any vendor bake-off.
LinearB
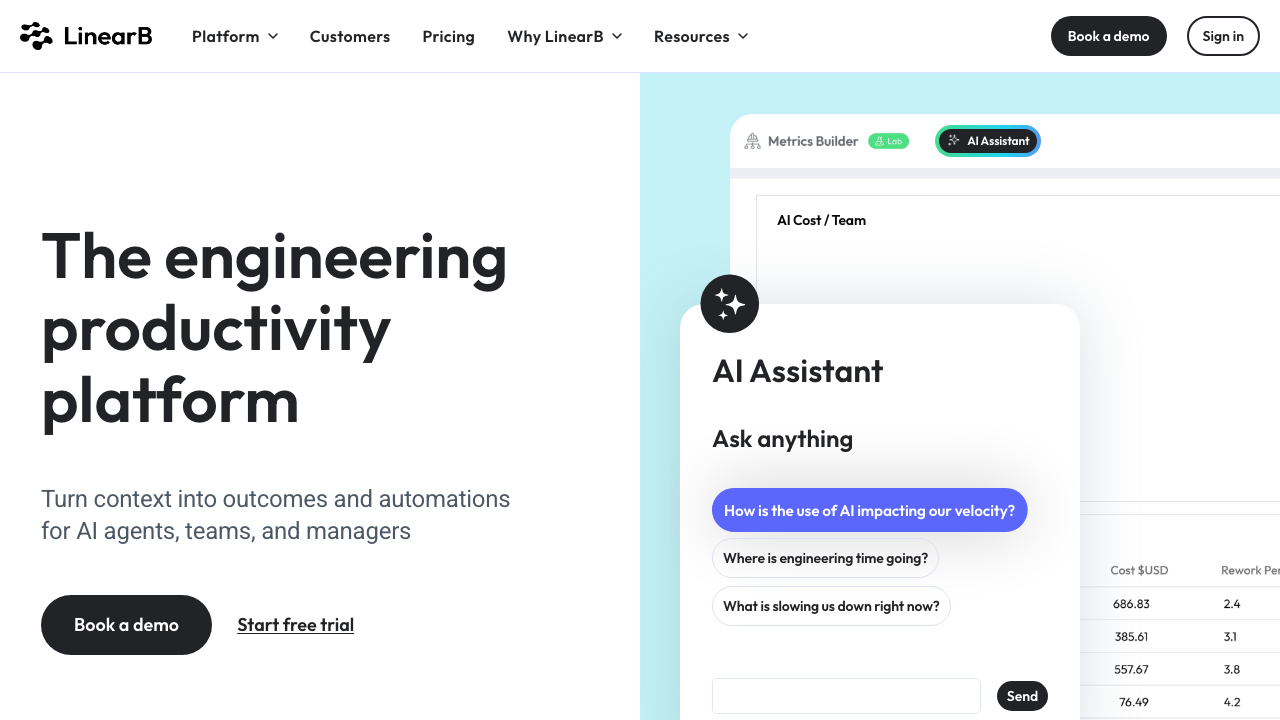
LinearB combines delivery metrics with an automation layer that acts inside the forge: nudging stale pull requests, routing reviewers, enforcing size limits and posting workflow rules as checks. That makes it the most interventionist product in this category. If your diagnosis is that PRs sit unread for days, this is the tool that will do something about it rather than charting it, and that is either exactly what you want or exactly the friction your team will resent.
Pros
- Strong PR-stage decomposition, including the pickup-time view that most teams find immediately actionable
- Automation acts in the developer’s existing workflow rather than requiring anyone to open a dashboard
- Goal-setting and improvement-cycle framing built in for teams running this as a programme
- Combines tracker and code data, so work type and delivery flow sit in one view
Cons
- The bot is opinionated, and a team that did not agree to the rules experiences it as surveillance with a chat interface
- Individual views are readily accessible, so the governance conversation cannot be deferred
- Tracker-derived metrics carry your labelling inconsistency forward without flagging it
- Automation rules accumulate and nobody feels confident deleting them later
Best for: Teams whose specific, agreed problem is pull request flow, and who want workflow enforcement rather than reporting.
Pricing: Per-contributor subscription with tiers, with automation and goal-setting above the base metrics tier.
Swarmia

Swarmia is the product in this list most deliberately designed around team ownership. The default framing is that a team looks at its own data, agrees a working agreement such as a WIP limit or a review response commitment, and tracks itself against that rule rather than against a vendor benchmark. It combines delivery metrics, investment distribution and survey capability, which covers most of what the category offers without pushing toward individual measurement.
Pros
- Working agreements let improvement targets come from the team, which is the single biggest predictor of whether this sticks
- Investment reporting and delivery metrics in one product, so the executive question and the team question share a source
- Survey capability alongside system metrics, covering friction that git cannot see
- Product design pushes toward team aggregation by default rather than making it a configuration decision
Cons
- Investment distribution accuracy still depends entirely on tracker hygiene, whatever the framing
- Fewer forge-side automation capabilities than the workflow-first tools, so it reports rather than intervenes
- Org-hierarchy rollups for very large engineering organisations are less developed than the enterprise platforms
- The team-first philosophy is a poor fit if the actual requirement is top-down reporting, and you should notice that mismatch early
Best for: Organisations that want the visibility without spending trust, where teams will own their own improvement.
Pricing: Per-developer subscription with a free tier for small teams, tiered by enabled modules.
Jellyfish
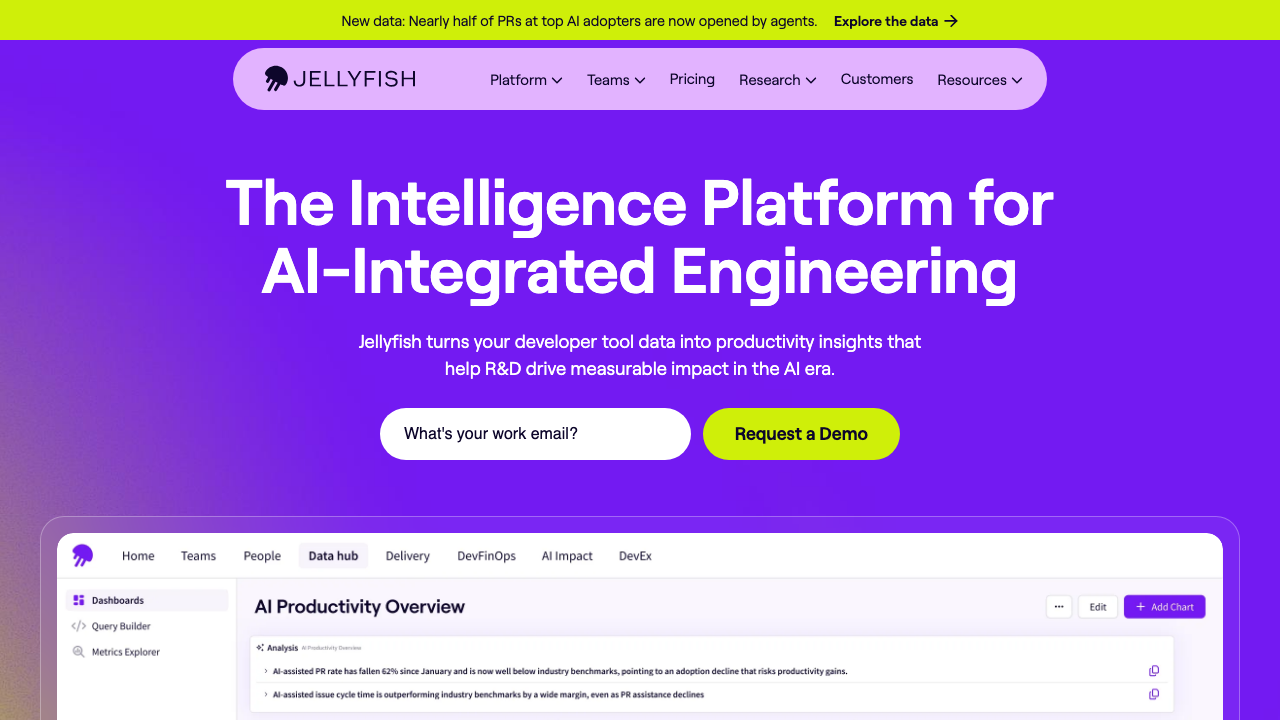
Jellyfish is built for the conversation between an engineering executive and the rest of the leadership team. Its centre of gravity is allocation: mapping engineering activity to initiatives, roadmap versus maintenance versus operational work, and supporting software capitalisation. Delivery metrics are present but not the point. Buying this primarily for cycle-time analysis means paying enterprise prices for the part you use least.
Pros
- Allocation and investment reporting designed for a finance and board audience, including capitalisation workflows
- Handles large multi-team, multi-business-unit organisations and hierarchy rollups properly
- Ties engineering activity to initiatives, so the narrative is about investment rather than about commits
- Planning and capacity views that support headcount conversations with something other than assertion
Cons
- Output looks authoritative regardless of how inconsistent the underlying issue data is, which is a real hazard with this audience
- The people generating the data are rarely the people reading the reports, the exact dynamic that erodes candour
- Enterprise sales, annual contracts and meaningful implementation effort before first value
- Lighter than the specialists on the PR-stage detail engineers can actually act on
Best for: Larger engineering organisations where the binding question is investment allocation to non-engineering stakeholders.
Pricing: Annual enterprise contracts scaled by engineering headcount, quoted rather than published.
Haystack
Haystack is the focused option: delivery metrics and PR flow, without allocation modelling or capitalisation reporting. It leans on forge data as the primary source, which means a shorter path from connecting it to seeing something true, and no dependency on tracker discipline you may not have. For a team that wants to know whether cycle time is degrading and does not want to run a measurement programme, the narrower scope is the feature.
Pros
- Quick to connect and interpret because it does not depend on tracker hygiene
- Bottleneck identification on PR stages rather than an undifferentiated wall of charts
- Scope small enough that a single team can adopt it without an organisational initiative
- Sensible way to test whether this category is worth a larger commitment
Cons
- No meaningful allocation or capitalisation reporting, so it will not answer the executive question
- Work that does not flow through pull requests is effectively invisible
- Smaller vendor, which matters for procurement, security review and long-term commitments
Best for: A single team or small engineering organisation wanting delivery flow visibility without a programme around it.
Pricing: Per-developer subscription with tiers, positioned below the enterprise platforms.
DX
DX approaches the problem from the research side, pairing periodic developer surveys with system-derived metrics. The premise is the SPACE argument made into a product: most of what slows engineers down never appears in version control. Waiting on another team, unclear code ownership, a local environment that takes an hour to rebuild, tests nobody trusts. Surveys surface those, telemetry does not.
Pros
- Captures the friction categories that every telemetry-only product structurally misses
- Survey instrument designed by people who research this, rather than a feedback form bolted onto a dashboard
- Pairs perceptual and system data, so a complaint can be checked against pipeline evidence
- Well suited to justifying platform and developer experience investment, where before-and-after is largely experiential
Cons
- Depends on sustained survey participation, which decays fast if nothing visibly changes after a round
- Slower feedback loop than a live dashboard by design, which frustrates stakeholders expecting real-time numbers
- Aimed at organisations large enough to have a dedicated platform or developer experience function
- Enterprise engagement model rather than self-serve
Best for: Organisations with a platform team that needs to know which friction to remove next and prove that removing it helped.
Pricing: Annual contracts scaled by engineering headcount, sold as a programme rather than a dashboard subscription.
Code Climate Velocity
Velocity is Code Climate’s engineering analytics product, sitting beside the static analysis product the company is better known for. Its pitch is the pairing: delivery and review metrics alongside code health data from the same vendor, so a conversation about slow review can sit next to a conversation about the files that make review slow. That adjacency is genuinely useful, and it is the reason to consider it over a pure metrics product.
Pros
- Delivery metrics adjacent to code health data from the same source, which few competitors can offer
- Review-stage analytics that connect to the specific files and modules involved
- Existing Code Climate customers avoid adding another vendor and another identity integration
- Useful framing for teams whose delivery problem is genuinely a code quality problem
Cons
- The vendor’s strategic emphasis has shifted over time, so confirm current availability and roadmap directly before committing
- Weaker on investment allocation and capitalisation than the executive-focused platforms
- Historically strong in per-developer reporting, which means the governance policy needs to be set deliberately
- Tighter coupling to the vendor’s quality product than some teams want
Best for: Teams already using Code Climate for code health who want delivery metrics from the same data and the same vendor.
Pricing: Per-developer subscription, commonly bundled or negotiated alongside the quality product.
Pluralsight Flow
Flow, originally GitPrime, is the oldest product in this category and the one that defined its reputation, for better and for worse. It analyses version control history in depth, producing detailed per-developer and per-team activity measures, and it now sits inside Pluralsight’s skills and development portfolio. If you are evaluating it, understand that its historical centre of gravity is individual contributor analysis, and that this is exactly the capability that generates the pushback described earlier.
Pros
- Deep version control analysis, including rework and churn measures with a long history behind them
- Mature product with substantial documentation and an established enterprise footprint
- Sits within a larger learning and skills platform, which suits organisations already invested there
- Works from git history alone, so it produces output without tracker hygiene
Cons
- Individual contributor metrics are a headline capability, and that framing is the fastest way to lose your team’s trust
- Churn and rework measures are widely misread as individual performance signals when they are usually requirements signals
- Being part of a large skills portfolio means product direction follows a suite strategy rather than an engineering analytics one
- Enterprise pricing and procurement, with the resulting implementation timeline
Best for: Enterprises already standardised on Pluralsight that want deep version control analysis and have a firm governance policy in place.
Pricing: Enterprise contracts scaled by seats, typically negotiated as part of a wider platform agreement.
How to choose
Answer one question first: who asked for this, and what will they do with it. Everything follows from that.
If a finance or board audience asked where the money goes, you need allocation and capitalisation reporting. Jellyfish, or Swarmia at team scale. Fix your tracker labelling before you buy anything, or you will be presenting fiction.
If delivery genuinely feels slow and you want to fix it, you need stage-level cycle time, especially pickup time. LinearB if you want intervention, Haystack if you want measurement, Swarmia if you want the team to own it.
If the metrics look fine and the team says otherwise, you need perceptual data. DX, or a recurring internal survey you write yourself, which is a legitimate answer.
If your delivery problem is actually a code problem, look at Code Climate Velocity for the adjacency, and read code quality and technical debt tools before concluding that.
If you need deep version control history analysis at enterprise scale, Flow, with the governance policy written down first.
If you have one team, one forge and one pipeline, consider not buying anything. Two tables from your forge and deploy pipeline produce the throughput metrics, as described in the DORA tooling guide.
| Platform | Strongest capability | Tracker hygiene required | Individual-metric exposure |
|---|---|---|---|
| SPACE (standard, not a product) | Measurement discipline | None | None by design |
| LinearB | PR workflow plus automation | Medium | High |
| Swarmia | Team ownership and investment | High | Deliberately low |
| Jellyfish | Business allocation and capitalisation | Very high | Roll-up oriented |
| Haystack | Delivery flow, quick start | Low | Medium |
| DX | Developer experience research | None | Aggregated only |
| Code Climate Velocity | Metrics next to code health | Low | High |
| Pluralsight Flow | Deep version control analysis | None | Highest |
Run any pilot on real repositories with real messy history, never on a demo dataset, and check the first surprising number by hand before you circulate it. The credibility of the whole programme rests on the first chart somebody disagrees with, and if you cannot explain how it was computed you will not get a second chance. For the wider developer tooling picture, the hub at AI coding assistants covers the adjacent question of what to measure when assistant adoption changes how code gets written.
Frequently asked questions
What is the difference between a DORA tool and an engineering analytics platform?
The four delivery metrics are a small subset of what these platforms compute, and every one of them includes them. An analytics platform adds allocation reporting, capacity modelling, survey data, cost attribution and often individual-level views. If all you want is the four metrics, a narrow tool or a homegrown dashboard over your own CI data is cheaper and you will understand the definitions better.
Do engineering analytics platforms actually improve delivery?
They can identify where changes get stuck, which is a real contribution, and pickup time in particular responds quickly to a fix once someone can see it. What they do not do is generate the will to change anything. A dashboard nobody acts on is a subscription. The teams that get value treat one metric as a question, change one thing in the process, and check whether it moved.
Should individual developer metrics ever be used?
Only by the individual themselves, if they want them. Every individual-level metric available here is a volume proxy that rewards splitting work and penalises the force-multiplier activities senior engineers are paid for. Used by a manager, they change behaviour immediately and change candour permanently. Set the policy in writing before the tool is installed.
How accurate is investment and allocation reporting?
Exactly as accurate as your issue labelling, which in most organisations means directionally useful and precisely wrong. The chart carries no indication of that, which is the hazard, because it will be presented to an audience with no way to evaluate it. Sample your own tracker first: if most completed issues lack a type a machine could map to a category, fix labelling before buying reporting built on it.
Can we just build this ourselves?
The throughput half, yes. Deploy frequency, lead time and PR stage timings all come from your forge and deploy pipeline with a join, and the definitions being yours is a genuine advantage. What you cannot easily build is survey instrumentation with a decent question set, cross-organisation benchmarking, and a system somebody else keeps running after its author changes teams. That last one is the honest argument for buying.
Related reading
- Best engineering metrics and DORA tools — the four delivery metrics in detail, including how each is actually calculated.
- Best AI coding assistants — the hub, and the measurement traps around assistant adoption.
- Best code quality tools — whether the debt score on your dashboard correlates with anything real.
- Best developer onboarding tools — time to first commit, the one onboarding metric these platforms measure well.
- Best internal developer platforms — the investment these reports are most often used to justify or defend.
- Best CI/CD platforms — the deployment data source that decides whether your lead time reaches production.