Every tool in this category will, within about ten minutes of pointing it at your repository, tell you that you have some number of days of technical debt. It will be a large number. It will be presented with a letter grade and a colour.
The number is a sum of per-rule remediation constants. Each rule in the analyser has an estimate attached, fifteen minutes for this, two hours for that, and the tool adds up every violation it found. That is the entire mechanism. It knows nothing about your architecture, which parts of the codebase anyone touches, or whether the file with four hundred violations has been stable for three years and will never be opened again.
So the question worth asking before you buy anything here is whether that score correlates with anything you care about. Defects, incidents, the time it takes to make a change, onboarding difficulty, anything. Mostly it does not, at least not in the form vendors present it. But some things in this category correlate very well, and knowing which is the difference between a tool your team uses and a dashboard everyone learns to ignore by the second sprint.
The second thing that separates working deployments from failed ones has nothing to do with the analyser. It is how you introduce it to a codebase that already has a decade of history in it. Turn everything on at once and you get forty thousand findings, nobody triages them, and within a month the build is either permanently red or the gate is permanently disabled. The pattern that works is a ratchet, and it is worth more than any feature comparison.
Key takeaways
- The debt score is a sum of per-rule time constants. It has no knowledge of what your team actually touches, so treat it as a rule-violation count and never as a schedule estimate.
- What does correlate with pain is change frequency crossed with complexity. A complicated file nobody edits is not a problem; a complicated file edited weekly is where your incidents come from.
- Gate on the diff, not on the repository. New and changed code must meet the standard; existing code is grandfathered until someone touches it.
- On a large existing codebase, use a ratchet: record a baseline, block anything that makes a metric worse, and let the threshold only ever tighten. This is the difference between adoption and abandonment.
Does the technical debt score correlate with anything real
Let us be specific about what these numbers are made of, because the vendors are not.
The debt ratio. Remediation effort divided by an estimate of the cost to build the codebase from scratch, where the build estimate is typically lines of code multiplied by a constant. Both sides are synthetic. A codebase that is verbose in a language with low information density scores better than a dense one that does the same work, because the denominator got bigger. You can improve your rating by writing more code.
Cyclomatic complexity. The number of independent paths through a function, computed by counting branches. It is a real measure of testing burden, since it sets a floor on the number of test cases needed for branch coverage. It is a poor measure of how hard a function is to understand: a flat switch statement with thirty cases scores far worse than a three-level nested conditional with an inverted boolean, and anyone who has read both knows which one ruins an afternoon.
Cognitive complexity. A later metric designed to fix exactly that, by penalising nesting and rewarding flat structures. It is meaningfully better than cyclomatic complexity for the purpose it claims, and it is still a proxy.
Duplication. Detected by token-sequence matching. Reliable at what it measures, and what it measures is not always bad. Two similar handlers for two things that will diverge are correctly duplicated, and the tool cannot tell that from copy-paste laziness.
Maintainability indices and letter grades. Composites of the above, weighted by choices the vendor made and generally does not publish. Two tools will grade the same file differently, and neither can explain the gap in terms you can check.
So what does relate to real pain?
Change frequency crossed with complexity. This is the most useful idea in the whole category. A complicated file that nobody has touched in two years costs you nothing. A complicated file that appears in a third of your pull requests is where merge conflicts, regressions and onboarding failures come from, and it is where refactoring effort pays back. Ranking by complexity alone points you at dead code. Ranking by complexity times recent churn points you at your actual problem. This is the thesis behind behavioural code analysis, and it is the single most defensible signal here.
Change coupling. Files that keep being modified together despite having no explicit dependency. That pattern usually means an abstraction is missing or a boundary is wrong, and it is invisible to any analyser that reads one file at a time.
Defect density by module, from your own history. If you can join your bug tickets to the files that were changed to fix them, you have a ranking based on evidence from your own system rather than on a vendor’s rule weights. Very few teams do this, and it takes an afternoon of scripting.
Test coverage on changed lines. Not overall coverage, which is a number teams optimise directly and which tells you almost nothing above a certain threshold. Coverage on the lines in this pull request is actionable, specific, and hard to game in a way that does not also happen to be useful.
The findings that are not style at all. A SQL string built by concatenation, a request without a timeout, an unhandled promise rejection, a resource opened and never closed. These are defects, not debt, and they belong in a different mental bucket entirely. They overlap with what SAST tooling looks for, and the overlap is where the highest-value findings in this category live.
Needs first-hand data: Take your last six months of bug fixes, extract the files each fix touched, and rank files by how often they appear. Then compare that ranking against your tool’s list of highest-debt files. If the two lists barely overlap, the debt score is not describing your problem, and you should be ranking by churn instead. This takes about an hour of git log scripting and it will change what you do with the tool.
Quality gates in CI: gate the diff, not the repository
A quality gate is a check that fails the build when code does not meet a standard. Whether it helps or gets disabled comes down to a handful of configuration decisions.
Gate on new and changed code only. This is the single most important setting in any of these products, and most of them support it under some name. The condition becomes: code introduced or modified in this pull request must have no new critical findings, must not increase duplication, and must meet a coverage threshold on the changed lines. Existing code is untouched by the gate until somebody edits it, at which point it gets cleaned up by the person who is already in there with the context to do it safely.
The alternative, gating on the whole repository, is what produces the permanently red build. On any codebase with history, the first run fails and there is no path to green that fits in a sprint, so the gate gets marked advisory and stops meaning anything.
Fail on a short list, warn on the rest. Blocking findings should be things nobody would defend in review: injection patterns, hardcoded credentials, resource leaks, obviously unreachable code. Style opinions, complexity thresholds and duplication warnings should be visible in the PR without blocking merge, at least at first. Every false block spends credibility, and you only have so much of it before someone adds a skip flag to the pipeline.
Put findings in the pull request, not in a portal. A comment on the changed line, at review time, gets fixed. A dashboard someone has to remember to open does not. This is a genuine differentiator between products and the thing to test hardest in a trial.
Decide the suppression mechanism up front. People will need to suppress findings, and if the only available route is disabling the rule globally, that is what will happen. An inline comment suppression that requires a justification string, reviewable in the diff, is the right shape. Then read the suppressions quarterly, because the pattern in them tells you which rules are wrong.
Keep the analysis fast enough to run on every PR. If full analysis takes twenty minutes, run incremental analysis on the diff for the gate and the full scan nightly. A gate that makes every PR slower will be resented in proportion to how slow it is, regardless of what it catches.
Do not gate on total coverage percentage. It is the most reliably gamed number in software. Teams write assertion-free tests that execute code without checking anything, and the number goes up while the safety net stays absent. Coverage on changed lines is much harder to satisfy without writing a real test.
The ratchet: adopting this on a codebase with ten years of history
This is the pattern, and it is the reason some rollouts work and most do not.
Step one: baseline, do not fix. Run the full analysis and record the current numbers as the reference point. Do not create tickets for the backlog. Do not schedule a cleanup sprint. Forty thousand findings is not a backlog, it is a fact about the codebase, and treating it as work to be scheduled is how the initiative dies in the first planning meeting.
Most tools support this directly, either as a baseline file committed to the repository or as a new-code period setting. Both work. The committed file has the advantage of being visible and diffable.
Step two: the ratchet rule. The build fails if any tracked metric gets worse than the baseline. Not if it is bad, only if it worsens. New code must be clean, but nobody is required to fix anything they did not touch.
The ratchet’s essential property is that the threshold only moves in one direction. When the number improves because someone cleaned up a module in passing, the baseline is updated to the new value and cannot go back. Improvements are locked in automatically, which means the cleanup that happens organically during feature work is no longer quietly undone three months later.
Step three: let the boy scout rule do the work. Over a year, people touch the files that matter, because the files that matter are the ones that get touched. The rest stays exactly as it is, which is correct, because a file nobody opens is costing you nothing. This is why churn-weighted ranking matters: it is a prediction of which parts of the codebase the ratchet will clean up on its own.
Step four: one deliberate campaign, chosen from evidence. Once the ratchet is running, pick a single high-churn, high-complexity area from the top of the list and fund real work on it with a clear finish line. One. Not a quarter of cleanup. The evidence that it was the right one is that pull requests touching it get faster or that its bug count drops, and that is the argument that funds the next one.
Two failure modes to name explicitly. The first is the cleanup sprint, which converts the backlog into a large risky change set with no feature value, gets cut when something urgent arrives, and leaves everyone believing quality work never lands. The second is the exemption that never expires: a directory excluded from analysis during rollout because it was too noisy, still excluded four years later, now containing the payment code.
Needs first-hand data: After three months of running a diff-scoped gate, count how many times the gate was bypassed and record the reason each time. If bypasses are frequent, your blocking rule set is too broad and is costing you credibility on every pull request. Shrink it to the rules nobody argued about and re-measure.
SonarQube

SonarQube is the category incumbent and the widest in language coverage, available as self-hosted server editions and as a hosted service. Its clean-as-you-code model is the best-articulated version of the diff-scoped gate described above, with the new-code period as a first-class concept rather than a configuration trick. It reports bugs, vulnerabilities, code smells and duplication with a quality gate that plugs into the pipeline and the pull request.
Pros
- Broadest language coverage in the category, which matters in a polyglot codebase where per-language tools mean per-language setup
- New-code period is a core product concept, making the ratchet pattern straightforward rather than something you assemble
- Self-hosted option keeps source code inside your own network, which removes a whole procurement conversation in regulated environments
- Quality gate definitions are explicit and versionable rather than a hidden vendor score
Cons
- Default rule sets are noisy, and the first run on a legacy codebase produces a number that scares stakeholders into bad decisions
- The debt-in-days figure is prominent and invites exactly the misreading this article warns about
- Self-hosting is a real service to run and upgrade, with a database and its own scaling characteristics
- Capability is split across editions, and branch analysis and some languages sit above the free tier
Best for: Polyglot teams that want one analyser across every language, particularly where self-hosting is a requirement.
Pricing: Free community edition self-hosted, with paid editions by lines of code for additional languages, branch analysis and enterprise features; the hosted service is subscription-based by analysed lines.
Code Climate
Code Climate is a hosted quality platform that wraps a set of open-source analysis engines behind a common interface, adds maintainability grading and test coverage tracking, and reports into pull requests. Its historical strength is the review experience: findings land as PR comments with a clear diff-scoped view, which is where they actually get fixed. The letter grades are the part to treat sceptically.
Pros
- Strong pull request integration, so findings appear where review already happens
- Diff-scoped reporting is the default framing rather than an option to discover
- Engine-based architecture allows adding open-source analysers, including your own
- Coverage tracking integrated with quality findings in one view
Cons
- Letter grades compress several judgment calls into one opaque symbol that teams over-interpret
- Hosted analysis means source code leaves your network, which some security reviews will not accept
- Less depth per language than the language-native specialists for anything beyond the common set
- The vendor’s product emphasis has shifted over time, so confirm current direction before a long commitment
Best for: Teams on hosted forges who want quality findings in pull requests with minimal infrastructure to run.
Pricing: Per-seat subscription for private repositories, with free analysis for open-source projects.
Codacy
Codacy aggregates many open-source linters and analysers into one hosted service with unified configuration, pull request annotation, coverage tracking and a security-oriented rule layer. The proposition is breadth without operating a dozen tools yourself: one place to configure which rules apply, one gate, one report, across every language in the repository.
Pros
- Wide language and linter coverage assembled into a single configuration surface
- Pull request annotations on changed lines, with diff-scoped gating supported directly
- Security-focused rules and dependency findings alongside quality rules in one place
- Self-hosted deployment available for teams that cannot send source code out
Cons
- Aggregating many upstream linters means inconsistent finding quality and inconsistent message style between languages
- Default configuration is noisy and needs deliberate pruning before anyone will trust the gate
- Deduplication across overlapping analysers is imperfect, so the same issue can appear more than once
- Less analytical depth than the tools with their own analysis engine
Best for: Polyglot teams that want one hosted gate over many existing linters without running the linters themselves.
Pricing: Per-seat subscription with tiers, with a self-hosted enterprise option and free analysis for open-source projects.
Qodana
Qodana is JetBrains’ static analysis product, and its distinguishing property is that it runs the same inspections as the JetBrains IDEs. That means the findings in CI are the findings developers already see in their editor, with the same names and the same quick-fixes. For a team standardised on those IDEs, that alignment removes the most tedious objection to any quality gate: that CI complains about things the editor never mentioned.
Pros
- CI findings match IDE inspections exactly, so nothing in the gate is a surprise at review time
- Quick-fixes available in the editor for a large share of findings, which shortens the path from report to fix
- Strong depth in the JVM and .NET ecosystems where JetBrains analysis has always been good
- Baseline support for legacy codebases, so the ratchet pattern is directly supported
Cons
- Value is much lower if your team does not use JetBrains IDEs, which is the entire premise
- Licensing is tied to the JetBrains ecosystem and its per-language product structure
- Narrower language and framework breadth than the aggregator platforms outside its strong areas
- Another CI container to run and keep current
Best for: Teams standardised on JetBrains IDEs who want the editor and the pipeline to agree about what a problem is.
Pricing: Subscription tied to the JetBrains licensing model, by contributor and by linter, with a free tier for smaller usage.
CodeScene
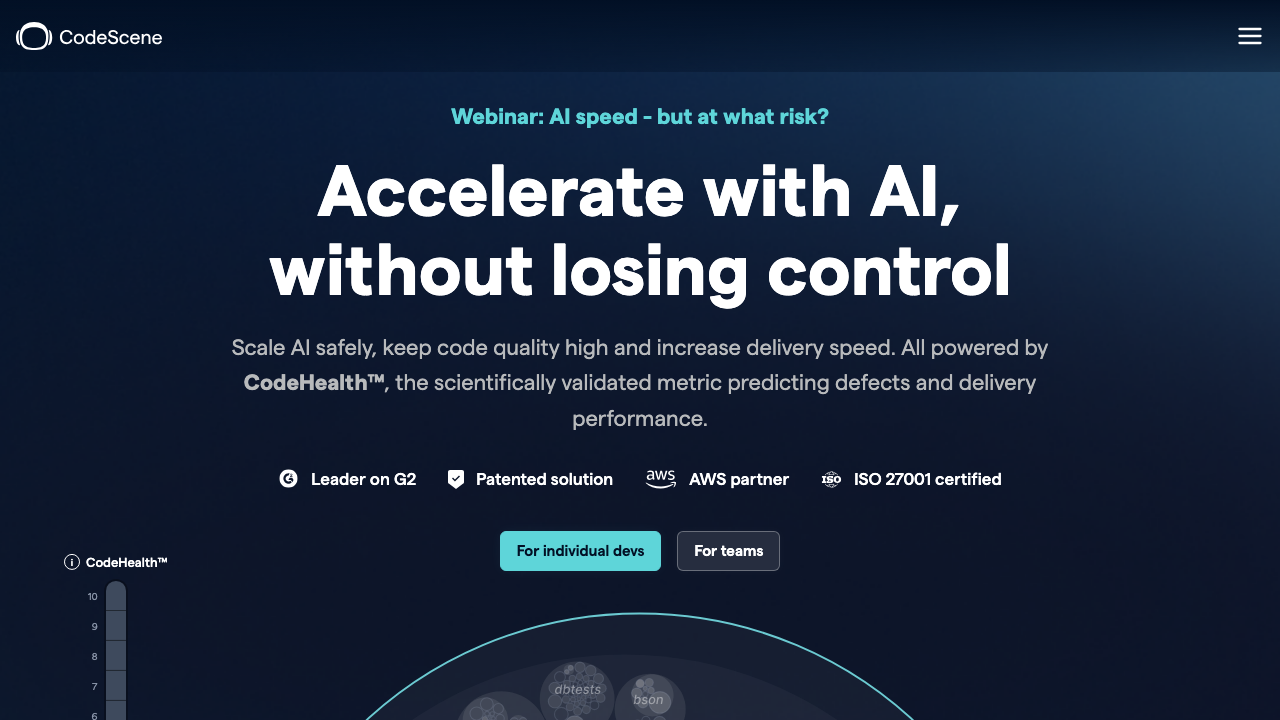
CodeScene analyses version control history as well as code, which makes it the product built around the one signal in this category that clearly correlates with pain. It identifies hotspots by crossing complexity with change frequency, finds change coupling between files that keep being modified together, and surfaces knowledge distribution across the team. It answers “where should we actually spend refactoring effort” rather than “how many rule violations exist”.
Pros
- Hotspot analysis ranks by churn and complexity together, which points at code that actually costs you money
- Change coupling detection finds missing abstractions that no single-file analyser can see
- Uses your own repository history as evidence rather than vendor rule weights, so the output is grounded in your system
- Produces the strongest available argument for funding a specific refactoring project
Cons
- Knowledge distribution and author-level views edge toward individual measurement, and need a governance policy before rollout
- Needs meaningful repository history, so it says little about a young codebase
- Large repository rewrites, migrations and formatting commits distort the history signal unless excluded
- Different enough from a conventional linter that teams expecting rule violations are initially confused about what to do with it
Best for: Teams with an established codebase who need to decide where refactoring effort goes, backed by evidence rather than opinion.
Pricing: Subscription by repository and contributor, with cloud and self-hosted deployment options.
Semgrep
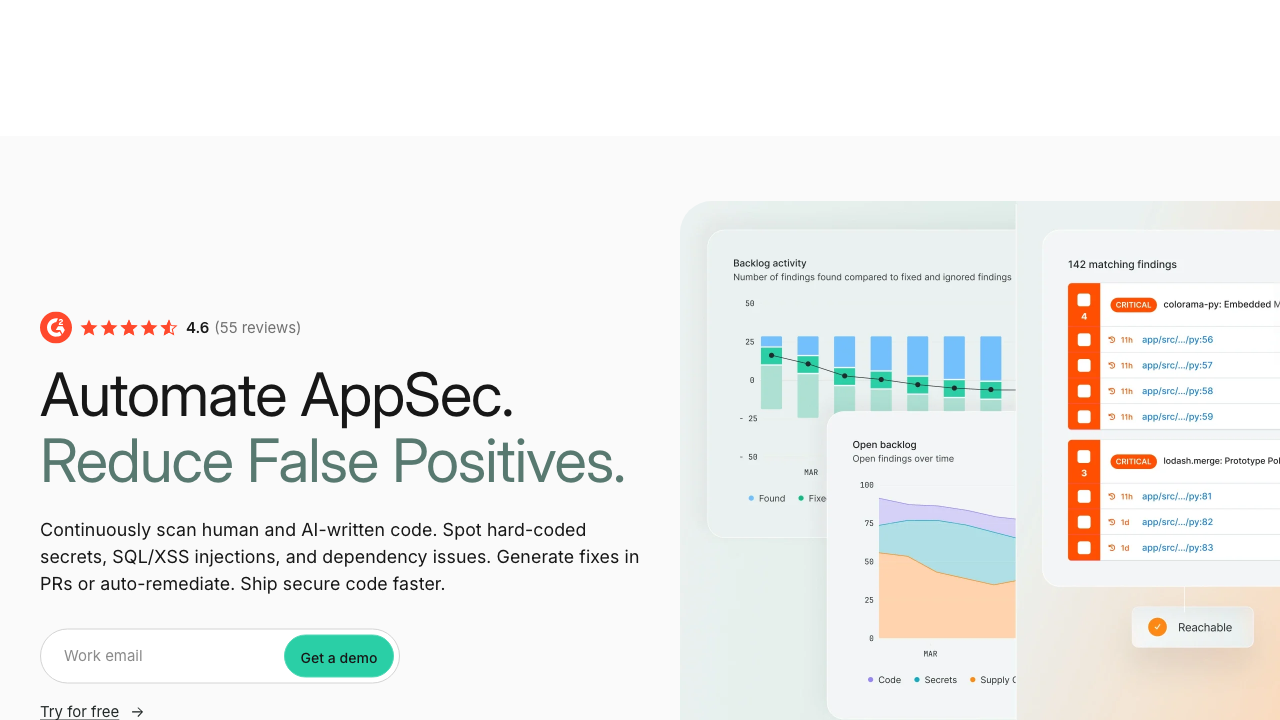
Semgrep matches patterns against code structure using rules that look like the code they match, which makes writing a custom rule something a normal engineer can do in an afternoon rather than a specialist exercise in AST manipulation. It is best known as a security scanner, and it is equally effective as an enforcement tool for your own conventions: the internal HTTP client that must always be used, the deprecated function nobody should call again, the pattern you keep catching in review.
Pros
- Custom rules are genuinely writable by the team that needs them, which is rare and valuable
- Codifies architectural conventions that no off-the-shelf analyser will ever know about
- Fast enough to run on the diff in every pull request without slowing review
- Open-source engine with a community rule registry, so there is a free path that works
Cons
- Not a maintainability or complexity product, so it will not give you the dashboard an executive asked for
- Value scales with rules you write, which means somebody has to own the rule set
- Pattern matching within a file is the sweet spot; cross-file and deep dataflow reasoning is where the paid tiers come in
- Overlaps with your security scanning, so rule ownership between teams needs settling
Best for: Teams who keep catching the same architectural mistake in review and want it caught automatically instead.
Pricing: Open-source engine with no cost, plus a hosted platform with per-contributor subscription for managed rules, findings management and cross-file analysis.
ESLint
ESLint is the free foundation, and everything above it is worth less than getting this right first. It is the JavaScript and TypeScript linter, configured per project, running locally and in CI with no service, no account and no data leaving your machine. The same argument applies to every language’s native equivalent: Ruff for Python, go vet and staticcheck for Go, Clippy for Rust, RuboCop for Ruby, detekt and ktlint for Kotlin, SwiftLint for Swift. These catch a large share of what the paid platforms report, at zero cost, with no procurement and no latency.
Pair the linter with a formatter run on commit and the entire category of style disagreement disappears from code review, which is a bigger productivity win than most of the paid features here. Do this before buying anything.
Pros
- No vendor, no account, no source code leaving your infrastructure, and no procurement conversation
- Runs in the editor as you type, which is the shortest possible feedback loop and where fixes are cheapest
- Rule sets are code in your repository, reviewed and versioned like anything else
- Ecosystem plugins cover framework-specific rules that generic analysers do not know about
Cons
- Per-language, so a polyglot codebase means several configurations, several CI steps and several upgrade paths to maintain
- No cross-file or architectural analysis, and no history-aware signal at all
- Config drift between repositories is a real maintenance burden without a shared internal preset
- Produces no dashboard or trend reporting, which is a genuine gap if someone above you wants one
Best for: Every team, as the baseline layer, before evaluating whether a platform adds anything on top.
Pricing: No vendor and no bill. ESLint and the language-native linters are open source and free, with the only cost being CI time and the maintenance of your own configuration.
How to choose
Decide what problem you have first, because the products are answers to different ones.
If you have no linting at all, stop reading and set up the language-native linter plus a formatter, run both in CI, and gate on the diff. That is most of the available value and it costs nothing. Come back in three months.
If you have linting and want one gate across many languages, SonarQube if you need self-hosting or the widest language coverage, Codacy if you want a hosted aggregator over tools you already use.
If findings are not getting fixed, the problem is delivery, not analysis. Choose on pull request integration quality: Code Climate and Codacy are strong here, and test it on real PRs during the trial.
If you need to decide where to spend refactoring budget, CodeScene, or spend an hour building the churn ranking yourself from git log. Either beats a debt score.
If you keep catching the same mistake in review, Semgrep, and write the rule the day you find the third instance.
If your team lives in JetBrains IDEs, Qodana, for the simple reason that the pipeline and the editor agreeing removes the most common objection to gating.
| Tool | Core signal | Gates on the diff | Source code stays internal |
|---|---|---|---|
| SonarQube | Rule violations plus debt model | Yes, new-code period | Yes, self-hosted editions |
| Code Climate | Maintainability plus coverage | Yes | No, hosted analysis |
| Codacy | Aggregated linter findings | Yes | Yes, with self-hosted option |
| Qodana | IDE inspections in CI | Yes, with baseline | Yes, runs in your pipeline |
| CodeScene | Churn crossed with complexity | Partial, advisory by nature | Yes, with self-hosted option |
| Semgrep | Custom pattern rules | Yes | Yes, open-source engine |
| ESLint | Language-native rules | Yes | Yes, fully local |
Whatever you choose, the first configuration decision matters more than the choice: baseline the existing code, gate only the diff, block on a short list, and let the ratchet do the rest. For how this connects to delivery measurement, engineering analytics platforms covers the adjacent dashboards, and the hub at AI coding assistants covers the newer question of what happens to review load when a larger share of code arrives generated.
Frequently asked questions
Is the technical debt score in these tools accurate?
It is arithmetically consistent and practically meaningless as a time estimate. The figure is the sum of fixed remediation constants attached to each rule, with no knowledge of your architecture, your team, or which files anyone actually opens. Read it as a rule-violation count with a unit bolted on. If you need a number that predicts pain, rank files by change frequency crossed with complexity instead, or build a defect-density ranking from your own bug history.
Should quality gates block merges?
Yes, but on a short list of findings nobody would defend, and scoped to the code changed in that pull request. Blocking on style opinions or complexity thresholds burns credibility fast, and a gate people route around is worse than no gate because it looks like coverage while providing none. Start with injection patterns, credentials, resource leaks and coverage on changed lines; expand only after the narrow set has run clean for a while.
How do we introduce a quality tool to a large legacy codebase?
Baseline everything as it is, gate only new and changed code, and make the baseline a ratchet that can tighten but never loosen. Do not create a cleanup backlog from the first scan and do not schedule a cleanup sprint. Over a year the files people actually touch get cleaned by the people touching them, and the files nobody opens stay as they are, which is the correct outcome because they are not costing you anything.
Do we still need a linter if we have a quality platform?
Yes, and the linter matters more. Editor-time feedback is the shortest loop in software, and a fix while you are typing costs a fraction of a fix at review. The platform adds trend reporting, cross-repository views and analysis the linter cannot do. It does not replace the layer that catches problems before the code is even committed.
Does code quality tooling reduce bugs?
The findings that are genuinely defects, unhandled errors, missing timeouts, injection patterns, resource leaks, do prevent real incidents. The style and complexity findings mostly reduce review friction and make code easier to change, which is worth having but is a different claim. Measure it yourself: track whether files that pass through the gate show a lower subsequent bug rate than files that predate it. Nobody can tell you that number for your codebase.
Related reading
- Best SAST tools — the security-focused half of static analysis, where the highest-value findings overlap with quality.
- Best AI coding assistants — the hub, and what changes when more code arrives generated than typed.
- Best AI code review tools — the review layer that sits alongside these gates in the pull request.
- Best engineering analytics platforms — where quality data ends up when someone above you wants a trend line.
- Best CI/CD platforms — where the gate runs, and whether incremental analysis is fast enough to run on every PR.
- Best engineering metrics and DORA tools — the delivery side of measurement, and the same correlation questions.