Someone above you has asked for engineering metrics. Maybe a board deck needs a slide, maybe a new VP wants a baseline, maybe you genuinely want to know whether the last two quarters of platform work made delivery faster. Whatever the reason, you are now shopping for a dashboard, and every vendor in this category will show you the same four numbers in the same four tiles.
The four numbers come from a research programme, not from any of those vendors. That matters, because the research measured something specific under specific definitions, and what a tool puts in the tile depends entirely on which events it can see in your systems and which assumptions it makes about them. Two tools pointed at the same repository will disagree about your lead time, and both will be defensible. Neither will tell you that on the tile.
The second thing to be clear about before buying: these metrics were designed to describe a delivery system, not the people inside it. The moment they are computed per developer and shown to a manager, the product changes from a diagnostic into a performance surveillance tool, and the behaviour it produces changes with it. Most articles in this category skip that. It is the part most likely to determine whether the rollout works.
I have watched this go both ways. Used as a conversation starter about where changes get stuck, the four metrics are among the most useful things an engineering organisation can put on a wall. Used as a target handed down with a number attached, they produce exactly the behaviour you would predict and none of the delivery improvement you wanted.
Key takeaways
- The four metrics come from a research programme. They are a framework with published definitions, not a product, and no vendor owns them.
- Every tool guesses. Deploy frequency depends on what counts as a deployment, lead time depends on which event starts the clock, and change failure rate depends on a proxy for failure that is wrong in a different direction for every team.
- Deploy frequency and lead time change behaviour when they improve, because the only ways to improve them are smaller batches and faster review. Change failure rate and recovery time are mostly classification policy and get gamed first.
- Individual-level metrics are a different product with a different effect on your team. Decide that policy before you pick a vendor, and write it down.
DORA metrics: a research framework, not a product
DORA stands for DevOps Research and Assessment, the research programme that produced the four delivery metrics everyone now quotes. The work surveyed software delivery organisations over several years and looked for capabilities that correlated with both delivery performance and organisational outcomes. The four metrics are the output of that work, not the input, and they were chosen because they were measurable through survey questions across wildly different companies.
The four, with the definitions the research actually used:
Deployment frequency. How often the organisation successfully releases to production. Note “to production” and note “successfully”. A pipeline run is not a deployment. A release to a staging environment is not a deployment.
Lead time for changes. The time from code committed to code running successfully in production. The clock starts at a commit, not at a ticket, not at a design doc, not at a PR being opened.
Change failure rate. The share of deployments to production that cause a degraded service and require remediation, whether that is a rollback, a fix forward, or a patch. It is a ratio over deployments, not over time.
Failed deployment recovery time. How long it takes to restore service when a deployment causes a failure. Earlier phrasings of this metric talked about restoring service after any incident, which is a broader and less useful question, and the narrowing to deployment-caused failures is the version worth measuring.
Two of these describe throughput and two describe stability. The central finding of the research is that those two pairs are not in tension in the way engineering folklore assumes: organisations that deploy more often also tend to break things less often, because the capabilities that produce one produce the other. Small batches are easier to review, easier to test, and easier to reverse.
What it gives you
- A vocabulary that means roughly the same thing across companies, so a conversation with another engineering leader about delivery does not start with forty minutes of definitions
- A framing that points at the delivery system rather than at people, which is where the fixable problems usually are
- Two throughput metrics and two stability metrics that constrain each other, so improving one by wrecking the other shows up immediately
- A defensible answer when someone asks whether the platform investment worked, provided you baselined before you started
What it does not do
- It does not measure output, value, or whether you built the right thing. A team shipping the wrong feature quickly scores well
- It says nothing about the work before the first commit, which in most organisations is where the majority of elapsed time lives
- It does not transfer cleanly to every context. Mobile apps gated by app review, firmware, regulated deployments and data pipelines all break at least one definition
- It does not come with your thresholds. The published performance bands describe a survey population, not your service, and treating a band as a target is how the framework gets misused
That last point deserves emphasis because it is the most common failure. The research groups respondents into performance bands. Those bands are descriptive statistics about a survey sample. They are not a certification, they are not a maturity model, and a team that moves between them because someone changed a deployment definition has not improved anything.
Counting the four metrics correctly
This is the part vendors do not put on the tile, and it is where all the disagreement between tools comes from.
Deployment frequency: what counts as one deployment?
The candidates a tool can see are pipeline runs, successful pipeline runs, merges to the main branch, GitHub deployment events, release tags, and whatever your deploy tool emits. These produce numbers that differ by multiples.
Decide four things explicitly. First, production only, since counting staging deploys inflates the number without meaning. Second, per service or per organisation, because an organisation-level count rewards having many services and tells you nothing about any of them. Third, whether a failed deploy counts, since the definition says successfully released. Fourth, what happens when one pipeline run deploys eleven services at once, which is one event or eleven depending on a choice nobody wrote down.
Then look at the distribution rather than the average. An organisation with thirty services where four deploy constantly and twenty-six deploy monthly has a healthy-looking average and a real problem. The median service is the number that tells you something.
Lead time: which event starts the clock?
The research definition starts at commit. Almost every tool starts somewhere else, for good reasons.
First-commit timestamps are unreliable because rebasing, squashing and amending all rewrite them, so a branch that took three weeks can arrive with a commit timestamp from ten minutes ago. Many tools therefore use PR creation, or first commit on the branch as recorded by the forge rather than by git, or merge time.
Merge-to-production is the cleanest signal available and the least interesting, because it measures your pipeline rather than your process. Commit-to-production includes review, which is where most teams actually lose days. PR-open-to-production is the compromise most tools default to, and it is quietly gameable: open the PR later and the number improves.
The honest way to use lead time is to break it into stages and look at the stages rather than the total. Coding time, pickup time from PR ready to first review, review time from first review to approval, and deploy time from merge to production. Pickup time is usually the biggest single stage and the easiest one to fix, and it disappears entirely inside a single total.
And note what none of this covers: the time from a decision being made to the first commit existing. In most organisations that dwarfs everything downstream. DORA lead time is not cycle time from idea to production, and presenting it as such to an executive audience will get you asked why delivery still feels slow when the dashboard is green.
Change failure rate: every proxy is biased.
No system emits an event saying “this deployment broke production”. Tools infer it, and each inference method is wrong in a specific direction.
Rollback or revert detection is the most common. It undercounts badly for teams that fix forward, which is most teams with feature flags, and it overcounts for teams that use reverts as a routine, low-drama tool.
Incident linking attributes an incident to the deploy that preceded it in the same service. This inherits every classification problem incident data has. A team that declares incidents freely looks worse than a team that only declares customer-visible outages, and the second team is usually the one with the problem. The same distortion undermines MTTR, which is discussed in more depth in postmortem and retrospective practice.
Hotfix detection keys off branch naming or commit message conventions and measures your naming discipline.
Manual tagging is the most accurate and the least likely to survive contact with a busy team beyond the first month.
Pick one, write down which, and never compare the resulting number to another organisation’s.
Recovery time: the same clock problem as MTTR.
When does the failure start, when is it detected, and when is service restored? Each boundary is a policy choice, and moving any of them changes the number without changing the system. Track it as a distribution within a severity class, not as a mean, because one bad night distorts a quarter.
Needs first-hand data: Take the last ninety days and calculate deploy frequency and lead time twice, once counting every successful production pipeline run and starting the clock at PR creation, and once counting release events and starting at first commit on the branch. Record both numbers side by side. The gap between them is the size of the definitional uncertainty in anything a vendor shows you, and knowing it is the difference between using the dashboard and believing it.
The surveillance problem, stated plainly
Every tool in this category can compute per-developer numbers. Most of them do, some of them lead with it, and the ones that do not will still let you filter a team view down to one person.
Here is the mechanism, without hedging. When a metric becomes an input to how someone is evaluated, people optimise for the metric. That is not cynicism about engineers, it is how incentives work everywhere, and the specific optimisations available here are all bad for you.
PR count goes up by splitting work into smaller PRs that do not correspond to anything. Review throughput goes up by approving faster and reading less, which is a direct trade against the change failure rate on the other tile. Commit counts go up trivially. Lines of code needs no explanation. And the work that does not register at all becomes invisible: pairing, mentoring, the afternoon spent reading an unfamiliar subsystem before touching it, the incident debugging that produced a three-line fix, the design conversation that stopped a bad project.
The people most damaged by individual dashboards tend to be the senior engineers whose value comes mostly from multiplying other people. That is a bad group to accidentally penalise.
There is a second cost that is harder to reverse than any metric. Once a team believes their editor activity is being reported upward, the working relationship changes, and it does not change back when you turn the feature off. Anything that reads local IDE activity rather than forge events should be held to a much higher standard of justification for exactly this reason.
The policy that works is narrow and should be written down before the tool is installed:
- Aggregate at team level and above. Never surface individual contributor metrics to anyone outside the team
- The team sees its own data first, and sees it before anyone above them does
- Nothing from this tool enters a performance review, a promotion packet, or a stack ranking, and say so explicitly rather than implying it
- Metrics open conversations, they do not close them. The number is the question, not the answer
- Publish the definitions internally, including which proxy you chose for change failure rate, so people can argue with the measurement instead of resenting it
If you cannot get agreement on that policy from the person who asked for the dashboard, that is worth knowing before you spend the budget, because the tool will be used the way that person intends regardless of what you configure.
Needs first-hand data: Before rolling out any tool here, ask your team directly whether they expect this data to be used in reviews, and record the answers anonymously. If the expectation is already that it will be, the metrics will be gamed from day one and the dashboard will measure the gaming. That answer is worth more than any vendor evaluation.
Which metrics change behaviour and which just get gamed
Not all four are equally useful as something to improve deliberately.
Deploy frequency and lead time respond to real fixes. The available routes to improving them are smaller changes, faster review, trunk-based development, better test reliability, and a pipeline that does not take forty minutes. Every one of those is a genuine improvement to the delivery system. They can be gamed, by splitting deploys artificially or opening PRs late, but the gaming is visible to anyone who looks at the underlying events, and the honest path is usually easier than the dishonest one.
Pickup time in particular is the metric I would put on a wall if I could only pick one. It is unambiguous, it is nobody’s fault individually, it responds immediately to a review rotation or a WIP limit, and shortening it improves everything downstream of it.
Change failure rate and recovery time mostly measure classification. Both depend on a human decision about whether something counts as a failure and when it stopped. Both improve instantly if you declare fewer incidents, which is the opposite of what you want. Use them as guardrails rather than targets: watch for change failure rate rising while deploy frequency rises, because that is the signal that speed is coming from skipped verification. Do not set a goal for either.
A general rule that applies to all four: the moment a single metric gets a target attached, it stops describing the system. Look at all four together, look at the distribution rather than the mean, and treat any sharp improvement as a measurement change until proven otherwise. It usually is one.
LinearB

LinearB pulls events from your forge, CI and ticket tracker and builds a delivery pipeline view on top of them, with the four metrics alongside PR-stage breakdowns like pickup time and review depth. Its distinguishing feature is that it acts on the data as well as displaying it, through a bot that nudges stale PRs, routes reviewers and enforces workflow rules in the forge. That moves it from a reporting product toward a workflow product, which is either the main reason to buy it or the main reason not to.
Pros
- Stage-level breakdown of PR lifetime, which is where actionable delivery problems actually show up
- Automation that acts in the forge, so a finding about stale reviews can become a routing rule rather than a slide
- Goal and target framing built in for teams that want to run improvement cycles explicitly
- Connects ticket data to code data, so work type distribution sits alongside delivery metrics
Cons
- The automation layer is opinionated and can feel like process enforcement to a team that did not ask for it
- Individual-level views are readily available, so the policy discussion is unavoidable rather than optional
- Ticket-derived metrics inherit every inconsistency in how your team uses the tracker, which is usually considerable
Best for: Teams that want to change PR workflow behaviour, not just observe it, and are prepared to run that as a visible programme.
Pricing: Per-contributor subscription with tiers, where the automation and goal-setting capability sits above the basic metrics view.
Swarmia

Swarmia covers delivery metrics, investment distribution and developer survey data in one product, and is unusually explicit about the anti-surveillance position: the product design pushes toward team-level aggregation and toward the team seeing its own data. It also does working-agreement tracking, where a team commits to a rule such as a WIP limit or a review response time and the tool reports against that rule rather than against a vendor benchmark.
Pros
- Team-first framing that makes the healthy usage pattern the default rather than a configuration choice
- Working agreements let a team improve against a rule they chose, which survives contact with engineers far better than an imposed target
- Investment categories answer the “where did the quarter go” question that executives are usually really asking
- Survey capability alongside system metrics, which covers the things git events cannot see
Cons
- Investment distribution depends on issue hygiene in the tracker, so the number is only as good as your labelling discipline
- Less automation in the forge than the workflow-oriented tools, so it reports rather than intervenes
- The opinionated team-level framing is a limitation if you genuinely need per-service or per-org rollups for a large organisation
Best for: Engineering organisations that want delivery metrics without the trust cost, and will use them as team-owned rather than management-owned.
Pricing: Per-developer subscription with a free tier for small teams, tiered by which modules you enable.
Jellyfish
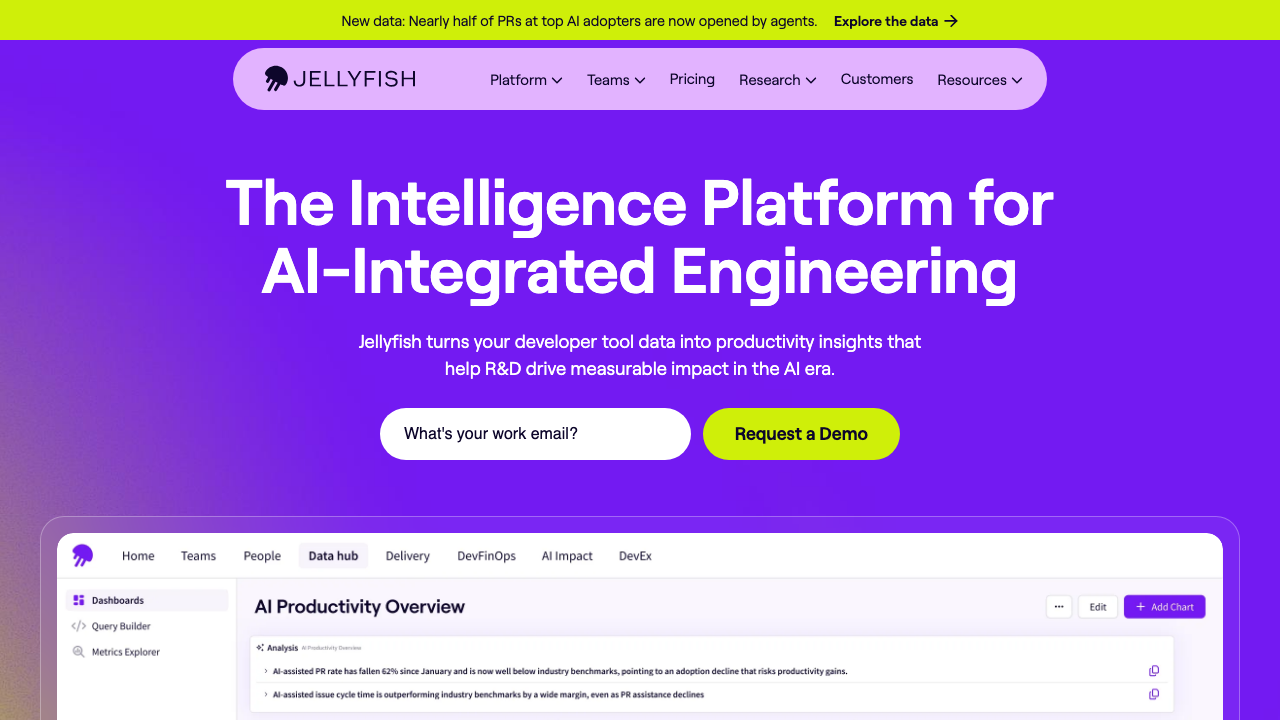
Jellyfish is aimed upward. It maps engineering activity onto business categories such as roadmap work, keeping the lights on, and maintenance, and it is built for the conversation between an engineering executive and a CFO about where capitalised engineering time went. The four metrics are present, but they are not the centre of the product, and buying it primarily for DORA reporting is overpaying for the parts you will not use.
Pros
- Allocation reporting designed for finance and board audiences, including capitalisation support
- Connects engineering activity to epics and initiatives, so the story is about investment rather than commits
- Handles large multi-team organisations and org-hierarchy rollups better than the team-scale tools
- Useful for answering planning questions about capacity that raw delivery metrics cannot
Cons
- Allocation accuracy depends heavily on tracker discipline, and the output looks authoritative regardless of the input quality
- Executive framing means the people being measured are rarely the people reading it, which is precisely the dynamic that erodes trust
- Enterprise sales motion and pricing, with implementation effort to match
- Lighter than the specialists on the PR-stage detail that engineers can actually act on
Best for: Larger engineering organisations where the real question is investment allocation to a finance audience, not pickup time.
Pricing: Annual enterprise contracts scaled by engineering headcount, quoted rather than listed.
Haystack
Haystack is a focused delivery-metrics product centred on the four metrics and PR flow, without the allocation and finance layers. It is comparatively quick to connect and get a first read from, since the forge is the primary data source and tracker integration is secondary. For a team that wants to know whether their cycle time is getting worse and does not want a programme, that focus is the point.
Pros
- Fast to stand up because it leans on forge data rather than requiring tracker hygiene
- Scoped to delivery flow, so the dashboard is readable without training
- Bottleneck highlighting on PR stages rather than a wall of undifferentiated charts
- Suits a single team evaluating whether this category is worth a larger commitment
Cons
- Narrower than the platform products, so it will not answer allocation or investment questions
- Smaller vendor, which matters for procurement and long-horizon commitments
- Forge-centric view means work that happens outside pull requests is invisible
Best for: A single team or a small engineering organisation that wants delivery flow visibility without adopting a measurement programme.
Pricing: Per-developer subscription with tiers, positioned below the enterprise platforms.
Sleuth
Sleuth approaches the four metrics from the deployment side rather than the pull request side. It models deploys as first-class objects, including deploys that are feature-flag changes or configuration changes rather than code releases, and computes change failure rate and recovery from that deploy timeline. That framing gives it the most defensible change failure rate in this list, because it is reasoning about deployment events rather than inferring failure from revert patterns alone.
Pros
- Deploy-centric model produces a more credible change failure rate than revert-detection heuristics
- Understands feature flag changes and config changes as deploys, which matches how modern releases actually work
- Deploy tracking is useful on its own as a correlation source during incidents
- Lighter conceptual overhead than the allocation platforms
Cons
- Requires real integration with your deploy tooling to be accurate, which is more setup than reading the forge API
- Less depth on PR-stage bottlenecks than the flow-oriented tools
- Narrower product scope, so it tends to sit alongside something else rather than replacing it
Best for: Teams with mature continuous deployment and feature flagging who want stability metrics they can actually defend.
Pricing: Per-developer subscription with tiers, metered on the number of developers whose deploys are tracked.
DX
DX comes at developer productivity from the research side, combining periodic developer surveys with system-derived metrics. The premise is that a large share of what slows engineers down never appears in git: slow local builds, flaky tests, unclear ownership, waiting on another team, bad documentation. Surveys catch those, telemetry does not, and the two together produce a better picture than either alone.
Pros
- Captures friction that no amount of forge data will reveal, which is the honest gap in every telemetry-only product
- Survey design comes from people who study this rather than from a dashboard vendor adding a feedback form
- Pairs qualitative findings with system metrics, so a complaint can be checked against the pipeline data
- Suits organisations trying to justify platform investment, where the before-and-after is largely experiential
Cons
- Surveys need real participation, and participation decays once people conclude nothing changed after the last one
- Slower feedback loop than a live dashboard by design, which frustrates teams expecting real-time numbers
- Aimed at organisations large enough to have a platform or developer experience function
- Enterprise pricing and engagement model
Best for: Organisations with a platform team that needs to know which friction to remove next and prove that removing it helped.
Pricing: Annual contracts scaled by engineering headcount, sold as a programme rather than a self-serve dashboard.
Faros AI
Faros is built as an engineering data platform first and a metrics dashboard second. It ingests from a wide range of sources into a unified model you can query directly, which suits organisations with heterogeneous tooling across many business units, or with an existing data team that wants the engineering data in the warehouse alongside everything else. The open-source connector layer means the ingestion work is inspectable rather than a black box.
Pros
- Unified data model you can query yourself, so you are not limited to the vendor’s chart set
- Broad connector coverage, which matters when different divisions use different forges and trackers
- Open-source ingestion components make the transformation logic auditable, which is rare here
- Custom metric definitions, so you can encode your own lead-time boundaries rather than accept theirs
Cons
- Substantially more setup and ongoing ownership than a turnkey dashboard, and it needs someone to own it
- Flexibility means you must define your own metric semantics, which is real work and real arguing
- Overkill for a single team or a company with one forge and one tracker
Best for: Large or acquisition-heavy organisations with fragmented tooling and the data engineering capacity to run a platform.
Pricing: Enterprise contracts scaled by engineering headcount, with self-hosted and cloud deployment options.
Building it from your own CI data
Take this seriously before spending anything, because for a lot of teams it is the right answer and it takes an afternoon.
Deploy frequency and lead time are both computable from data you already have. Your forge API gives you merge commits with timestamps. Your deploy pipeline knows when it finished and which commit it shipped. Join those two and you have deploys per day per service, and merge-to-production duration for every change. Write the rows to a table, point a chart at it, and you have the two metrics that respond to real improvement.
The pieces, in order of effort:
- A deploy event table. One row per production deployment: service, commit SHA, timestamp, and outcome. Emit it from the last step of your deploy job. This is a few lines of curl and it is the foundation for everything else.
- A merge table. One row per merged PR: repository, SHA, PR opened, first review, approved, merged. The forge API gives you all of it, and this is where pickup time comes from.
- The join. Map each deploy to the commits it contained by walking back to the previous deployed SHA. This is the only genuinely fiddly part, and it is fiddly in a way that every vendor also has to solve.
- Failure signal. Deliberately manual to start. A label on incidents that names the deploy that caused them. Low volume, high accuracy, and you will learn more from thirty hand-labelled rows than from a heuristic applied to three thousand.
What you get: definitions you control and can explain, no per-developer view to argue about because you never built one, no vendor, and data in your own warehouse next to everything else. What you give up: benchmarking against other organisations, survey capability, the automation layer, and the polish that makes an executive take the chart seriously.
The realistic failure mode is that nobody owns it after the person who built it moves on, and six months later the dashboard is broken and nobody noticed because nobody was looking. That is the honest argument for buying instead of building, and it has nothing to do with features. If your CI platform already exposes deployment data, check what is there before you start, since several of the platforms discussed in CI/CD platform selection emit deployment events you can consume directly.
How to choose
Start with the question behind the request, because it determines the category more than any feature comparison does.
If an executive asked where engineering time goes, you need allocation reporting, not DORA. Jellyfish is built for that audience, Swarmia covers it at team scale, and no amount of lead-time charting will answer the actual question.
If you want delivery to get faster, you need PR-stage breakdowns and specifically pickup time. LinearB if you want the tool to intervene, Haystack if you want it to report, Swarmia if you want the team to own the improvement themselves.
If your stability numbers are not defensible, the problem is your failure signal, not your dashboard. Sleuth if deploys are the natural anchor, or hand-labelled incident-to-deploy links if volume is low enough.
If the friction is experiential, meaning the team says things are slow but the metrics look fine, you need survey data. DX, or a simple recurring internal survey you run yourself.
If your tooling is fragmented across business units, you need a data platform rather than a dashboard. Faros, or your own warehouse.
If you have one forge, one pipeline and one team, build it. Two tables and a join.
| Tool | Primary lens | Individual-level exposure | Picks itself when |
|---|---|---|---|
| DORA metrics (standard, not a product) | Delivery system | None by design | You need shared definitions before shopping |
| LinearB | PR workflow plus automation | Available, prominent | You want the tool to change behaviour, not just report |
| Swarmia | Team ownership and investment | Deliberately de-emphasised | Trust cost is your main adoption risk |
| Jellyfish | Business allocation | Roll-up oriented | The audience is finance or the board |
| Haystack | Delivery flow | Available | One team wants flow visibility quickly |
| Sleuth | Deployments | Limited | Change failure rate needs to be defensible |
| DX | Developer experience research | Aggregated survey data | Metrics look fine and the team says otherwise |
| Faros AI | Engineering data platform | Depends on your model | Tooling is fragmented and you have data engineers |
| Your own CI data | Whatever you define | None unless you build it | You have one pipeline and an afternoon |
Whatever you pick, baseline before you change anything, and keep the definitions in a document that changes only with a changelog entry. The single most common way these programmes die is that the numbers move, nobody can explain why, and it turns out someone changed an integration. For the broader tooling picture around AI in the development loop, the hub at AI coding assistants covers where these metrics are most often misapplied, since teams frequently try to use lead time to prove an assistant rollout worked.
Frequently asked questions
Are DORA metrics still relevant?
The four metrics remain a reasonable description of delivery system health, and the underlying finding that throughput and stability improve together has held up well. What has aged is the way they get used: as a scorecard with target bands, applied to teams whose delivery model does not fit the definitions. Treat them as a diagnostic that starts conversations about where changes get stuck, keep your definitions stable, and they earn their place. Treat them as a grade and they measure your ability to redefine a deployment.
Can DORA metrics be used for performance reviews?
No, and the framework was never scoped to individuals. All four are properties of a delivery system involving many people, shared infrastructure and queueing effects that no individual controls. Computing them per person produces numbers that respond to PR splitting and review speed rather than to contribution, penalises the senior engineers whose value comes from multiplying others, and costs you the candour that makes the data useful in the first place. Decide this policy before the tool is installed and put it in writing.
What is a good deployment frequency?
There is no number that is correct outside a context, and quoting a band from the research as a target is the most common misuse of this framework. The useful question is whether your median service deploys more often than it did last quarter, and whether batch size is shrinking. A team deploying weekly with small, reversible changes and a reliable pipeline is in better shape than a team deploying hourly with no rollback path, and no benchmark table will tell you that.
How is lead time actually calculated?
Differently by every tool, which is why two dashboards disagree. The research definition runs from commit to running in production, but commit timestamps are rewritten by rebasing and squashing, so most tools start from PR creation or from the forge’s record of the first branch commit. Ask any vendor precisely which event starts and ends their clock, then break the total into coding, pickup, review and deploy stages. The stages are actionable and the total is not.
Should we build this ourselves instead of buying?
If you have one forge and one deploy pipeline, building the two throughput metrics is an afternoon of work and gives you definitions you control. Buy when you need survey data, cross-organisation benchmarking, allocation reporting for a finance audience, or simply a system somebody else maintains. The realistic argument for buying is ownership, not capability: homegrown dashboards break quietly when the person who built them moves teams.
Related reading
- Best engineering analytics platforms — the wider category these tools sit in, and what each does beyond the four metrics.
- Best AI coding assistants — the hub, including why lead time is a poor proof of an assistant rollout.
- Best CI/CD platforms — where your deployment events come from, and what they already expose.
- Best postmortem tools — incident classification discipline, which decides whether your change failure rate means anything.
- Best code quality tools — the other measurement category with a correlation problem worth interrogating.
- Best internal developer platforms — the investment these metrics are most often used to justify.