The first time an LLM feature misbehaves in production, you open your APM tool and find nothing useful. The span is there. It took 4.2 seconds, it returned HTTP 200, and it is silent about the thing you need to know, which is that the model answered a billing question with a made-up refund policy.
That is a category difference, not an instrumentation gap. Every observability tool built before 2023 assumes the interesting properties of a request are its duration and its status code, because for a REST endpoint they are. For a model call the duration is nearly irrelevant and the status is always fine — the failure is semantic and it lives inside the payload your APM was carefully designed not to store.
So LLM observability is a genuinely new purchase, and the decision hinges on something most comparisons skip: the moment you start capturing prompts and completions you have created the most sensitive data store in your company, and you did it with a decorator. Redaction, retention and access control are not the appendix to this decision. They are the decision.
I run product and engineering at an AI company, and the argument I have had most often is not “which vendor” — it is “what exactly are we writing down, for how long, and who can read it”. Get that wrong and your incident-response cost dwarfs anything you saved on the tool.
Key takeaways
- An LLM span is interesting for its payload, not its latency. Existing APM tools store the shape of a request and drop exactly the part you need.
- Turning on prompt capture creates a store of verbatim user input, including whatever the user pasted into your chat box. Decide redaction and retention before capture, not after.
- You cannot debug a rare bad answer from a 1% head sample. Pick a capture shape deliberately: full payloads with short retention, tail-based capture of failures and low scores, or heavy redaction with long retention.
- The OpenTelemetry GenAI semantic conventions are what let LLM spans land in the same backend as the rest of your telemetry. They are a spec, not a product, and they are still moving.
What an LLM trace actually contains
A single model call, captured properly, is one span carrying: the rendered prompt in full, including the system message and every retrieved document stuffed into it; the completion in full; input and output token counts separately, because they price differently; the model identifier and the parameters in effect; the tool definitions you offered; the finish reason; and whether this was a retry of something that just failed.
That is already an order of magnitude more payload than an HTTP span. Then it gets worse, in the interesting way.
A retrieval-augmented call is a subtree. Query rewriting is a model call. Embedding is a model call. The vector search is a span with a query vector, a filter, a top-k and the identifiers and scores of what came back. The rerank is another model call. Only then does generation happen. When an answer cites a document that does not support it, “did retrieval fail or did generation ignore the context?” is answerable from that subtree and unanswerable from anything less.
An agent is a tree of ten to fifty of those. A planner span, then a loop: model call, tool call with arguments, tool result, model call, tool call. Sub-agents nest. The loop may run four times because the model kept calling the same tool with the same broken argument, and the only symptom upstream is that the request took 40 seconds. Reconstructing which iteration went wrong needs the tree with parentage intact — which needs whatever carries your trace context to survive every async hop, worker pool and framework callback in your agent runtime.
Latency percentiles tell you almost nothing here. A p99 of 12 seconds on an agent endpoint is a fact about token generation and tool round-trips, not about quality. The distribution you want is over scores, tool-error rates, retry counts and loop depth, and none of those exist unless something computes them per trace. That is why LLM observability and LLM evaluation are sold together by nearly every vendor below: a trace is only diagnostic once something has scored it.
One attribute teams forget: the prompt version that produced the span. Without it a regression that started on Tuesday is unattributable, because you cannot tell whether the prompt changed, the model changed under you, or the traffic mix did — which is why prompt management belongs in this conversation.
Your trace store is now your most sensitive database
The instant you enable payload capture, every user prompt is stored verbatim. Not a hash, not a summary — the literal text, including the support ticket somebody pasted with a customer’s name and address in it, the API key a developer dropped into your chat to ask why it was failing, the medical detail a user volunteered because your product invited a conversational tone. Your application database has a schema, a data classification, a retention policy and an access review. Your trace store has a decorator and a default retention window you did not choose.
Redaction at capture time versus at storage time. At capture time, the SDK or your own hook rewrites the payload before it leaves the process: pattern and entity passes for emails, card numbers, national identifiers and bearer tokens, then masking or dropping. At storage time, the raw payload crosses the network and is scrubbed on arrival. The difference is not cosmetic — capture-time redaction means the value never existed outside your process boundary, which is an argument you can make to a security reviewer. Storage-time redaction means it did, and you are relying on the vendor’s pipeline. Every serious tool here supports a capture-time masking hook; the question is whether you wrote one before you shipped.
A blunter option deserves consideration: capture metadata, token counts, scores and tool-call structure, but store only a hash or truncation of the prompt text. You lose the ability to read what the user said, which is a real loss for debugging, and you stop being a breach target. For a healthcare or fintech feature that is often the right trade, and it is reversible in the safe direction — you can turn payloads on for a scoped subset later.
Retention, per project rather than globally. Debugging value decays fast; most lookups happen within days. Compliance risk accumulates. So a single global retention setting is always wrong for someone. What works is short retention on full payloads for the noisy production project, longer retention on redacted metadata, and a deliberately longer window only for traces promoted into an evaluation dataset — at which point they are curated test data with an owner, not incidental logs.
Who can read a trace. By default, in most of these tools, everyone in the workspace can — your whole engineering org plus whoever was added during the trial and never removed, reading arbitrary customer conversations. Check three things: whether roles can hide payloads while leaving traces and metrics visible, whether payload views are audit-logged, and whether SSO and group mapping exist on the tier you will actually buy rather than only the enterprise one.
Both shortcuts make this worse. “We will sample, so exposure is small” misreads the risk — one stored credential is a rotation and an incident report regardless of sample rate. “We will redact later” means the unredacted data is already in the store and in the vendor’s backups, so removing it is a deletion project with a paper trail instead of a config change.
Needs first-hand data: Take 500 real production prompts from a staging capture, run your redaction hook over them, and hand-label the output for false negatives (sensitive value survived) and false positives (redaction destroyed something you needed to debug). Publish both rates. That pair of numbers decides whether capture-time redaction is sufficient or whether you fall back to metadata-only capture.
Sampling honesty
Full-payload capture of every model call retained indefinitely is unaffordable in storage and unacceptable in risk. A 1% head sample is useless for the thing you bought the tool for, because the bad answer you are chasing happens in 0.3% of requests and your sample missed it.
Head sampling is the wrong mechanism for LLM traffic. It is cheap and uniform, and uniformity is exactly what you do not want when the interesting events are rare and correlated with failure. Three shapes actually work.
Full capture, short retention. Everything stored, retained one to two weeks, then deleted or reduced to metadata. You can debug anything recent, which covers nearly all real debugging. You cannot answer “has this been happening since March”. Easiest to reason about and to defend in review, because the exposure window is bounded and stated.
Tail-based capture. Buffer the trace, decide at the end. Keep it on an error, a failed tool call, a loop deeper than N iterations, latency over a threshold, an online score below a threshold, or a user thumbs-down. Sample a small uniform fraction of everything else as a baseline. This matches the problem and is meaningfully harder to operate: the decision needs the whole trace buffered, which means the deciding component must see every span of a trace — the same constraint tail sampling has in an OpenTelemetry Collector.
Aggressive redaction, full retention. Capture everything forever as structure and metrics rather than text: token counts, model, parameters, tool names with values masked, scores, latencies, prompt version. Excellent longitudinal analysis, and you can never read what the user said. Pair it with a narrow, consented, short-retention channel for when a human explicitly asks for help.
The mistake is inheriting the vendor default, which is usually full capture with long retention because that maximises the demo’s value and your bill. Whichever shape you choose, write down what it cannot answer. That sentence is the most useful line in your runbook.
Needs first-hand data: Run tail-based capture and a 5% head sample side by side on the same production traffic for two weeks. Count how many of the week’s genuinely bad outputs — judged by a human reviewing thumbs-down events — appear in each set. That ratio is the entire argument for tail-based capture and nobody has published it for LLM workloads.
OTLP and the OpenTelemetry GenAI conventions: the standard underneath, not a product
Every tool below is a product you deploy or buy. OTLP and the OpenTelemetry GenAI semantic conventions are neither. There is no vendor, no dashboard, no retention setting and no invoice — the conventions are a document describing what a span representing a model call should be named and which attributes it carries, and OTLP is the wire format that moves it. You do not choose them instead of Langfuse or Datadog. You choose them underneath one, and that choice decides whether your LLM telemetry is a separate island or part of the same trace as the HTTP request that started it.
The concrete thing the conventions specify is naming. Left alone, every vendor invents its own keys for the same facts — one names the input token count one way, another another way, a third buries it in a JSON blob. The conventions fix names for the operation, model, provider, token usage, tool calls and conversation content, so a span emitted by one library is intelligible to a backend written by someone else. That is what makes the OTel-based tools here interchangeable in a way proprietary SDKs are not, and it is the same convergence that already happened for HTTP and database spans — the story the OpenTelemetry-native platforms roundup covers for the rest of your stack.
What it gives you
- Your LLM spans join the same trace as the inbound request, the database queries and the queue hop, so “the request was slow” and “the model call was slow” are one waterfall rather than two tools
- Instrumentation becomes portable: an exporter change points the same spans at a different backend with no re-instrumentation of agent code
- The Collector becomes where policy lives — redaction, attribute dropping and tail sampling run in infrastructure you control, before payloads leave your network
- You can fan out to two backends at once, which is the only sane way to evaluate a second tool against real traffic
What it does not do
- The GenAI conventions are younger and less settled than the HTTP ones, so libraries written against different versions disagree about attribute names and you will normalise that by hand
- Prompt and completion content is the least settled part of the spec, and it is exactly the part carrying your compliance risk
- It defines no evaluation semantics, so there is no standard way to express “this trace scored 0.4 on faithfulness” and scores stay vendor-shaped
- It stores nothing, displays nothing and scores nothing. You still pick and pay for a product below, and you still operate the Collector fleet
- Auto-instrumentation coverage varies sharply by framework, so a bespoke agent loop needs manual spans regardless
Langfuse
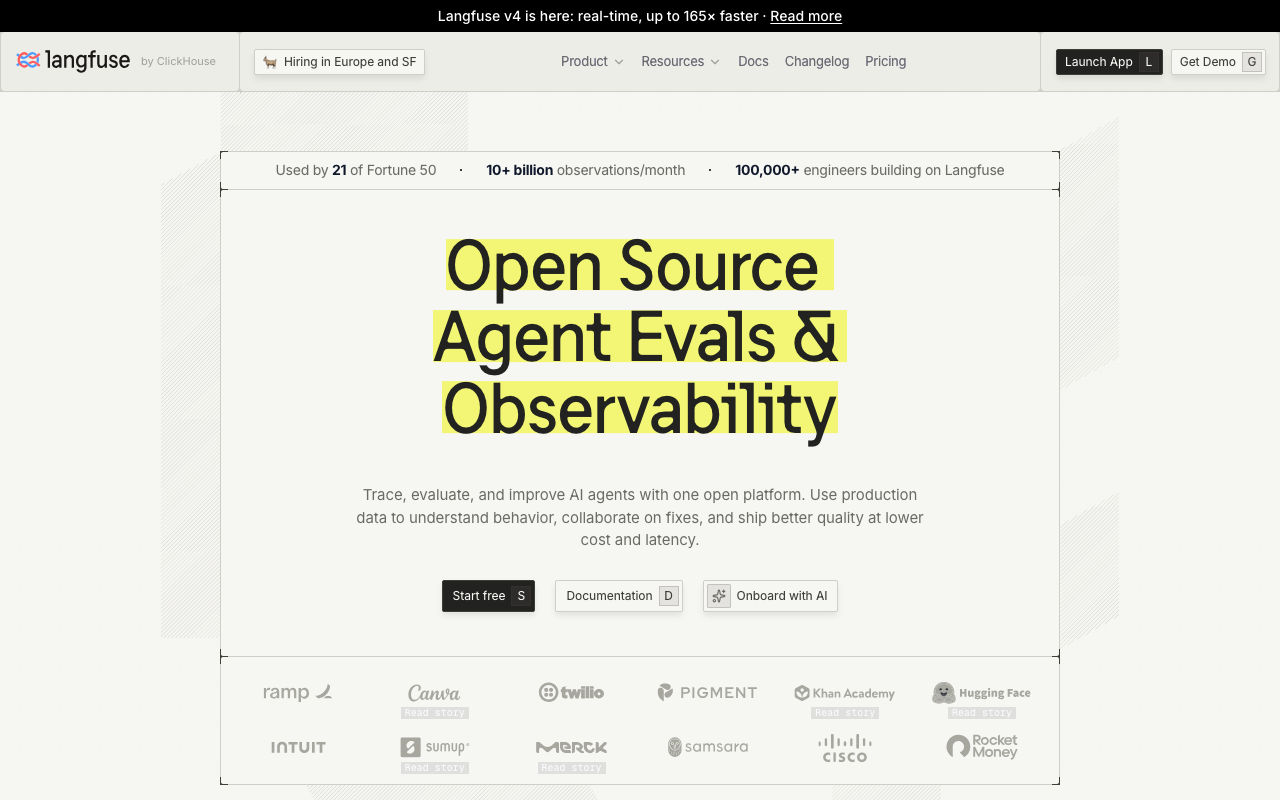
Langfuse is the open-source default here and the one I would shortlist first for any team with a data-residency constraint. It covers tracing, prompt management, datasets and evaluation in one product, ingests OTLP alongside its own SDKs, and the same build runs self-hosted or as managed cloud — so the hardest question in this article has an answer that does not involve a data-processing agreement.
Pros
- Self-hosting keeps prompt and completion payloads inside your own infrastructure, removing a class of compliance argument rather than mitigating it
- One product spans tracing, prompt versioning, datasets and scoring, so a bad trace becomes an eval case without leaving the tool
- Per-project retention and payload masking hooks make redaction configurable rather than global
Cons
- Self-hosting at volume means operating a columnar store, a queue and object storage alongside Postgres — real platform work
- The evaluation workflow is broad rather than deep; eval-first tools compare versions more clearly
- Some access-control and audit features that matter precisely because payloads are sensitive sit on paid tiers
Best for: Teams whose security review will not approve verbatim prompts leaving their network, with platform capacity to run a self-hosted store.
Pricing: Open source with no licence cost when self-hosted, plus managed cloud metered on trace volume with retention tiers and enterprise features on higher tiers.
LangSmith
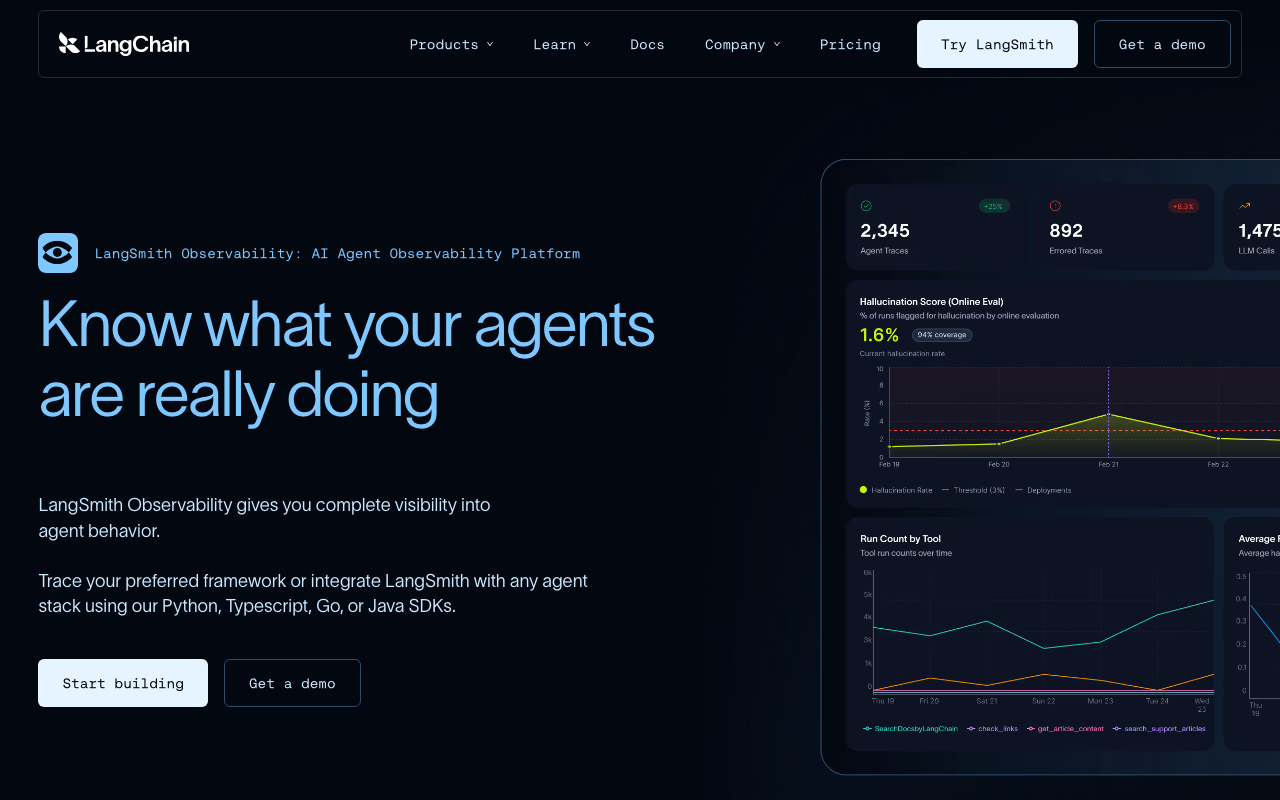
LangSmith is LangChain’s commercial observability and evaluation platform, and it is worth being precise: LangChain the framework and LangGraph the agent runtime are open source, LangSmith is not. Its advantage is the tightest possible coupling to that runtime — node-level spans, thread and run hierarchy, and state at each step with almost no instrumentation work. That coupling is also the constraint.
Pros
- Deepest trace fidelity for LangGraph agents, including per-node state, which is the tree structure agent debugging needs
- Annotation queues and human review are first-class, so labelling bad traces into a calibration set is a supported workflow rather than a spreadsheet
- Threads and multi-turn views match how chat products actually fail, rather than treating each call as isolated
Cons
- Not open source, and self-hosting is an enterprise arrangement, so data residency becomes a contract negotiation
- Much of the value is contingent on LangChain or LangGraph; a bespoke agent gets an ordinary experience
- Deepens dependence on one vendor across framework, runtime and observability at once, the opposite of what the OTel path buys you
Best for: Teams already building on LangGraph who want node-level agent traces and human annotation without writing instrumentation.
Pricing: Per-seat subscription plus usage-based metering on traces ingested with retention tiers, and an enterprise tier for self-managed deployment.
Arize Phoenix
Phoenix is Arize’s open-source tracing and evaluation project, genuinely OpenTelemetry-shaped via OpenInference conventions, and it runs anywhere from a notebook to a cluster. It is what I would reach for to inspect a RAG pipeline before deciding anything, because the retrieval span view with document scores is the clearest here. Arize has announced a new chapter with Dynatrace, and Phoenix continues to ship as Arize Phoenix.
Pros
- Runs locally with almost no setup, which makes it a development-time debugger rather than only a production backend
- Retrieval and reranking spans carry document identifiers and scores, so RAG failures separate cleanly into retrieval versus generation
- OTel-based instrumentation keeps spans portable rather than trapped in a vendor SDK
Cons
- OpenInference is Arize’s convention set rather than the OTel GenAI conventions, so attribute names still need reconciling across instrumentation sources
- Phoenix is the open-source slice; production-scale monitoring, drift and enterprise controls live in the commercial Arize platform
- The new chapter with Dynatrace puts the commercial roadmap inside an observability incumbent, so an independent-trajectory assumption no longer holds
Best for: Engineers debugging RAG and agent pipelines who want an OTel-native tracer they can run locally today and self-host later.
Pricing: Open source with no licence cost for Phoenix, with the commercial Arize platform sold on enterprise agreements rather than a public self-serve meter.
Braintrust
Braintrust starts from evaluation and adds tracing, which is the reverse of most tools here. Logs, datasets, scorers and the prompt playground are one object graph, so promoting a bad production trace into a regression case is a click rather than an export. If your bottleneck is “we cannot tell whether the change we are about to ship is better”, this is the shape that addresses it.
Pros
- Production log to dataset row to scored experiment is one continuous loop, which is where most teams lose weeks to glue code
- Per-case experiment diffs expose a change that improves the mean while breaking three cases you care about
- Scorers are code you write and version, which matters because useful quality metrics are domain-specific
Cons
- Commercial and managed; no open-source build to self-host if payload residency is a hard requirement
- Narrower than an APM platform — not where you watch infrastructure, and it will not replace one
- Asks the team to have opinions about scoring before it pays off, which is the actual blocker
Best for: Teams whose shipping decisions are gated on eval results and who want production traces feeding those evals continuously.
Pricing: Usage-based metering on logged spans and evaluation runs with a seat component, and enterprise agreements above that.
W&B Weave
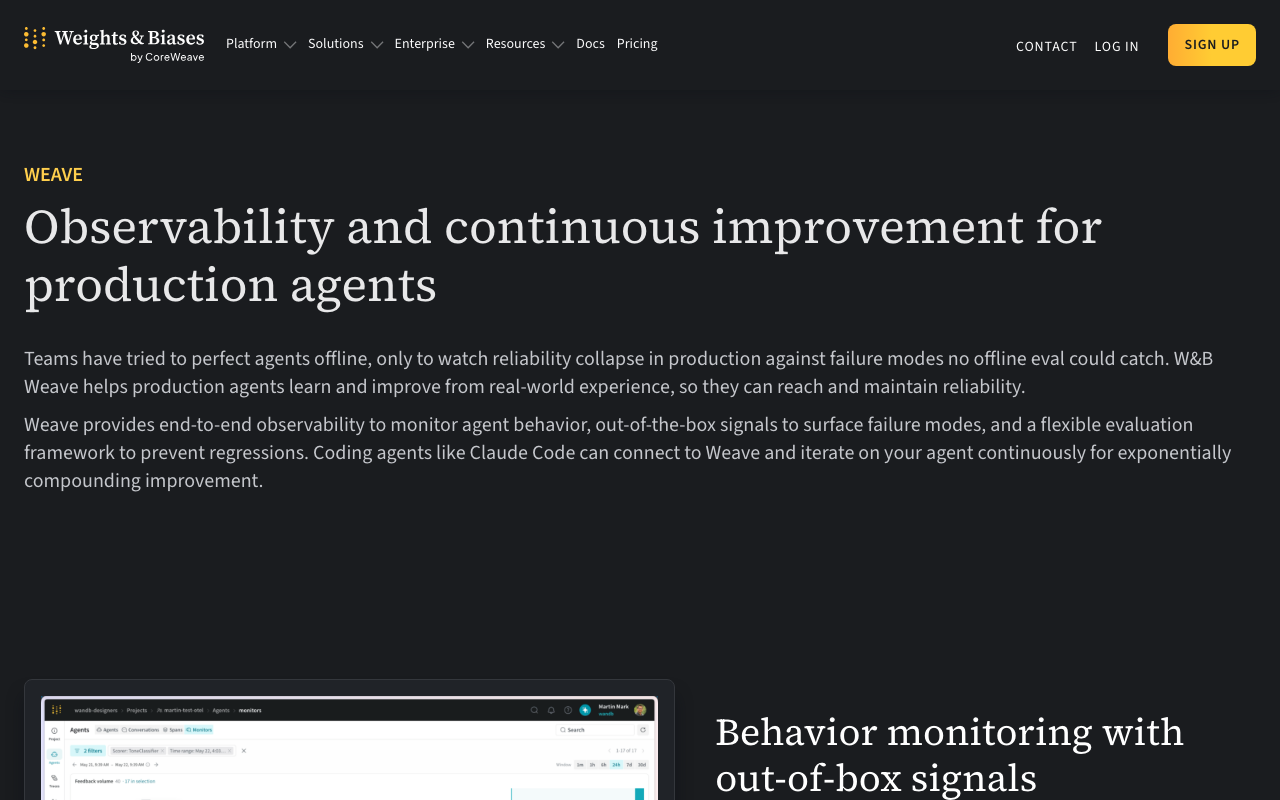
Weave is Weights & Biases’ LLM tracing and evaluation product, and its natural buyer already lives in W&B for model experiments. Capture is decorator-based — annotate a function and its inputs, outputs and nested calls appear as a trace — which fits research-shaped code better than most instrumentation designs.
Pros
- Traces arbitrary functions rather than only recognised framework calls, so bespoke agent loops are visible without bespoke instrumentation
- Evaluation comparison across runs is unusually mature, being the same problem W&B has solved for training
- Prompts, datasets and objects are versioned artifacts, which makes reproducing an old run tractable
Cons
- Pulls application telemetry into an ML-research account model, awkward when an on-call platform team owns the tool
- Weaker as a production monitoring surface; alerting and operational views trail tools designed for it
- Self-managed deployment is an enterprise arrangement, so payload residency is again a contract question
Best for: ML-heavy teams already using Weights & Biases who want tracing and evaluation in the same account as their training runs.
Pricing: Usage-based on traced data volume with retention tiers, layered on existing W&B seat-based plans, with enterprise contracts for self-managed deployment.
Traceloop
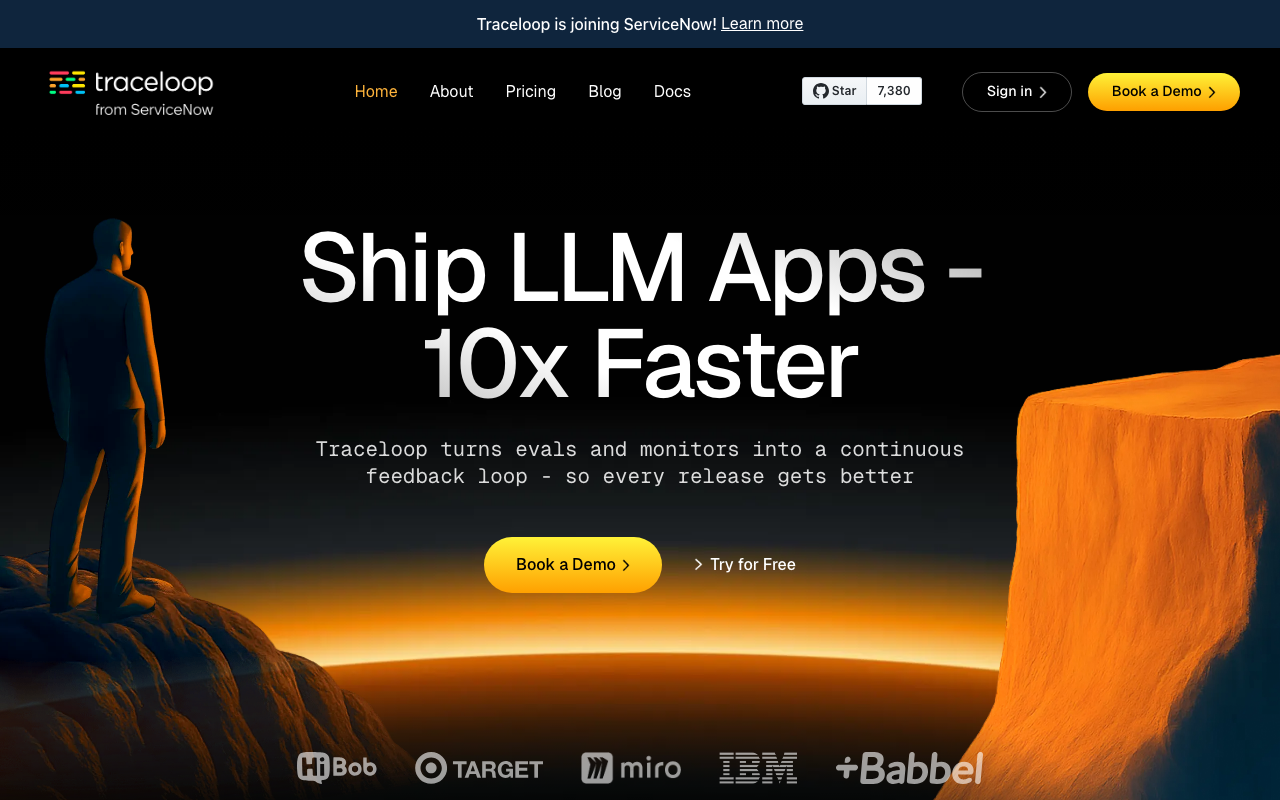
Traceloop’s real contribution is OpenLLMetry, its open-source instrumentation layer, which emits plain OpenTelemetry spans for model calls, vector stores and frameworks. That makes it the one option here you can adopt without adopting a backend: install it, point OTLP at what you already run, and LLM spans arrive alongside the rest of your telemetry. Traceloop has announced it is joining ServiceNow.
Pros
- Standard OTel spans, so any OTLP backend works and instrumentation does not commit you to a vendor’s UI
- The lowest-commitment way to get LLM telemetry into an existing stack, which is often the correct first move
- Policy — redaction, attribute dropping, sampling — lands in the Collector you already operate rather than a vendor setting
Cons
- Joining ServiceNow puts the hosted platform inside a large ITSM vendor, so the independent-startup framing no longer applies
- The platform layer is thinner than eval-first tools; dataset curation and scoring are not its strength
- Full payloads in a general-purpose backend means your APM’s access model now governs customer prompts, which may be more permissive than you assumed
Best for: Teams with an existing OTLP pipeline who want LLM spans in the same backend as everything else rather than a separate tool.
Pricing: OpenLLMetry is open source with no licence cost; the hosted platform is metered on ingested span volume with retention tiers.
HoneyHive

HoneyHive is an OTel-based platform covering tracing, evaluation, datasets, prompt management and human review, positioned at teams shipping agents rather than single-call features. It occupies much the same territory as Langfuse and Braintrust, so the honest way to choose between them is workflow taste and deployment model rather than a feature grid.
Pros
- Built on OpenTelemetry, so instrumentation is not a dead end if you change platforms
- Online evaluators, human review and dataset curation are one workflow rather than three integrations
- Agent traces are the design centre, so deep nested trees render usefully rather than as a flat list
Cons
- Smaller vendor and ecosystem than the leaders, which shows in integration breadth
- Commercial and managed-first, so a self-hosting requirement narrows your options quickly
- Heavy overlap with Langfuse and Braintrust means you are choosing on ergonomics, which only a real trial reveals
Best for: Agent-focused teams who want tracing, online evaluation and human review from one vendor and do not need self-hosting.
Pricing: Usage-based on traced events and evaluation runs with tiered plans, and enterprise agreements for larger deployments.
LangWatch
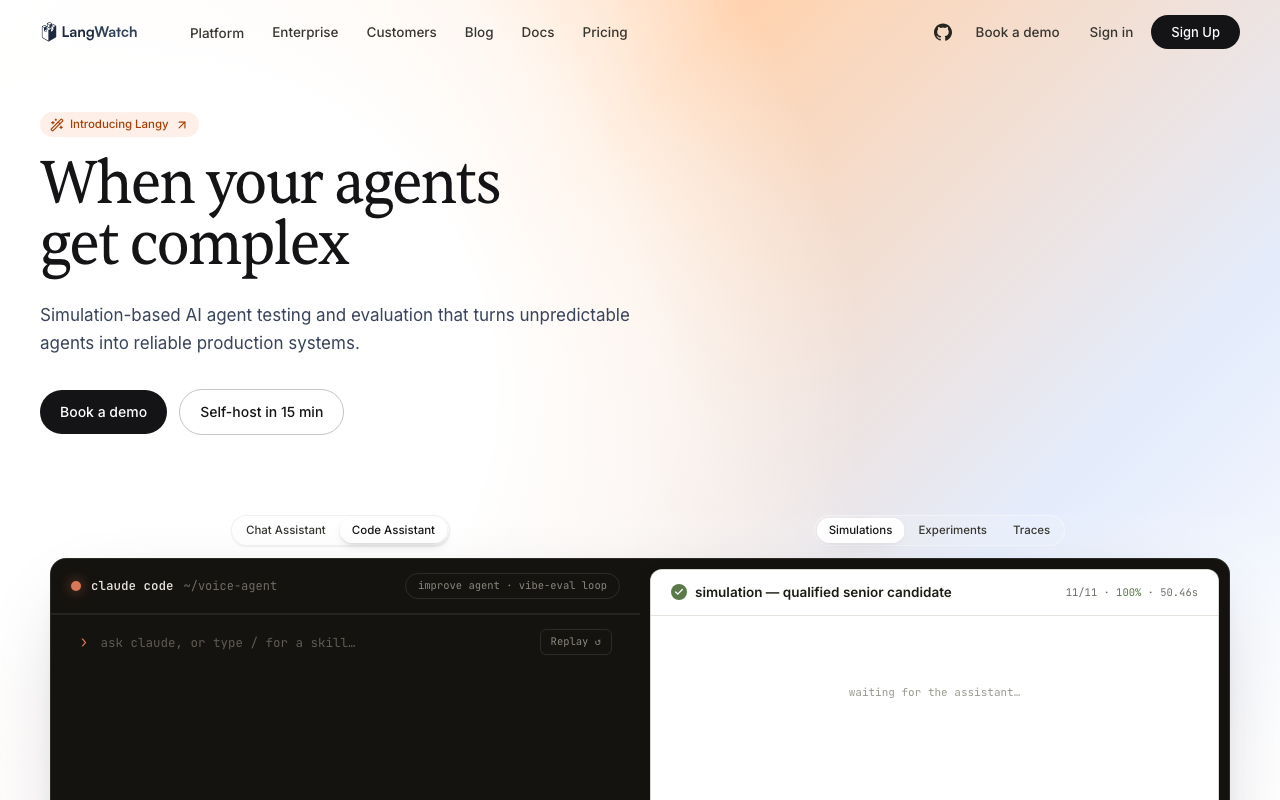
LangWatch pairs tracing with an optimisation and scenario-testing layer, and the open-source core is self-hostable. The differentiator is that improving the pipeline is part of the product: alongside traces and evaluators it includes optimisation tooling and simulation-style testing of agent behaviour across scenarios.
Pros
- Open-source core with a self-hosting path, keeping payload residency answerable without an enterprise contract
- Scenario and simulation testing covers multi-turn behaviour that single-call evaluation misses entirely
- Optimisation tooling sits next to the traces, so a measured weakness has a defined next step
Cons
- Smaller community than Langfuse, so self-hosting means fewer people have already hit your problem
- Breadth means depth varies, and the optimisation layer assumes more ML literacy than a typical product team has
- Default evaluator libraries need domain curation before their scores mean anything
Best for: Teams building multi-turn agents who want self-hostable tracing plus scenario-level behavioural testing in one place.
Pricing: Open source and self-hostable at infrastructure cost, with a managed tier metered on traced volume and evaluation usage.
Helicone
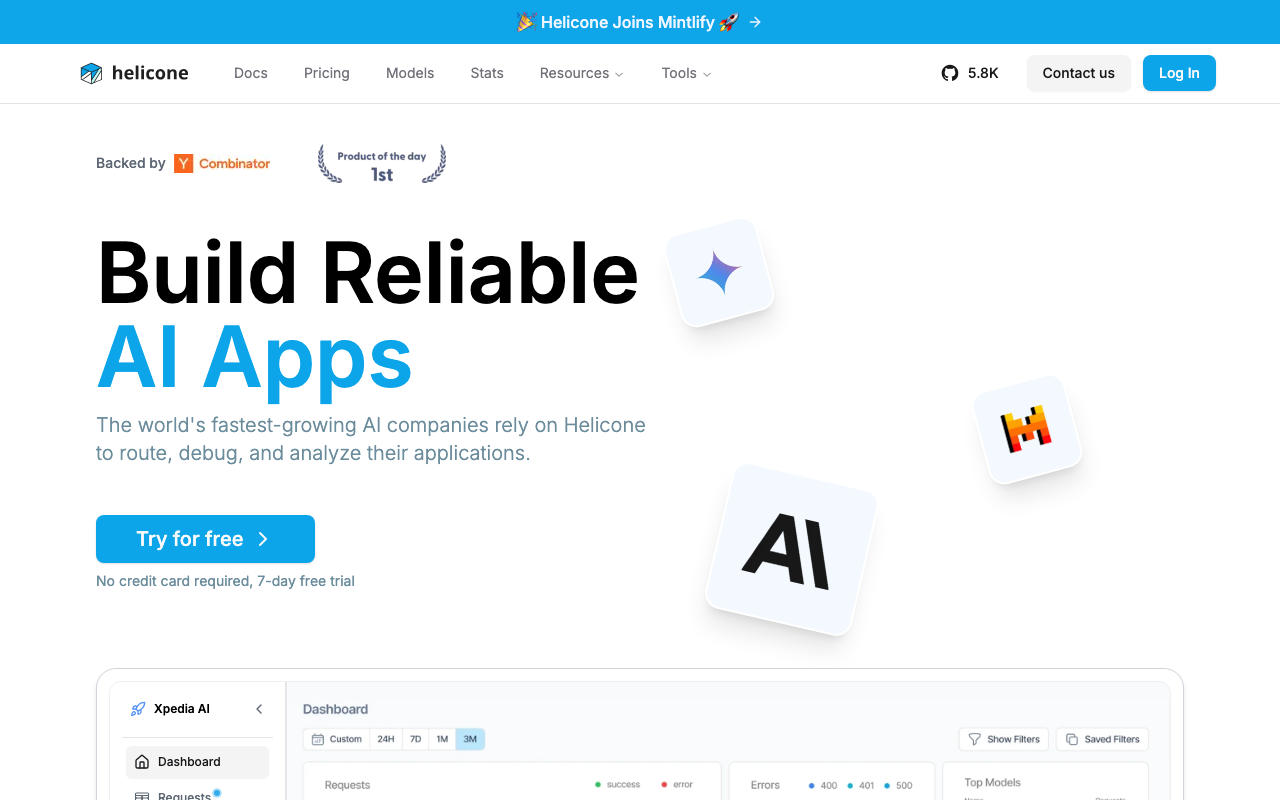
Helicone takes the proxy approach: change your provider base URL and every call is logged, with caching, rate limiting and cost attribution as side effects. That is the shortest adoption path available. Helicone has announced it is joining Mintlify, and a proxy is an architectural decision rather than an integration style — I cover the gateway version of the trade in the AI gateways guide.
Pros
- A base-URL change is the lowest-effort instrumentation here, with no SDK wrapping and no decorator discipline
- Being in the request path means caching, rate limiting and per-key cost attribution arrive without separate integration
- Observing the wire means coverage does not depend on which framework each team chose this quarter
Cons
- A proxy in the hot path is an availability dependency, and the async logging mode that avoids this gives up the proxy-only features
- The proxy necessarily sees full prompts and completions, so redaction happens before the call leaves your process or not at all
- Trace structure for deep agent trees is weaker, because the proxy sees a sequence of calls rather than your call graph
Best for: Teams that want logging, caching and cost attribution across many services with one configuration change, and can accept a component in the request path.
Pricing: Open source and self-hostable, with a managed tier metered on logged requests and retention, and cached traffic metered separately from uncached.
Datadog LLM Observability

If you already run Datadog this is the option with the lowest organisational cost. LLM spans land in the same platform as your infrastructure, traces and logs, under the same RBAC, audit logging, retention machinery and procurement relationship you already signed. For a regulated team, “no new vendor holding customer prompts” is a stronger argument than any feature in a specialist tool.
Pros
- One trace spans the inbound request, the database calls and the model calls, with no correlation work between products
- Access control, audit logging, SSO and residency controls are the mature ones you already configured, which matters more here than for ordinary telemetry
- No new vendor, no new data-processing agreement, no second on-call surface
Cons
- Another meter on a bill that is already the reason teams read the Datadog alternatives guide, and LLM payloads are large
- Payload redaction and per-project retention are less granular than in LLM-native tools, which is precisely the axis that matters for prompts
- Dataset curation, annotation and experiment comparison are thin next to eval-first specialists, so you will likely still buy one
Best for: Teams standardised on Datadog whose compliance posture makes adding a second vendor with access to user prompts the harder problem.
Pricing: An additional usage-based meter on the existing per-host platform subscription, charged on LLM spans ingested with retention as a separate dimension.
How to choose
Two questions eliminate most of the list.
Can verbatim user prompts leave your network? If no, you are choosing among Langfuse, Phoenix, LangWatch and self-hosted Helicone, or capturing metadata only and sending it anywhere. Answer this before you book a demo, because it is the constraint most likely to kill a decision in week three.
Do you already have an OTLP pipeline? If yes, the cheapest correct first move is OpenLLMetry into your existing backend. Within a fortnight you will know whether the missing piece is really tracing — in which case you are done — or evaluation and dataset curation, which is a different purchase.
Then instrument one feature end to end, retrieval subtree and agent loop included, before comparing anything. Write the redaction hook in the same pull request. Pick a capture shape and write down what it cannot answer. Only then compare products on your own traffic, because the demo dataset is clean, small and well-behaved and yours is none of those.
| Tool | Deployment | Instrumentation | Picks itself when |
|---|---|---|---|
| Langfuse | Open source, self-host or cloud | SDKs plus OTLP | Payloads must stay in your infrastructure |
| LangSmith | Commercial cloud | Native to LangGraph | Your agent is a LangGraph graph |
| Arize Phoenix | Open source, local or self-host | OTel via OpenInference | You are debugging RAG today |
| Braintrust | Commercial cloud | SDK, eval-first | Shipping is gated on eval results |
| W&B Weave | Commercial cloud | Python decorators | The team already lives in W&B |
| Traceloop / OpenLLMetry | OSS instrumentation, hosted platform | Plain OTel spans | You want spans in the OTLP backend you run |
| HoneyHive | Commercial cloud | OTel-based SDK | Agent tracing plus online evaluation, one vendor |
| LangWatch | Open source, self-host or cloud | OTel-compatible | Multi-turn behaviour needs scenario testing |
| Helicone | Open source, proxy or self-host | Base URL change | Many services, minimal effort |
| Datadog LLM Observability | Commercial cloud | Datadog SDK and OTLP | A second vendor with prompt access is worse |
If your conclusion is “we need both a general observability platform and an LLM-specific one”, that is usually correct, and the APM tools map covers the other half of the pair.
Frequently asked questions
Can I just use my existing APM for LLM observability?
Partly, and more than people assume. OTel instrumentation gets you model spans, token counts and the agent tree in your existing backend, which covers latency, error and structural debugging. What you do not get is dataset curation, scoring, annotation queues and experiment comparison — the machinery for deciding whether quality changed. Most teams end up with the general backend for structure and a specialist for quality.
Should prompts and completions be stored at all?
It depends on what you are willing to own. Storing them makes debugging much faster and makes you custodian of verbatim user input, including things users should never have typed. Storing structure and scores without text keeps most longitudinal analysis and loses the ability to read a conversation. Decide per project, and write the decision where the next engineer will find it.
How do I keep agent traces from breaking into disconnected spans?
Context propagation, exactly as in any distributed system. Every async hop, thread-pool handoff, queue and framework callback must carry the active span context, or child spans start new traces. When traces look shallow or arrive as fragments, the cause is almost always a task launched without the current context rather than the tool.
Related reading
- Best AI gateways — where proxy-based observability fits alongside routing, caching and guardrails.
- Best LLM evaluation tools — the scoring layer that turns a trace into a diagnosis.
- Best LLM cost tracking and FinOps tools — the same spans, read for spend rather than quality.
- Best prompt management platforms — keeping the prompt version attached to every trace.
- Best OpenTelemetry-native observability platforms — where OTLP lands for the rest of your stack.
- Best APM tools for developers — the general observability map these LLM spans should join.