The first error you see in a new JavaScript monitoring tool usually looks like this: t is not a function, at main.a3f9b1.js:1:48213, in a stack of four frames all pointing at the same minified bundle. It is technically an error report. It is operationally useless.
Browser JavaScript is the hardest place in your stack to capture a useful error, and the reasons are all mechanical rather than philosophical. Your code is minified before a user ever runs it. It executes in a runtime you do not control, alongside extensions you did not install, behind ad blockers that cancel your requests, on browsers that report cross-origin failures as a three-word string with no stack at all. The tool’s job is to undo all of that, and the tools differ enormously in how well they do it.
So evaluate on the mechanics, not the feature grid. Every vendor below shows you a list of errors grouped by fingerprint with a chart above it. What separates them is how source maps get in, what the noise floor looks like after a week, how many kilobytes the SDK costs on a page you spent a sprint optimising, and what happens to the personal data that arrives attached to a session replay.
Key takeaways
- A JavaScript error report is only as good as its source map, and source maps are matched by release identifier — a mismatched release gives you a fully ingested, fully unreadable stack.
Script error.is not a bug in your code. It is what the browser reports when a cross-origin script throws withoutAccess-Control-Allow-Originandcrossorigin="anonymous"on the script tag.- Browser extensions,
ResizeObserver loop limit exceededand ad-blocker-cancelled requests make up a large share of raw browser error volume and none of it is yours to fix.- Session replay makes an error debuggable and makes your error tool a processor of personal data. Those are the same feature.
Source maps decide whether the tool works at all
Everything else is secondary. A minified stack trace names a column offset in a bundle nobody can read; a source map turns it back into your file, your line, your variable names. How each tool ingests that map is the single biggest practical difference between them.
There are three ingestion paths and they fail differently.
Upload from CI. A build step pushes the .map files to the vendor with a release identifier, then deletes them from the deploy artifact. This is the correct answer and the one that breaks most often, because it is a separate step in a pipeline that people edit. The classic failure: someone adds a second build target, the upload step only covers the first, and half your errors go unsymbolicated with no alert anywhere.
Fetch from a public URL. The vendor’s servers read the //# sourceMappingURL comment and download the map from your origin. Nothing to configure, which is why it is popular, and it means your source maps are publicly readable by anyone who reads that comment. It also fails silently behind authentication, behind a WAF that blocks the vendor’s user agent, and on any deploy where the old bundle has already been purged from the CDN.
A bundler plugin. A Webpack, Vite, Rollup or Next.js plugin that generates the map, uploads it, and stamps the release identifier into the client SDK config in the same build. This is the path with the fewest moving parts because the same code decides both halves of the release ID, which is exactly where manual setups break.
The release ID is the whole game. The SDK reports release: "abc123"; the map was uploaded as release: "abc124" because someone used a timestamp on one side and a git SHA on the other. The event ingests fine. The stack stays minified. No error is logged, because from the vendor’s perspective nothing went wrong. Before you trust any of this, deploy a deliberate throw new Error("symbolication canary") behind a query parameter and confirm the stack resolves in production, not in a local dev build where maps are inline anyway.
One security rule with no exceptions: do not ship source maps to production browsers. sourceMappingURL pointing at a publicly fetchable .map hands your unminified source to anyone who opens devtools. Upload the maps to the vendor, then strip them from the deployed bundle — most bundler plugins do exactly this, and it is the main reason to prefer them.
Needs first-hand data: Ship a canary error on a real production deploy for each candidate tool and record the elapsed time from deploy to a fully symbolicated stack, plus whether the tool warns you at all when the release ID does not match an uploaded map. The warning behaviour matters more than the speed.
The browser noise floor nobody warns you about
Turn on a browser SDK with default settings and a meaningful fraction of what arrives is not your bug. Knowing the categories before you look saves you a week of chasing ghosts.
Script error. with no stack and no line number. This is the browser refusing to leak details from a script served on another origin. To get the real error you need two things together: Access-Control-Allow-Origin on the script response from your CDN, and crossorigin="anonymous" on the <script> tag. One without the other does nothing. Until both are in place, every error thrown by your own CDN-hosted bundle can arrive as three useless words.
Browser extensions. Extension content scripts run in your page and their exceptions surface through your global handlers. You will see stack frames with chrome-extension:// and moz-extension:// URLs, errors from password managers, translation add-ons and crypto wallets injecting into pages that never asked. A tool that lets you deny-list by frame URL handles this in one config line. A tool that only filters by message string does not.
ResizeObserver loop limit exceeded and ResizeObserver loop completed with undelivered notifications. Fired when a resize callback changes layout in a way that triggers another resize pass within the same frame. Sometimes it points at a real layout thrash bug worth fixing; far more often it is benign and fires thousands of times a day from a third-party widget. Either way, it is high-volume noise from an API used by nearly every component library.
Ad blockers and network failures. A blocked request produces a rejected fetch, which produces an unhandled rejection, which arrives as Failed to fetch or Load failed with a stack pointing at your API client. It is indistinguishable from a real outage at the SDK level. Blockers also filter the error SDK’s own endpoint by domain, which means your error volume is systematically undercounted in exactly the segment of users most likely to have a broken page — worth knowing before you treat the graph as absolute truth.
Unhandled promise rejections. Every serious browser SDK hooks unhandledrejection as well as window.onerror, but the quality varies sharply. A rejection with a non-Error value — Promise.reject("nope"), or a rejected axios response object — has no stack at all, so grouping falls back on the message and you get one enormous bucket labelled Non-Error promise rejection captured. Reject with Error objects in your own code and this problem mostly disappears.
The practical consequence: budget the first two weeks of any rollout for filtering, and pick a tool whose ingest-side filtering is real. Client-side filtering saves the network request and the quota; server-side filtering only saves your inbox.
The costs people underestimate
SDK bundle size. A full-featured browser SDK with tracing, replay and profiling is one of the larger third-party dependencies on the page, and it loads on a page you optimised to hit a Core Web Vitals target. The gap between a minimal error-only build and the everything build is large enough to change a Lighthouse score. Check whether the vendor ships a tree-shakeable modular build or a single bundle, and whether replay loads lazily after first paint.
Session replay and personal data. Replay is what turns “cannot reproduce” into a fix, and it does that by recording the DOM — which contains names, addresses, order values and whatever else your form fields hold. Every vendor offers masking, most default to masking inputs, and none of them can know that your <div class="summary"> contains a full billing address. Masking is a configuration you own and must audit, and replay data almost always needs to be named in your privacy documentation. Related capture surface for the performance side of the same SDK is covered in the RUM tools roundup.
Needs first-hand data: Build your production bundle three ways for each candidate SDK — no SDK, error-only build, and the full build with tracing and replay enabled — and record the gzipped and Brotli-compressed transfer size delta plus the change in Largest Contentful Paint on a throttled connection. The marketing pages quote a minified size that does not include what tree shaking cannot remove.
Where Node errors belong. Server-side JavaScript is a different problem with the same language. Node errors have real stack traces without source maps in most setups, no browser noise, no ad blockers and no per-user replay — but they do need request context, async context propagation across await boundaries, and grouping that survives a stack trace passing through your framework’s middleware. Most vendors here cover both. Keep them in the same project only if you genuinely triage them together; otherwise separate projects keep the browser noise floor out of your backend alerts.
Sentry
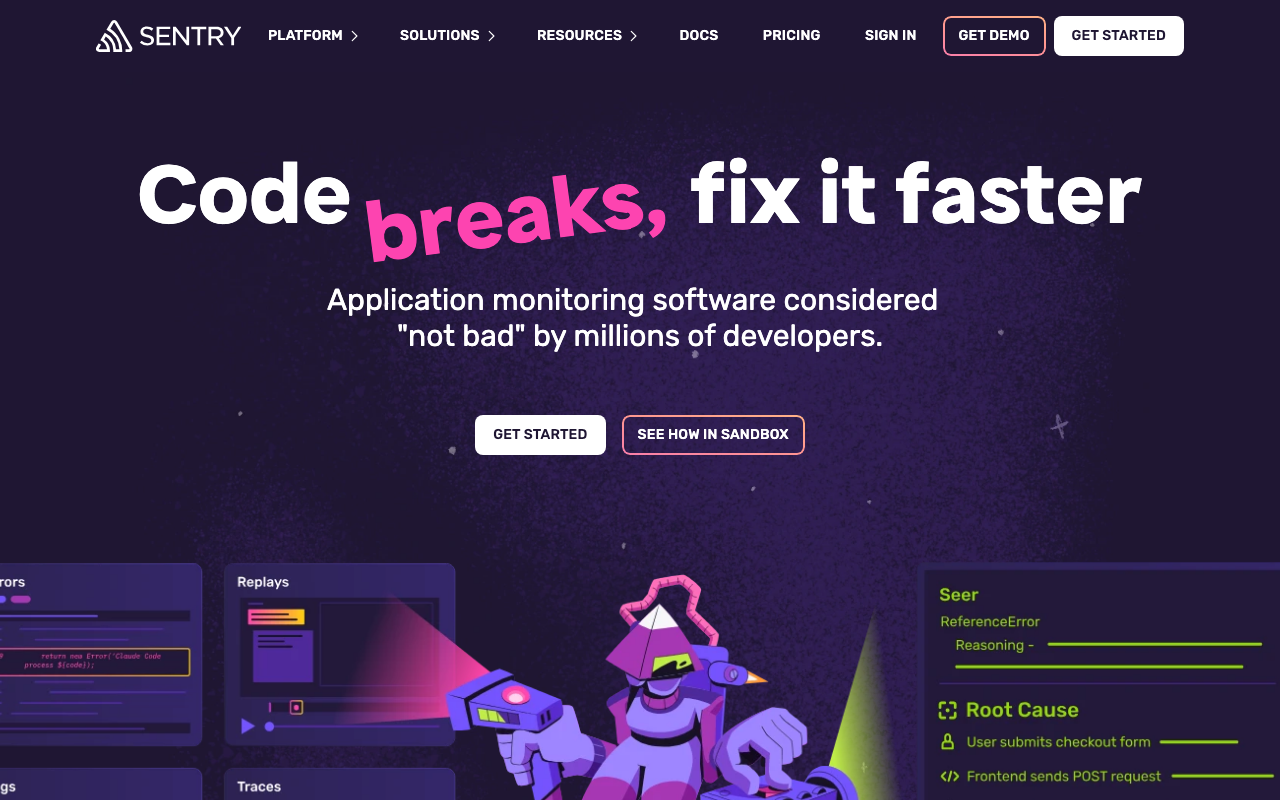
Sentry is the default for JavaScript error monitoring, and the reason is the release and source map tooling rather than the error list itself. Bundler plugins for Webpack, Vite, Rollup, esbuild and Next.js generate the map, upload it, inject the release ID into the client config and strip the map from the deploy in one step — which removes the mismatch failure that breaks hand-rolled setups. It also spans browser and Node with one account, adds tracing, replay and profiling as opt-in modules, and is open source with a self-hosted distribution for teams that cannot send browser data to a vendor.
Pros
- Bundler plugins make source map upload and release stamping the same operation, closing the most common symbolication failure
- Modular SDK: an error-only build is much smaller than the full bundle with tracing and replay
- Ingest-side filtering by frame URL handles browser-extension noise properly, not just by message string
- One product covers browser, Node, and the backend services the frontend calls
Cons
- The full-feature SDK is heavy for a performance-sensitive page, and the default install guides you toward it
- Pricing meters errors, replays, spans and profiles separately, so the browser noise floor costs money until you filter it
- Self-hosting is a genuine multi-service deployment, not a single container
Best for: Teams that want the source map pipeline to be a build plugin rather than a CI script they maintain by hand.
Pricing: Per-event quotas with separate meters for errors, session replays, traces and profiles, plus a free tier; self-hosting removes licence cost and adds real operational work.
Rollbar
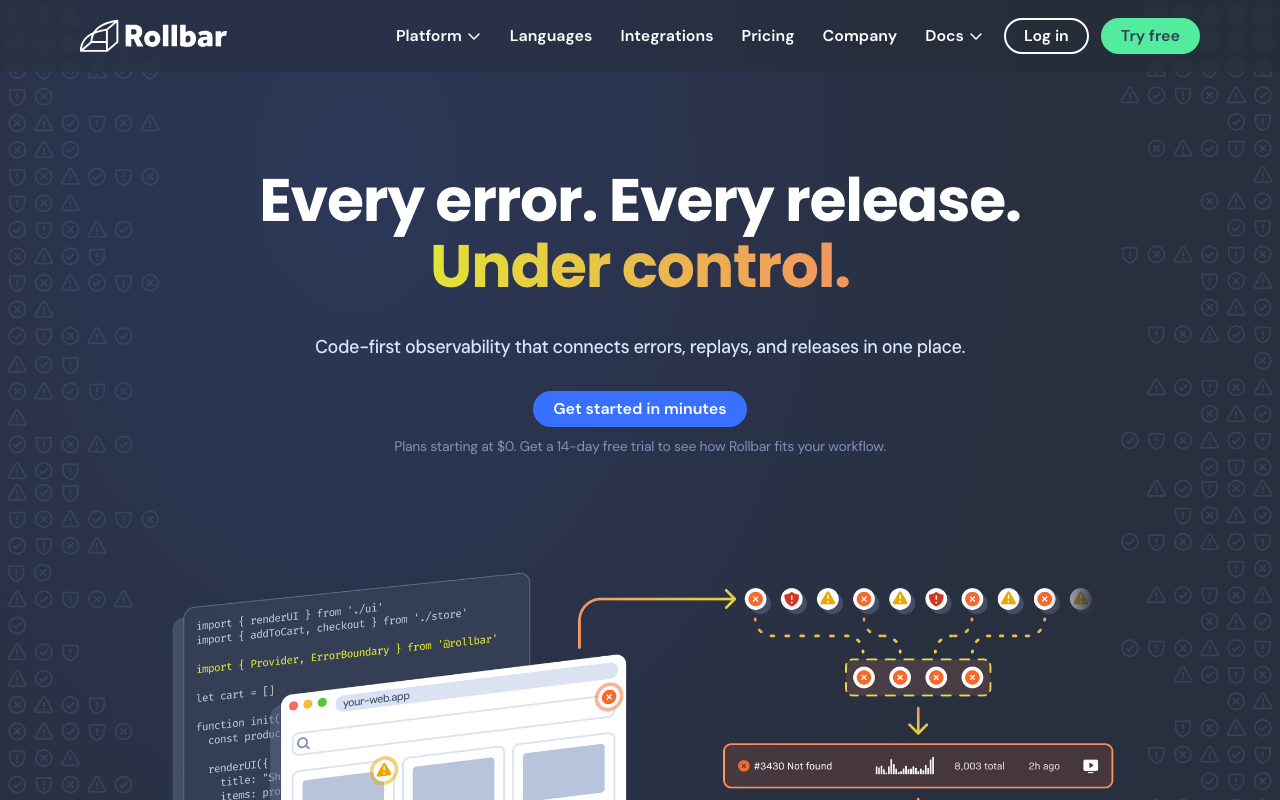
Rollbar is an error tracker that stayed one, and for frontend teams that is a feature: no replay module to argue about with legal, no tracing bill, no session data. Its grouping is more configurable than most — you can write rules that reshape fingerprints server-side, which matters when a shared helper throws the same TypeError from twelve call sites and default grouping collapses them into one unactionable bucket.
Pros
- Server-side grouping rules let you fix bad fingerprints without redeploying the SDK
- Deployment tracking ties an error’s first appearance to a specific release cleanly
- Focused product surface: no replay data to classify, no session recordings to retain
Cons
- No session replay, so browser-only bugs still need reproduction the hard way
- Source map handling is more CI-script than build-plugin, which is where mismatches come from
- Weaker as a general observability tool if you also want frontend performance in the same place
Best for: Frontend teams that want strict grouping control and deliberately do not want session recording in their data footprint.
Pricing: Tiered on monthly ingested events with retention by plan level, billed as a single meter rather than per feature.
BugSnag / SmartBear Insight Hub
BugSnag is now part of SmartBear Insight Hub, which matters for two reasons: the product is stable and well-engineered, and its roadmap now answers to a larger testing-and-quality portfolio rather than to frontend developers directly. Its distinguishing idea is stability-centric — a per-release, per-user “stability score” that answers “is this release worse than the last one” instead of “how many events fired.” That framing is more useful than raw counts for a release-gating decision, because event volume moves with traffic and stability does not.
Pros
- Stability score per release makes ship or roll back a numeric decision rather than an argument
- Long-standing, mature browser SDK with careful handling of unhandled rejections and breadcrumbs
- Same model spans web and mobile, which suits teams shipping both from one org
Cons
- Now inside a large quality-tooling portfolio, so independent frontend-first direction is not a given
- No first-party session replay depth comparable to the replay-led tools here
- Enterprise sales motion is heavier than the self-serve options in this list
Best for: Teams that gate releases on a stability metric and ship both a web app and mobile apps from the same organisation.
Pricing: Per-event tiers with enterprise contracts above the self-serve plans; feature availability differs by tier rather than by separate meters.
TrackJS
TrackJS is the narrowest tool here and the most opinionated about the browser specifically. It does client-side JavaScript errors, a telemetry timeline of console, network and navigation events leading up to the throw, and very little else — no APM, no tracing, no replay. The SDK is small, which is the point for a marketing site or a checkout page where every kilobyte on the critical path is contested.
Pros
- Small SDK footprint, which is a real advantage on a page with a performance budget
- Telemetry timeline gives the console and network sequence before the error without recording the DOM
- Browser-first defaults mean less time spent silencing noise that a full-stack tool ships enabled
Cons
- Narrow scope: no tracing, no replay, and backend coverage is not the strength
- Smaller ecosystem, so fewer framework-specific integrations than the larger vendors
- If you also need server error tracking, you are buying a second tool
Best for: Teams whose entire problem is browser JavaScript on a page with a strict performance budget and no appetite for session recording.
Pricing: Tiered on monthly error volume with a per-domain or per-application model, sold as one meter with no separate feature charges.
LogRocket
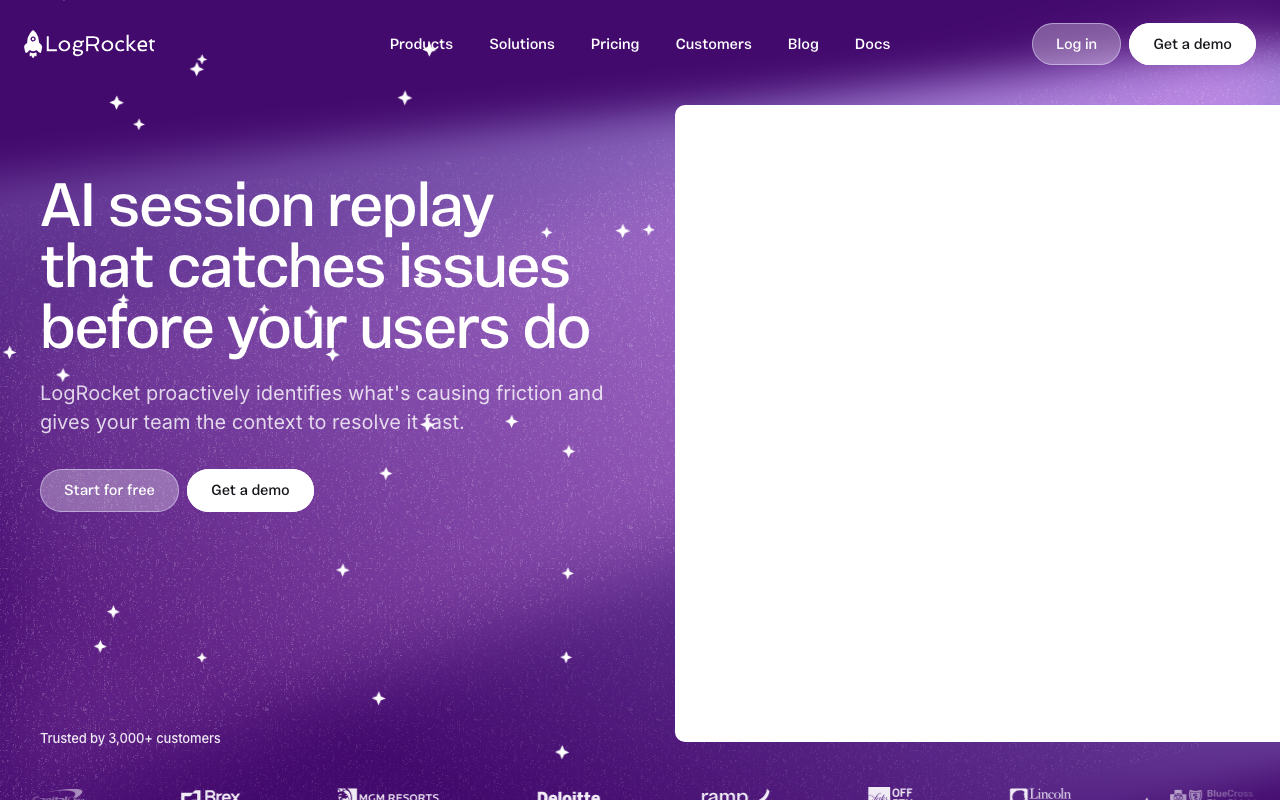
LogRocket approaches errors from the replay side: it records the session, the network requests, the Redux or state-store actions and the console, then surfaces errors as events within that recording. For a bug that only reproduces in a specific state, this is the fastest path to a fix that exists — you watch what the user did. The cost is that you are recording sessions by default, which is a much bigger data-governance conversation than an error tracker.
Pros
- State-store and network capture alongside the DOM recording makes state-dependent bugs reproducible
- Error triage happens with the user’s actual path already attached, no reproduction step required
- Strong for product and support teams as well as engineers, which spreads the cost across budgets
Cons
- Session recording is the default posture, so masking configuration and privacy review are mandatory, not optional
- The SDK is on the heavier end because it is recording continuously rather than only on error
- Pricing tracks sessions rather than errors, so cost scales with traffic even when nothing is broken
Best for: Product teams debugging state-dependent frontend bugs where watching the session is faster than reading a stack.
Pricing: Session-volume based tiers with retention by plan, so cost tracks user traffic rather than error count.
Highlight.io
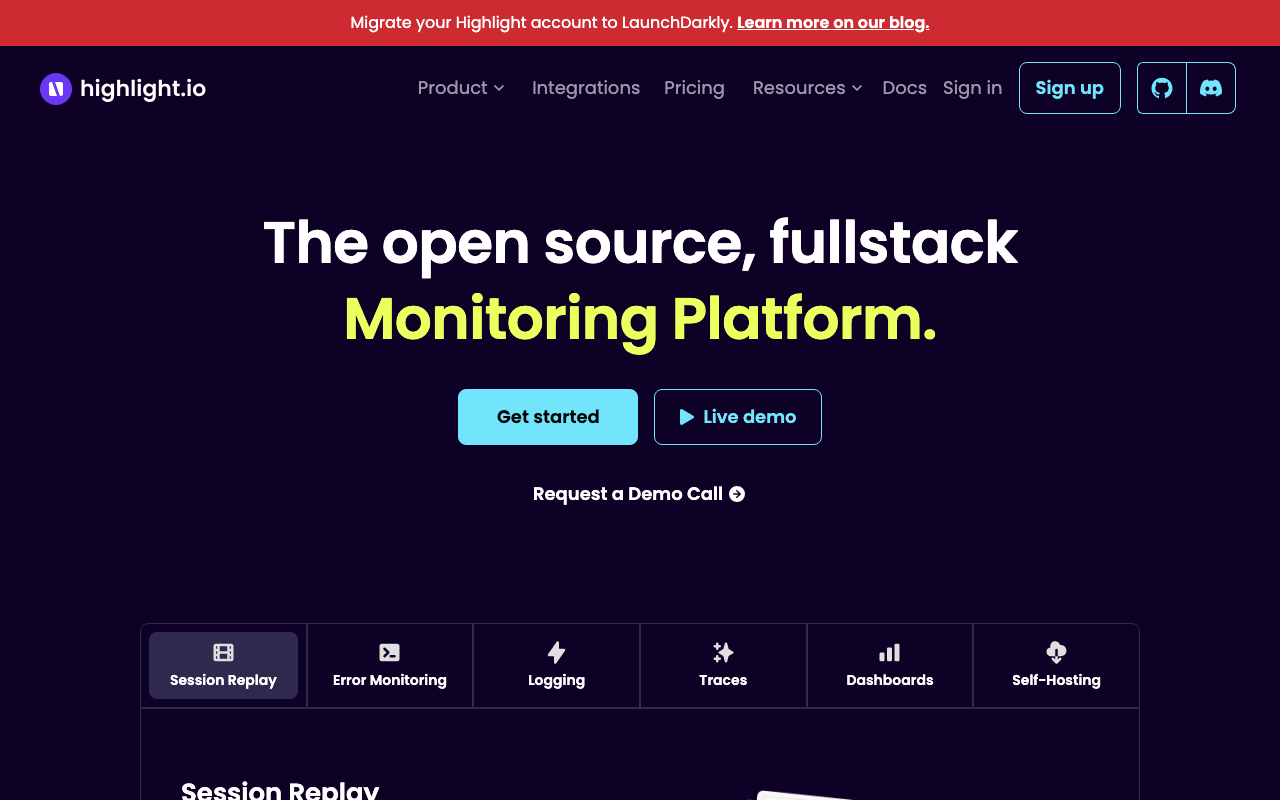
Read the status before the features: the hosted Highlight.io service was deprecated on February 28, 2026 and the product now lives inside LaunchDarkly Observability, with existing SDK snippets required to move to the LaunchDarkly client before March 1, 2026. The open-source project continues in the open, so today Highlight.io is a self-host option rather than a SaaS one. What it offers in that form is genuinely rare: session replay, errors and logs in one open-source stack you run yourself, which is the only way some teams can have replay at all.
Pros
- Open-source session replay plus error monitoring in one deployment, with no third party holding recordings
- Self-hosting answers the replay privacy objection more completely than any masking configuration can
- Errors, replay and logs share a data model, so an error links to the session without a separate integration
Cons
- The hosted service is deprecated; choosing this now means committing to self-hosting or to LaunchDarkly’s product
- Running replay storage yourself is meaningful infrastructure, since recordings are large and constant
- Smaller ecosystem than the incumbent vendors, with fewer framework integrations
Best for: Teams that need session replay attached to errors but cannot send session recordings to a third party.
Pricing: Open source and self-hostable at infrastructure cost; the hosted commercial path now runs through LaunchDarkly Observability rather than a standalone plan.
Raygun

Raygun pairs crash reporting with real user monitoring in one product, and for frontend teams that pairing is the reason to look. The same SDK that reports the exception reports the page’s load timings, so “this release got slower” and “this release started throwing” are answered from one dataset rather than two tools nobody correlates. It covers web, mobile and server from one account.
Pros
- Error reporting and RUM from one SDK, so performance regressions and error spikes share a timeline
- Covers browser, mobile and backend in one product without separate contracts
- Straightforward source map upload with a clear release model
Cons
- Less depth than the specialists at either end: not as configurable as Rollbar on grouping, not as rich as LogRocket on replay
- The combined SDK is larger than an error-only build
- Smaller integration ecosystem than the largest vendors
Best for: Teams that want frontend errors and real user performance in one product rather than correlating two.
Pricing: Volume-based on errors and RUM sessions as separate meters, with plan tiers controlling retention.
Datadog

Datadog’s browser error tracking is part of RUM, which is the right way to think about it: you are buying frontend monitoring and getting error grouping inside it. The advantage is genuine end-to-end correlation — a browser error links to the trace of the backend request that failed, in a platform that already holds your server logs and infrastructure metrics. If Datadog is already your backend, that connection is worth more than any single frontend feature.
Pros
- Browser error connects to the backend trace and logs for the same request without any correlation work
- One platform for frontend, backend, infrastructure and logs, so no context switch during an incident
- Session replay is available in the same SDK for teams already inside the platform
Cons
- Frontend error tracking is a module of RUM, priced per session, which is expensive if errors are all you want
- The browser SDK is large relative to an error-only tool, and RUM plus replay is larger still
- Multiple meters — RUM sessions, replay, logs, traces — make the bill hard to predict as traffic grows
Best for: Teams already running Datadog on the backend who want browser errors joined to server traces without building the join.
Pricing: Per RUM session with session replay as a separate meter, on top of whatever the rest of the platform costs; annual commitments discount the rate.
FullStory

FullStory is a digital experience product first and an error tool second, and it is worth knowing that before evaluating. It captures sessions comprehensively and retroactively, so you can search for behavioural patterns after the fact rather than instrumenting for them in advance — including JavaScript errors as one signal among rage clicks, dead clicks and abandoned flows. Engineering teams rarely buy this; product and UX teams frequently already have it.
Pros
- Retroactive search over captured sessions answers questions you did not instrument for in advance
- Errors sit next to behavioural signals, so you see the frustration the error caused rather than just the throw
- Often already licensed by the product team, making it free at the margin for engineering
Cons
- Not an error tracker: grouping, release tracking and source map handling are not the centre of the product
- Comprehensive capture is the largest privacy footprint in this list and needs proper masking review
- Priced for the product-analytics buyer, which makes it poor value if errors are the only requirement
Best for: Product-led teams that already run FullStory and want frontend errors in the same session context as user behaviour.
Pricing: Session-volume based plans aimed at a digital experience budget rather than an engineering error-tracking budget.
GlitchTip
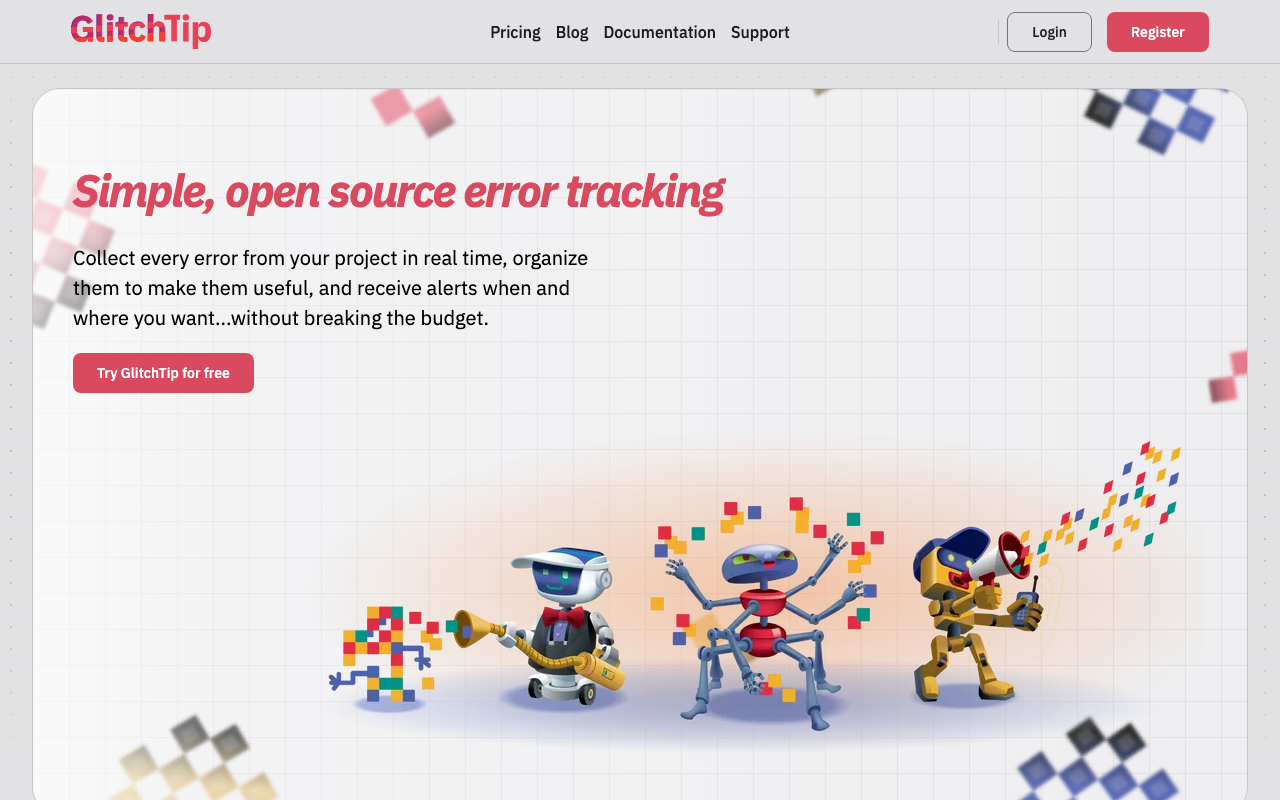
GlitchTip is an open-source error tracker that speaks the Sentry event protocol, so most Sentry SDKs point at it by changing the DSN — including the browser SDK. For a JavaScript team that means keeping the mature Sentry browser client and its bundler plugins while the events land in a server you run. It is deliberately much smaller in scope than Sentry: errors and uptime checks, not tracing, not replay, not profiling.
Pros
- Works with existing Sentry browser SDKs and bundler plugins by changing the DSN, so the instrumentation is not throwaway
- Self-hosted, so browser event data including breadcrumbs never leaves your infrastructure
- Small enough to run on modest infrastructure, unlike a full self-hosted Sentry
Cons
- Errors only: no session replay, no tracing, no profiling, so the hard browser bugs still need manual reproduction
- Feature parity with the Sentry UI is partial and lags the upstream product
- You own upgrades, storage growth and availability of a system your alerting depends on
Best for: Small teams that want Sentry-compatible browser error tracking on their own infrastructure without operating full Sentry.
Pricing: Open source and free to self-host at infrastructure cost, with a hosted plan priced on event volume.
How to choose
Answer these in order and most of the list eliminates itself.
Can you get source maps uploaded reliably from your build? If your build pipeline is one place and owned by one team, any of these work. If you have several build targets, micro-frontends, or a deploy path that gets edited by people who do not know the monitoring tool exists, choose on the strength of the bundler plugin — that is the difference between symbolication being automatic and being a recurring incident.
Do you need session replay, and can you have it? Replay is the fastest fix for state-dependent browser bugs and the biggest privacy commitment in this category. If legal will not approve a third party holding DOM recordings, the shortlist is self-hosted: Highlight.io or nothing. If replay is out entirely, the specialists — Rollbar, TrackJS, GlitchTip, or Honeybadger if you also want backend coverage — are better value than a platform whose replay you will never enable.
Is the frontend your whole problem, or one end of it? If browser errors need to join backend traces, buy the platform you already run on the backend. If the browser is the problem, buy the tool that is small on the page and quiet by default.
| Tool | Shape | Replay | Picks itself when |
|---|---|---|---|
| Sentry | Errors plus optional tracing and replay | Yes | The source map pipeline must be a build plugin |
| Rollbar | Errors only | No | Grouping needs server-side rules you control |
| BugSnag / Insight Hub | Errors, stability scoring | No | Releases are gated on a stability number |
| TrackJS | Browser errors only | No | Bundle size on the critical path is contested |
| LogRocket | Replay-led | Yes | Bugs are state-dependent and hard to reproduce |
| Highlight.io | Open-source replay plus errors | Yes | Replay is required and must be self-hosted |
| Raygun | Errors plus RUM | No | Performance and errors should share one timeline |
| Datadog | RUM module | Yes | Datadog already holds the backend traces |
| FullStory | Digital experience | Yes | Product already owns the tool and the budget |
| GlitchTip | Self-hosted, Sentry-compatible | No | Sentry SDKs, your own servers, small footprint |
Whichever you pick, treat the first two weeks as a filtering project. The error list on day one is not a bug backlog; it is the browser noise floor with your bugs mixed in. For the wider category including backend languages, see the error tracking hub.
Frequently asked questions
Why do my JavaScript errors say “Script error.” with no stack trace?
The browser is refusing to reveal details of an exception thrown by a script served from a different origin than the page. Fix it by serving your bundle with an Access-Control-Allow-Origin header and adding crossorigin="anonymous" to the <script> tag. Both are required — either one alone leaves you with the same three words.
Should I upload source maps or host them publicly?
Upload them to the vendor from your build and strip them from the deployed bundle. Publicly hosted maps mean anyone can read your unminified source, and they also break whenever a bundle is purged from the CDN before the error is processed. A bundler plugin that uploads and strips in the same step is the lowest-maintenance version of this.
Do I need session replay to debug frontend errors?
No, but it changes which bugs are economically worth fixing. Breadcrumbs — the console, network and navigation events before the throw — solve most cases. Replay earns its place on bugs that depend on a specific UI state you cannot reproduce, and it brings a privacy and retention obligation that breadcrumbs do not.
Should browser and Node errors go in the same project?
Only if the same people triage both. Browser error volume is dominated by extensions, blocked requests and cross-origin noise, and mixing that into a backend project means your server alerts inherit a noise floor that has nothing to do with your servers. Separate projects, one tool, is the usual answer.
Related reading
- Best error tracking tools — the full category across languages and runtimes.
- Best RUM tools — the performance half of the same browser SDK.
- Best error tracking tools for Python — the server-side counterpart when your frontend calls a Python backend.
- Best error tracking tools for mobile apps — why native crash reporting is a different problem entirely.
- Best open source error tracking — self-hosted options when browser data cannot leave your infrastructure.
- Best incident management tools — where a frontend error spike goes once it is a real incident.