Python error tracking looks easy until the first async exception arrives. The stack has four frames, three of them belong to the event loop, and the one line of your code in there is await handler(request). You know something failed. You have no idea what.
That is the shape of the whole category. Capturing an unhandled exception in a synchronous Django view is a solved problem that every tool here does equally well — it is one middleware and a sys.excepthook. What separates the tools is everything around that: whether the integration understands ASGI well enough to reconstruct a useful traceback, whether a Celery task that fails on a worker with no request context still reports with the task name and arguments attached, whether the ORM query that raised IntegrityError shows up next to the exception, and whether the framework integration attaches the route and view function or leaves you with a URL string.
The second thing that decides this choice is a setting most teams find out about the wrong way. Python error trackers can capture the local variables in every stack frame, which is the single most useful debugging feature in this entire category — you see the exact value that was None — and also means the contents of a payment handler’s frame, card details and all, get shipped to a vendor and stored. That is one config flag, and you should decide about it deliberately rather than discover it in an audit.
Key takeaways
- WSGI capture is a solved problem; ASGI is where tools differ, because an exception inside a coroutine has a shallow traceback unless the integration reconstructs the async call chain.
- Celery task failures never reach a request handler, so without a task-level integration they show up with no context or not at all.
- Local variable capture in stack frames is the best debugging feature in Python error tracking and the biggest PII exposure. It is one setting, and it should be an explicit decision.
- A
ValueErrorraised from a shared helper groups into one bucket across every unrelated caller unless you override the fingerprint.
Where the exception is caught decides what you see
Every Python error tracker installs itself in the same three places, and the quality of each install is what you are actually buying.
The framework integration. Django gets a middleware plus signal handlers, Flask gets a got_request_exception hook, FastAPI and Starlette get ASGI middleware. This is what attaches the request context: URL, matched route pattern, view or endpoint function, headers, and often the ORM queries executed before the failure. The difference between an error report that says 500 on /api/orders/1841/ and one that says orders.views.OrderDetail.get raised IntegrityError after 4 queries, last query INSERT INTO order_items is entirely down to how good this integration is. Evaluate it on the framework you actually use, because coverage is uneven — Django integrations are universally mature and FastAPI integrations are not.
The logging handler. A handler attached to the root logger that forwards records at or above a threshold. This catches everything your code already handles with try/except and logs — which in a mature codebase is most of what actually goes wrong. It is also the fastest way to flood your quota, because logger.error() in a retry loop is an error report per attempt. Configure the level deliberately, and make sure the handler forwards exc_info so logger.exception() produces a real traceback rather than a string.
Explicit capture_exception. For the paths you handle and want to keep handling. Useful, underused, and the only way to report something you deliberately swallow.
Most teams install the framework integration, never touch the logging level, and then wonder why half their real failures never appear — because those failures were caught, logged and handled, and the logging handler’s threshold was set to CRITICAL.
WSGI, ASGI and the short async traceback
In a WSGI application the model is simple: one request, one thread, one call stack. When something raises, the traceback runs from your view up through the framework to the WSGI server, and everything in between is in that stack. Any error tracker gets this right.
ASGI breaks that assumption in a way that shows up directly in your error reports. A coroutine’s traceback contains only the frames of the current task. When you await something, the awaiting frame is preserved — but when work is dispatched into a separate task with asyncio.create_task, or run in a thread pool via run_in_executor or asyncio.to_thread, the new task’s stack starts fresh. An exception raised there produces a traceback that begins somewhere inside the event loop and shows nothing about the request that started it.
The consequences, in the order you will meet them:
- A background task started with
create_taskand never awaited. If it raises, the exception is stored on the task object and surfaces only when the task is garbage collected, as “Task exception was never retrieved” — usually long after the request that spawned it, with no request context attached. Without an asyncio integration this is invisible; with one it is at least reported. - Sync code inside an async framework. FastAPI runs a
defendpoint in a thread pool. The exception’s traceback is that worker thread’s stack, and connecting it back to the request depends on the integration propagating context across the thread boundary — which is contextvar work, not magic. - Exception groups.
asyncio.TaskGroupandexcept*raise anExceptionGroupcarrying several unrelated failures. A tracker that does not understand exception groups reports one error with a confusing message instead of the several distinct errors that actually happened. - Context loss across middleware. ASGI middleware ordering decides whether your error-tracking middleware is inside or outside the framework’s own exception handler. Install it outside and you catch things the framework would have turned into a 500 response; install it inside and you may catch nothing at all, because the framework already handled it.
Needs first-hand data: In one FastAPI service, raise the same exception four ways — from an async endpoint, from a
defendpoint, from a fire-and-forgetcreate_task, and from inside anasyncio.TaskGroup— and record for each candidate tool how many frames of your own code appear and whether the request context is attached. This is the single most decisive test for an async Python stack.
Celery is a separate product decision
Celery task failures are the errors that most often go unmonitored, because they happen on a worker process with no request, no user session and no HTTP status code to trip an alert.
A real Celery integration gives you three things a generic exception hook cannot: the task name and its arguments in the report, retry state so a task that failed on attempt three of five is distinguishable from one that gave up, and grouping by task rather than by whatever line of shared code raised. Without it, a requests.exceptions.ConnectionError from a task and the same error from a web request land in the same bucket and neither is actionable.
Two Celery-specific behaviours worth checking in whatever you pick. First, task arguments are captured as context — which means a task called with a user’s email or a full payload puts that data in your error tracker, subject to the same scrubbing rules as everything else. Second, whether a task that exhausts its retries reports once as a final failure or once per attempt. Per-attempt reporting is correct for debugging and expensive for quota, and the good tools let you choose.
The same reasoning applies to any non-request entry point: management commands, cron jobs, consumers reading from a queue. If the only integration you install is the web framework one, everything outside a request is dark.
Local variables, scrubbing, and the setting to decide on
Python’s traceback objects carry a reference to each frame, and each frame carries its locals. That is why Python error trackers can show you the value of every variable at every level of the stack at the moment of the failure — the argument that was None, the dict missing the key, the ID that was a string when the query wanted an integer. Nothing else in this category shortens debugging as much.
It is also, mechanically, an exfiltration path. The locals of a frame in a payment handler include the card token. The locals of an authentication view include the password that was just posted. The locals of a serializer include the entire request body. Every serious tool ships default scrubbing that redacts fields named like password, secret, token, api_key and similar, and that default catches the obvious cases and nothing else — it does not know your payload dict has a ssn key three levels down, and it does not know your local named d holds a decoded JWT.
Three decisions to make explicitly, before rollout rather than after:
- On or off. The flag exists in every tool with this feature. Turning it off costs you the best debugging signal Python offers. Leaving it on means the error tracker is processing personal data and belongs in your data map.
- Scrubbing scope. Extend the default deny-list with your own field names, and prefer a server-side scrubbing rule as well as the client-side one, so a service that missed the config update is still covered.
- Which services. It is entirely reasonable to run locals capture on the internal admin service and off in the payment path. This is per-project configuration, not an all-or-nothing choice.
Grouping, and the shared helper problem
The default fingerprint in most tools is roughly the exception type plus the top frames of the stack. That works well until you have a shared helper.
parse_amount() raises ValueError for bad input. It is called from the checkout view, the CSV importer, the webhook handler and a Celery task. Because the top of the stack is identical in all four cases, they group into one issue — which means a spike in the importer hides a new failure in checkout, and assigning the issue to a team is meaningless because four teams own the callers.
Every tool worth using lets you override this, either with an explicit fingerprint set at capture time or with a server-side rule that includes more of the stack in the hash. The difference is where the fix lives: a server-side rule can be applied to errors already reported, by whoever is triaging, without a deploy. A client-side fingerprint requires touching the code that raised. For a Python codebase full of shared utilities, the server-side option saves real time.
The inverse failure is worth naming too: over-splitting. If your fingerprint includes a frame with a dynamic value — a generated class name, a line number that moves every release — one bug becomes a hundred issues and nothing gets triaged. Grouping is a tuning exercise in both directions and a tool that does not let you tune it will annoy you within a month.
Profiling overhead in a synchronous worker
Most of these vendors now bundle a profiler alongside error tracking, and the overhead question is genuinely different in Python than elsewhere. A sampling profiler using sys.setprofile or a signal-based sampler runs in the same process as your request. In an async service with many concurrent requests per worker, the sampling cost is amortised. In a synchronous gunicorn worker handling one request at a time, that overhead lands on that request’s latency directly.
The practical guidance: enable profiling at a low sample rate first, measure the p99 of a real endpoint before and after, and treat any vendor default sample rate as a starting point rather than a recommendation. The APM side of this tradeoff is covered in more depth in APM for Python services.
Needs first-hand data: Run a synchronous gunicorn service under load with the vendor’s profiler off, at its default sample rate, and at a low rate, and record p99 latency and worker memory in each state. Repeat under an async worker to see how much of the cost is concurrency-model dependent.
Sentry
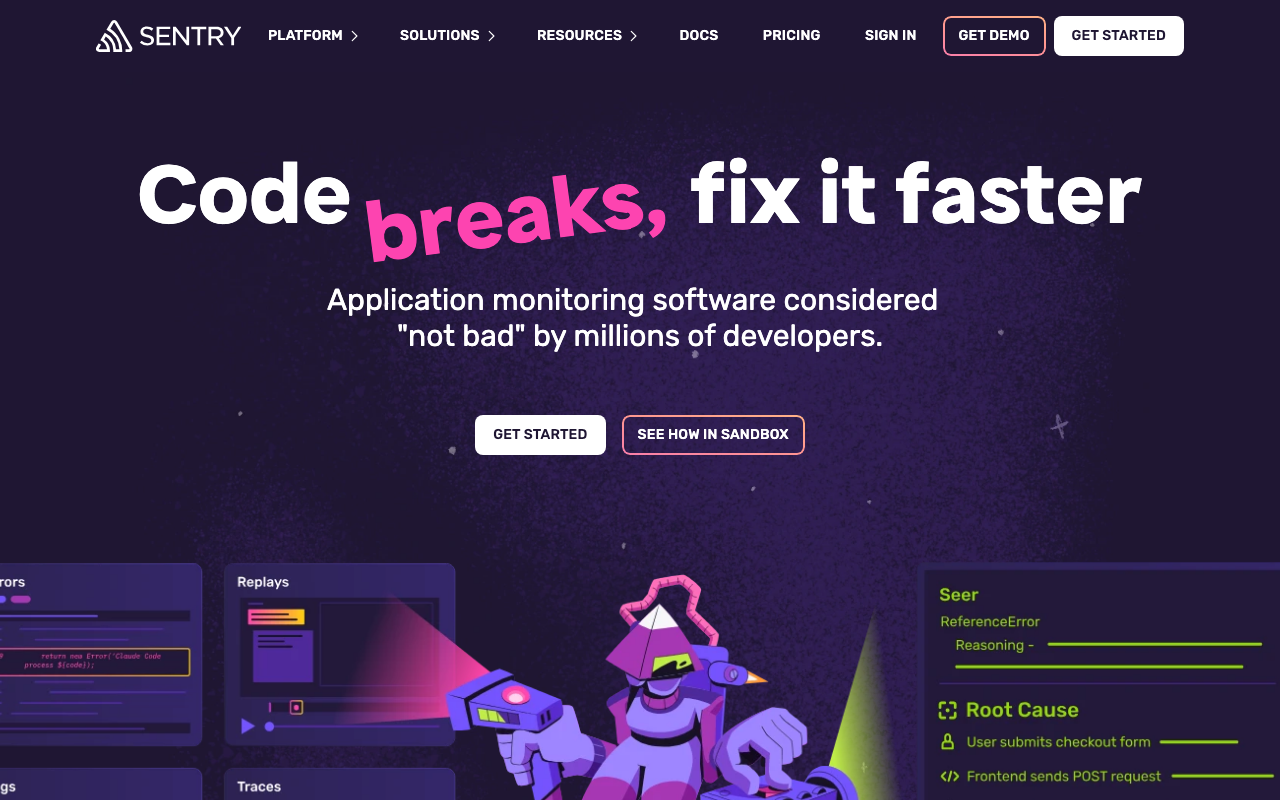
Sentry is the most complete Python error tracker and the reason is integration breadth: Django, Flask, FastAPI, Starlette, Celery, RQ, asyncio, logging, ASGI and WSGI middleware, plus database and HTTP client instrumentation that attaches queries and outbound calls as breadcrumbs. Local variable capture is on by default with server-side and client-side scrubbing available, and the same SDK carries tracing and profiling as opt-in modules. It is open source with a self-hosted distribution for teams that cannot send stack frames to a vendor.
Pros
- The widest and best-maintained set of Python framework and task-queue integrations, including asyncio and exception groups
- Local variable capture with both client-side and server-side scrubbing rules, so a missed config update is still covered
- Server-side fingerprint rules fix the shared-helper grouping problem without a deploy
- Self-hostable, which is the usual answer when locals capture makes a vendor unacceptable
Cons
- Separate meters for errors, traces, profiles and replays make the bill move in ways a logging handler misconfiguration can trigger
- The default configuration is generous about what it captures, which is a privacy footprint you have to actively trim
- Self-hosting is a multi-service deployment with real operational cost
Best for: Python teams on Django, FastAPI and Celery together who want one SDK that understands all three and can self-host if the data footprint demands it.
Pricing: Per-event quotas with independent meters for errors, traces, profiles and replays, plus a free tier; self-hosting removes licence cost and adds operations.
Rollbar
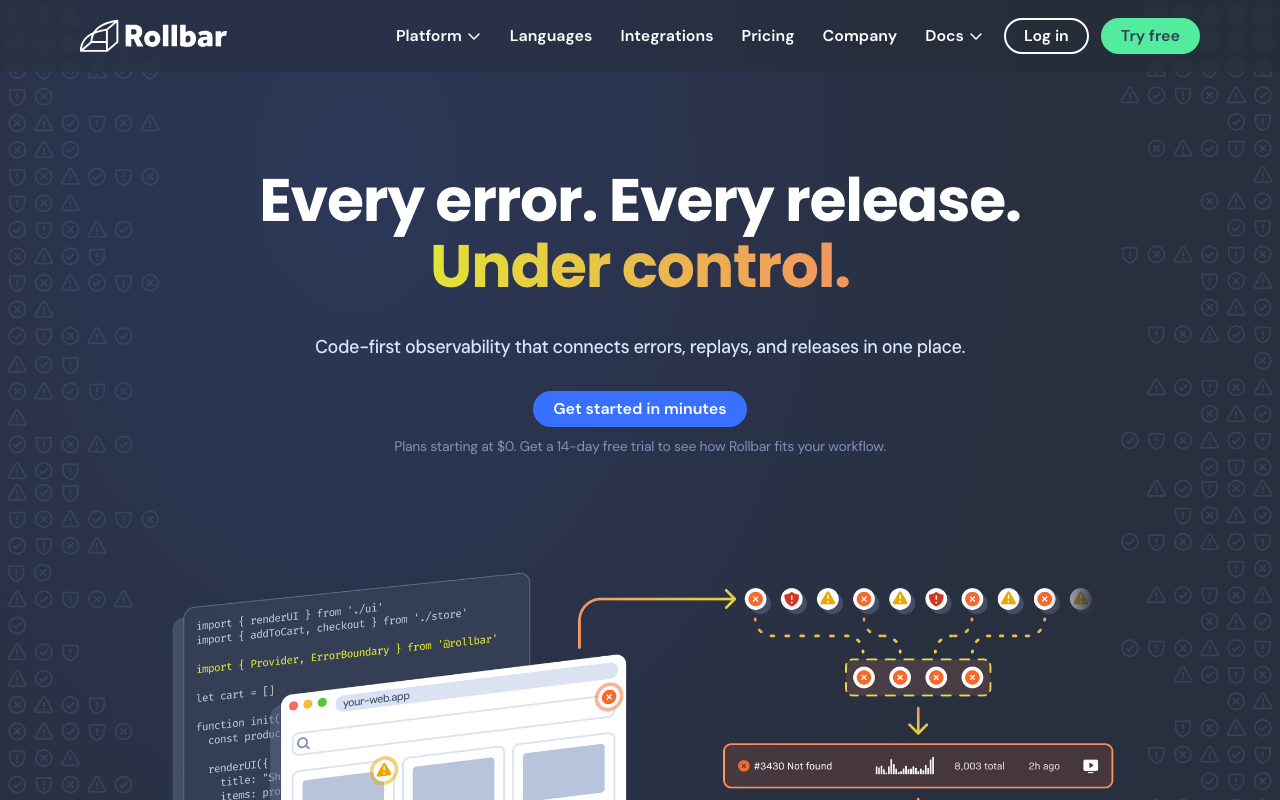
Rollbar is a focused error tracker with unusually strong grouping control, which is exactly the axis that matters in a Python codebase built on shared utilities. Fingerprint rules are server-side and rule-based, so a triager can split a bucket that collapsed four unrelated callers into one without asking anyone to ship code. Its Python SDK covers the major frameworks and Celery, and it stays out of the tracing and profiling business.
Pros
- Server-side grouping rules are the most direct fix for the
ValueError-from-a-shared-helper problem - Focused product: no tracing meter, no replay data, one thing metered
- Deployment tracking ties first-seen errors to a specific release cleanly
Cons
- Framework integration depth trails Sentry, particularly on newer ASGI frameworks
- Local variable capture and context are less rich than the leader, which is the main Python-specific advantage you give up
- No profiling or tracing, so a slow endpoint needs a second tool
Best for: Python teams whose main pain is grouping quality and who deliberately want error tracking without an observability platform attached.
Pricing: Tiered on monthly ingested events with retention by plan, billed as a single meter.
Honeybadger
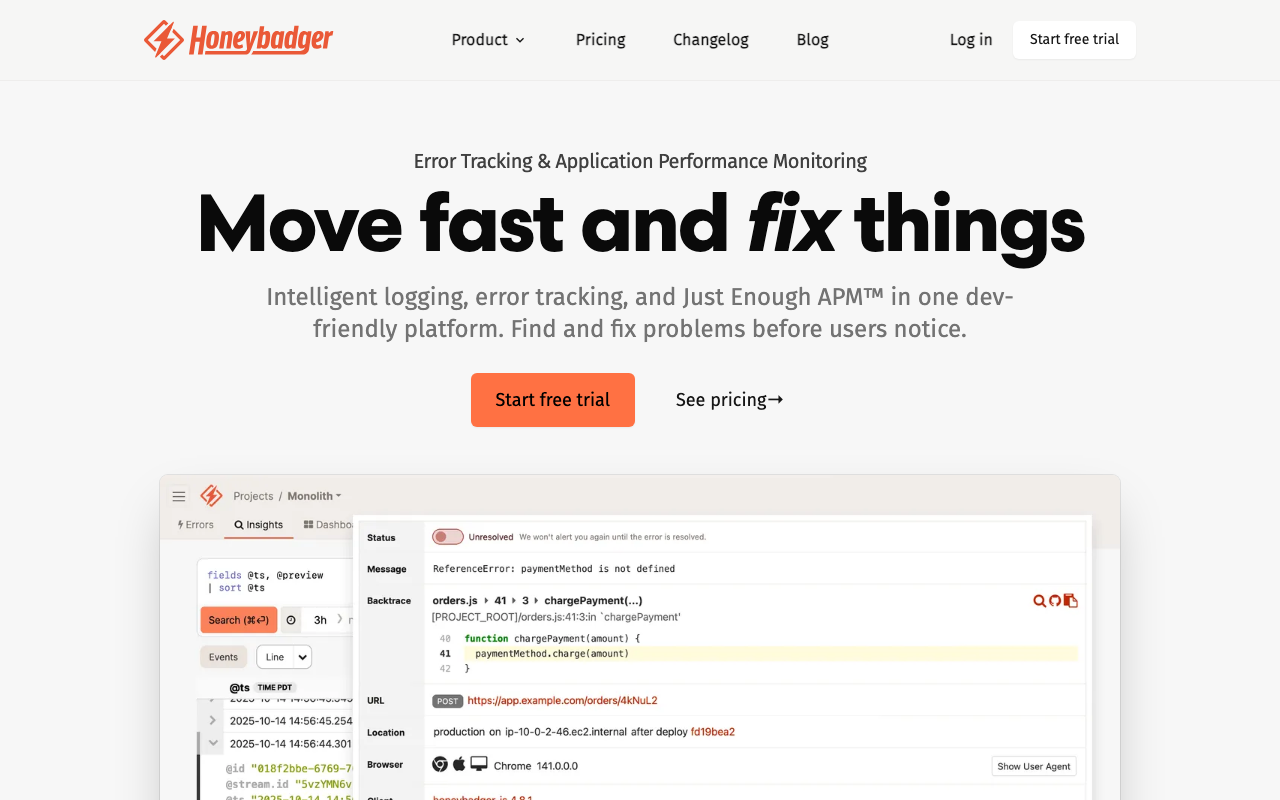
Honeybadger bundles error tracking, uptime monitoring and cron or background-job check-ins in one product, which fits the shape of a real Python service better than error tracking alone. The check-in feature is the underrated part: a Celery beat task that silently stops running produces no exception at all, and a dead man’s switch is the only thing that catches it. Its Python support covers Django, Flask and Celery with a small SDK and a deliberately simple UI.
Pros
- Cron and background job check-ins catch the failure mode error tracking structurally cannot — a scheduled task that stops running
- Errors, uptime and check-ins in one bill and one on-call destination
- Small, simple SDK and a UI that does not need training
Cons
- Python is not its primary ecosystem, and integration depth reflects that against Django-first competitors
- No tracing or profiling, so performance questions go elsewhere
- Less configurable grouping than Rollbar or Sentry
Best for: Small Python teams that want errors, uptime and dead-man’s-switch monitoring for scheduled jobs in one tool.
Pricing: Flat plan tiers by project and event volume including uptime and check-ins, rather than separate meters per feature.
AppSignal
AppSignal combines error tracking, performance monitoring, host metrics and dashboards in one agent with one price, aimed squarely at teams who do not want to assemble a stack. For Python that means an exception report and the endpoint’s latency history come from the same place, and the pricing is one meter rather than four. Its heritage is the Ruby ecosystem, so Python is a newer surface, but the product philosophy — one bill, opinionated defaults, no configuration project — is genuinely different from the platform vendors.
Pros
- Errors, performance and host metrics in one agent and one predictable bill
- Opinionated defaults mean a working setup quickly, with little tuning
- Anomaly detection and alerting are included rather than a separate product
Cons
- Python integration depth is behind the Ruby-first heritage of the product
- Smaller ecosystem and fewer third-party integrations than the large vendors
- Not the tool for deep async or Celery-heavy architectures where integration nuance decides the outcome
Best for: Small Python teams that want errors and performance monitoring in one product with a single, predictable meter.
Pricing: Per-request or per-event plan tiers covering errors, performance and metrics together rather than separately metered features.
Airbrake
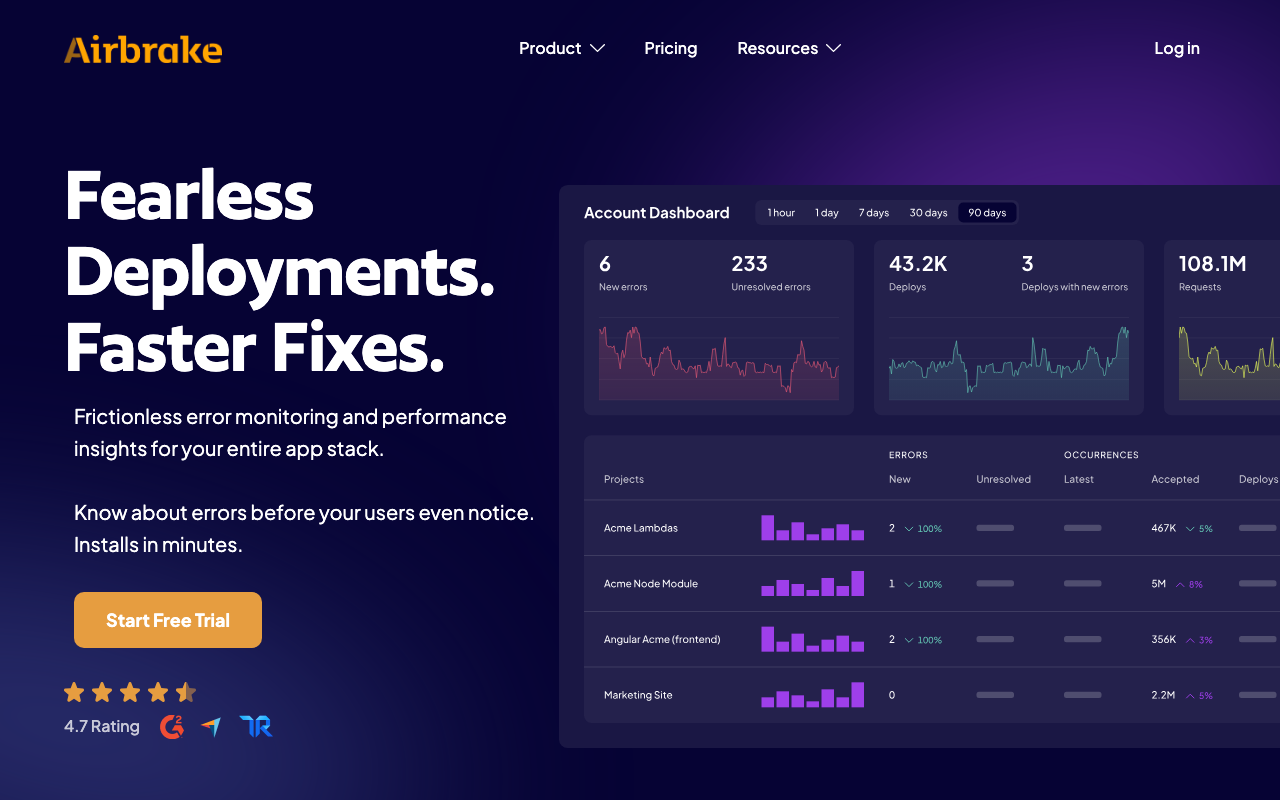
Airbrake is one of the oldest error trackers still running and its Python offering is straightforward: capture exceptions, attach request context, group, notify. It is a reasonable choice when the requirement really is exception capture and notification, and its age means the integration surface is stable and well documented rather than fast-moving.
Pros
- Mature, stable product with a long track record of doing one job
- Simple deployment tracking and notification routing with little setup
- Lightweight footprint with no platform ambitions attached
Cons
- Modern async Python — ASGI frameworks, TaskGroups, exception groups — is not where its depth is
- Feature velocity is low compared with the leaders in this list
- Weaker grouping controls when the shared-helper problem appears
Best for: Teams running established synchronous Python services that want dependable exception capture without a platform.
Pricing: Tiered by monthly error volume and project count, sold as a single meter.
GlitchTip
GlitchTip is an open-source error tracker that speaks the Sentry event protocol, so the Sentry Python SDK reports to it by changing the DSN. For Python that is a strong position: you keep the best-integrated SDK in the ecosystem — Django, Celery, FastAPI, logging integrations included — while the events, stack frames and captured locals land on a server you run. Scope is deliberately narrow: errors and uptime checks, no tracing, no profiling.
Pros
- Uses the Sentry Python SDK, so the integration depth that matters most in Python comes free
- Self-hosted, which is the cleanest answer to local variable capture leaving your network
- Modest infrastructure requirements compared with self-hosted Sentry
Cons
- Errors only: no tracing or profiling, so performance work needs another tool
- UI and feature parity with upstream Sentry is partial and lags
- You own upgrades, storage growth and the availability of a system your alerting depends on
Best for: Python teams that want Sentry SDK integrations with the data stored on their own infrastructure and a small operational footprint.
Pricing: Open source and free to self-host at infrastructure cost, with a hosted plan metered on events.
Bugsink
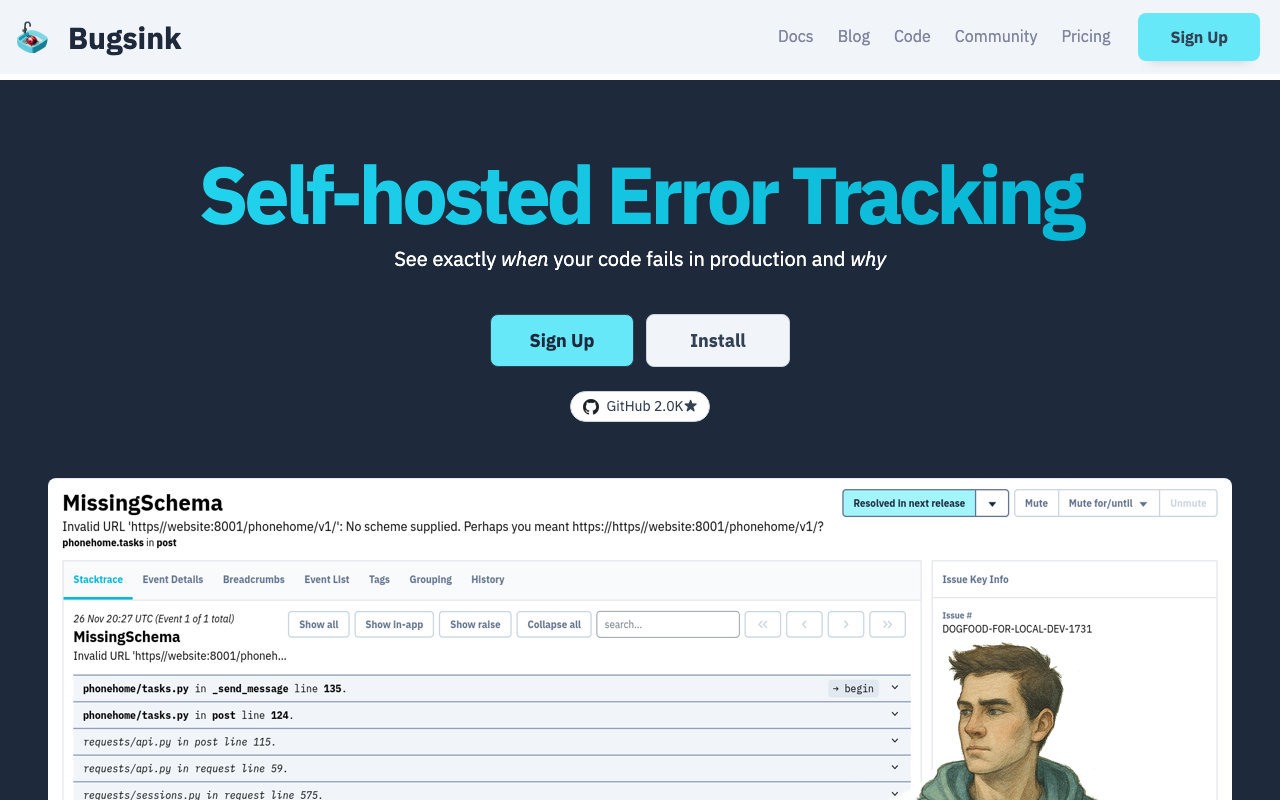
Bugsink is a self-hosted error tracker built around the Sentry event protocol with an explicit focus on being simple to run — a single application with a conventional database, rather than a distributed system. That framing matters for a Python team: the reason most teams give up on self-hosted error tracking is operational weight, and a tool designed to be one process on one box removes that objection.
Pros
- Deliberately simple to deploy and operate, which is the actual blocker for self-hosting error tracking
- Accepts events from standard Sentry SDKs, so Python integration quality is inherited
- All event data, including captured local variables, stays on infrastructure you control
Cons
- Small project with a correspondingly small ecosystem and support surface
- Scope is error tracking only, with none of the surrounding platform
- Scaling and retention are your problem, and error volume is spiky by nature
Best for: Teams that want Sentry-protocol error tracking self-hosted with the least possible operational surface.
Pricing: Self-hosted with a licence model for commercial use rather than a per-event meter; the running cost is one server.
Datadog

Datadog’s Error Tracking is a view over errors already flowing through APM and logs, which is the right mental model: you are not buying an error tracker, you are getting error grouping inside a platform that already has your traces, logs and infrastructure metrics. For a Python service that means the exception, the slow query before it, and the host that was out of memory are one click apart. If Datadog is already your platform, adding a second error tool is usually the wrong move.
Pros
- Errors, traces, logs and infrastructure metrics correlate without any integration work
- Celery, Django, Flask and FastAPI instrumentation comes from the same agent already deployed
- Continuous profiler links to the failing span, which error trackers alone cannot do
Cons
- Error tracking is not a standalone purchase, so it only makes sense if you are buying the platform
- Multiple meters — hosts, spans, logs, profiles — make cost hard to predict as services multiply
- Local variable capture depth is not the strength that dedicated Python error trackers offer
Best for: Python teams already running Datadog APM who want error grouping joined to traces and logs rather than a separate tool.
Pricing: Per-host APM subscription with separate meters for indexed spans, log ingest and retention, and profiling; error tracking rides on those.
New Relic
New Relic’s errors inbox is the same shape of bet as Datadog’s — errors inside an observability platform rather than beside it — with a materially different commercial model. New Relic prices on data ingested plus users rather than per host, which changes the arithmetic for a Python fleet of many small services: a hundred containers do not cost a hundred host licences. Its Python agent covers the major frameworks and Celery, and the errors inbox groups and assigns them alongside everything else in the platform.
Pros
- Ingest-plus-users pricing suits fleets of many small Python services better than per-host models
- Errors sit next to traces, logs and infrastructure with no correlation work
- Generous free tier makes evaluation genuinely cheap
Cons
- Buying the platform to get an errors inbox is poor value if error tracking is all you need
- Per-user pricing above the free tier penalises wide read access across engineering
- Python-specific error context is shallower than a dedicated tracker’s local variable capture
Best for: Python teams running many small services who want errors inside an observability platform without per-host pricing.
Pricing: Metered on data ingested with per-user charges above a free allowance, rather than per host.
Elastic APM

Elastic APM captures Python exceptions into the same Elasticsearch cluster that holds your logs, which is a specific and defensible architecture: one query language over errors and logs, self-hostable end to end, no per-host vendor meter. For teams that already run Elasticsearch this is close to free at the margin. For teams that do not, the cost is that you now operate Elasticsearch, which is not a small commitment.
Pros
- Errors and logs in one cluster and one query language, so an exception and its surrounding log lines are one search
- Fully self-hostable, keeping stack frames and captured context inside your network
- No per-host licensing model, so scaling out Python workers does not multiply a licence count
Cons
- Operating Elasticsearch at production scale is real, ongoing work with its own on-call
- The error-triage workflow is thinner than a dedicated error tracker’s: assignment, regression detection and grouping rules are not the focus
- Python agent breadth is narrower than the dedicated tools on task queues and async frameworks
Best for: Teams already running Elasticsearch who want Python errors in the same cluster as their logs without a new vendor.
Pricing: Open-source and self-managed at infrastructure cost, or a managed cloud metered on resource size and retention rather than per host.
How to choose
Three questions decide this, and they are about your architecture, not the feature grid.
What runs your code? If it is Django plus Celery, integration maturity is the whole decision and the mature options are obvious. If it is FastAPI with background tasks and TaskGroups, test the async traceback quality yourself before committing — this is where tools differ most and where marketing pages say least.
Can captured local variables leave your network? If not, the shortlist is self-hosted: GlitchTip, Bugsink, self-hosted Sentry, or Elastic. If yes, you have the whole field, and you still owe your privacy documentation an entry.
Are you buying a tool or a platform? If your team already runs Datadog, New Relic or Elastic, a second error product duplicates data and splits triage. If you do not, buying an observability platform to get an error inbox is expensive and slow.
| Tool | Shape | Self-host | Picks itself when |
|---|---|---|---|
| Sentry | Errors plus optional tracing and profiling | Yes | Django, Celery and FastAPI all need to work well |
| Rollbar | Errors only | No | Grouping rules are the pain point |
| Honeybadger | Errors, uptime, job check-ins | No | Scheduled jobs failing silently is the real risk |
| AppSignal | Errors plus performance, one meter | No | You want one predictable bill and no tuning |
| Airbrake | Errors only | No | Stable synchronous services, dependable capture |
| GlitchTip | Sentry-protocol errors | Yes | Sentry SDK depth, your own servers |
| Bugsink | Sentry-protocol errors | Yes | Self-hosting must be one simple process |
| Datadog | Platform module | No | Datadog already holds traces and logs |
| New Relic | Platform module | No | Many small services, per-host pricing hurts |
| Elastic APM | Platform module | Yes | Elasticsearch is already running |
Whichever you choose, do the two configuration steps everyone skips: set the logging handler threshold deliberately, and decide about local variable capture per service rather than globally. Those two settings determine both your quota bill and your privacy exposure. The broader category is covered in the error tracking hub.
Frequently asked questions
Why does my async Python error have no useful stack trace?
Because the exception was raised in a task whose stack starts at the event loop, not at your request handler. Work dispatched with asyncio.create_task or into a thread pool loses the awaiting frames unless the tool’s asyncio integration reconstructs the chain. Check that the integration is installed, and prefer awaiting or TaskGroup over fire-and-forget tasks where you can.
Do Celery task failures show up automatically?
Only with a Celery integration installed. The web framework middleware never sees a worker process, so without the task-level hook a failing task produces either nothing or a context-free exception. With it, you get the task name, arguments and retry state, which is what makes the report actionable.
Should I turn off local variable capture?
Turn it off in any service that handles credentials, payment data or full request bodies you have not audited, and leave it on elsewhere. It is per-project configuration in every tool that offers it. If you leave it on, extend the scrubbing deny-list with your own field names and add a server-side rule as a backstop.
Is logging integration enough on its own?
No. It catches everything you already handle and log, which is valuable, but it misses unhandled exceptions the framework converts to a 500 before your logger sees them, and it produces no request context by itself. Install the framework integration and the logging handler together, then set the handler’s level so a retry loop does not empty your quota.
Related reading
- Best error tracking tools — the full category across languages and runtimes.
- Best APM for Python services — the tracing and profiling side, including overhead in sync workers.
- Best error monitoring tools for JavaScript — the browser half if your Python service has a frontend.
- Best open source error tracking — self-hosted options when captured locals cannot leave your network.
- Best log management tools — where the log lines around an exception live.
- Best incident management tools — routing an error spike to whoever is on call.