A server error tracker has an easy job. The process that failed is still alive, it has a network connection, and it can send the report before the request finishes. Mobile crash reporting has none of that.
When a native crash happens on iOS or Android, the process is gone. There is no “send the report now” — the signal handler or exception handler has a few unsafe milliseconds to write a minimal record to disk, and the upload happens on the next launch, if there is one. That single fact propagates through everything else. Your crash counts are delayed by however long it takes users to open the app again. Users who uninstall after the crash never report it at all. And your headline “crash-free users” number is a percentage of sessions that reported, not a count of what happened.
Then there are the failures that are not crashes: an app that freezes for eight seconds and gets killed by the watchdog, an Android ANR, an out-of-memory termination where the OS reclaims your process without any signal you can catch. A crash-only tool sees none of these, and for many apps they outnumber real crashes.
Most listicles in this category rank mobile tools on dashboard screenshots. The things that actually decide the outcome are symbol upload reliability, non-crash coverage, and whether your cross-platform runtime’s stack gets stitched to the native one.
Key takeaways
- Native crash reports are written to disk during the crash and uploaded on next launch, so delivery is best-effort and delayed, and users who never reopen the app never report.
- dSYM and ProGuard/R8 mapping upload is a release-pipeline step that fails silently and leaves you with hex addresses instead of a stack trace.
- ANRs, watchdog terminations and OOM kills are not crashes and are invisible to a crash-only tool, yet often affect more users than crashes do.
- React Native, Flutter and Unity need both the JS/Dart/C# stack and the native one, correlated — one without the other tells you almost nothing.
Why the report arrives on the next launch
The mechanism explains most of what confuses people about mobile crash data.
On iOS, a crash arrives as a Unix signal or an unhandled Objective-C exception. The handler runs inside a dying process, so it can do almost nothing safely — no allocation, no Objective-C runtime calls, no network. What it can do is walk the stack and write raw frame addresses plus minimal metadata to a file. On Android, a native crash goes the same way through a signal handler, while a Java or Kotlin exception is caught by an uncaught-exception handler that has slightly more freedom but is still in a process about to die.
On the next launch, the SDK finds the file and uploads it. Consequences worth internalising:
- Crash data lags the release. The spike you see at 10am may be crashes from 6am, because that is when those users reopened the app.
- Uninstalls are silent. The user most damaged by your crash — the one who deleted the app — is the one whose report you never get.
- A crash on launch may never report. If the app crashes before the SDK initialises and reads the pending file, the report can be stuck until a launch that gets far enough. Crash-on-launch bugs are exactly the ones where reporting is least reliable.
- “Crash-free users” is a rate, not a count. It is computed over sessions and users that reported. It is a good relative metric for comparing releases and a poor absolute one, and it moves when your session definition or SDK version changes.
The practical rule: treat crash-free percentage as a release comparison signal, not as ground truth about how many users were affected. For absolute impact, look at unique affected users on a specific issue and assume it undercounts.
Symbolication is a release-pipeline step that breaks quietly
A raw crash report is a list of memory addresses. Turning those into PaymentViewController.submit(_:) line 214 requires the symbol file produced by the build that the user is running — and getting that file to the vendor is where mobile crash reporting most often fails.
iOS: dSYM files. Xcode produces a .dSYM bundle per build, matched to the binary by UUID. If Bitcode-era recompilation or App Store processing produced a different binary, the dSYM you need is the one Apple generated, not the one your CI kept. If your CI uploads the wrong dSYM, or forgets to upload for a build variant, the vendor gets reports it cannot symbolicate and you see hex addresses in <redacted> frames.
Android: ProGuard/R8 mapping files. R8 renames and inlines aggressively. mapping.txt is what reverses it, and it is per build, per variant, per flavour. A team with three flavours and two build types has six mapping files per release and typically a CI step that handles the ones someone remembered.
Native Android: split debug symbols. NDK code needs the unstripped .so symbols uploaded separately. Teams that ship native libraries and skip this get symbolicated Kotlin frames sitting above unreadable native ones — the half that usually matters for a real crash.
The failure mode is the same in all three cases: nothing errors. The build succeeds, the release ships, the crashes arrive, and the reports are unreadable. Nobody notices until the first incident. Two defences are worth building regardless of vendor: make the symbol upload step fail the build rather than warn, and check for an unsymbolicated report in the dashboard as part of your release checklist.
Needs first-hand data: For each candidate tool, ship a deliberate crash in a TestFlight or internal-track build with the symbol upload step disabled, then re-enable it and re-upload. Record whether the tool retroactively symbolicates already-received reports, and whether it warns you anywhere that symbols are missing. Retroactive symbolication is the difference between a bad afternoon and a lost release.
The failures that are not crashes
For a lot of apps, crashes are the smaller problem.
ANRs (Android). The system flags an app whose main thread is blocked past a threshold while the user is interacting. The process does not die, so there is no crash handler involvement — detecting an ANR means watching your own main thread, or reading what Google Play reports. Users experience an ANR as the app being broken, and a crash-only tool shows a perfectly healthy release.
Watchdog terminations (iOS). iOS kills apps that take too long to launch, resume or respond. From the app’s perspective this is an 0x8badf00d exception type, and whether you see it at all depends on whether the tool models hangs and terminations as first-class events. The related, smaller-scale problem is the UI hang: a main-thread block long enough to be felt but short enough not to be killed. Those never appear in crash data and are frequently the top complaint in reviews.
Out-of-memory terminations. The OS reclaims your process under memory pressure with no signal to catch and no report to write. You cannot detect an OOM directly — you infer it: the app started, did not exit cleanly, did not crash, was not backgrounded, and the next launch is fresh. Every tool that reports OOM is running that inference, and the accuracy varies. Ask how it is computed before trusting the number.
Non-fatal errors. A caught exception, a failed API call, a decoding error that degrades the screen instead of killing it. These upload immediately like server errors do, and they are where most product-visible bugs live. A tool that treats them as first-class — with their own grouping and trends — is doing something a pure crash reporter is not.
Needs first-hand data: For one release, compare the affected-user count your crash tool reports against Google Play’s Android vitals and Xcode Organizer for the same issue and the same window. Record how large the gap is and in which direction. That gap is your reporting loss rate, and it is the number that tells you how much to distrust an absolute crash count.
React Native, Flutter and Unity need two stacks
A crash in a cross-platform app can originate in either layer, and a report from one layer alone is usually not enough to fix it.
React Native. A JavaScript error produces a JS stack that needs a source map to be readable, exactly like a browser error, while a crash in a native module produces a native stack needing dSYM or mapping files. The hard cases live at the bridge: a JS call into a native module that crashes gives you a native stack whose caller is invisible without the JS side attached. Hermes has its own bytecode source map format, so check the tool supports it specifically rather than assuming generic JS support covers it.
Flutter. A Dart exception carries a Dart stack, but AOT-compiled release builds obfuscate symbols and need the debug info file uploaded — the Dart-side equivalent of a dSYM, with the same silent-failure property. Platform channel crashes drop into native code the same way React Native’s bridge does.
Unity. IL2CPP compiles C# to C++, so a managed exception’s stack passes through generated code, and mapping it back needs the symbol files Unity produces at build time. Games also have crash patterns other apps do not — GPU driver faults, shader compilation, memory pressure from asset loading — and the tools with real Unity support model those.
The evaluation shortcut: whichever runtime you use, check that a single issue in the dashboard shows both stacks together. Two separate issues, one per layer, is a much worse product than the marketing implies.
Release timing changes what “resolved” means
On the server, you fix a bug and deploy, and within minutes nobody is running the broken code. On mobile, you fix it, submit for review, wait, release, and then wait again while users update — some of whom have auto-update off and will run the broken version for months.
Three consequences for how you use these tools:
- Filter every issue by app version. An issue marked resolved keeps producing events from users on old builds. A tool that shows “resolved in version 4.2, still occurring in 4.1” is telling the truth; one that just reopens the issue is wasting your triage time.
- Staged rollouts are your real safety net. Android’s staged rollout and iOS phased release let you compare crash-free rate between the new version and the previous one on live traffic. That comparison, not an absolute threshold, is what should gate continuing a rollout.
- Have a remote kill switch. Because a fix takes days to reach users, the ability to disable a feature server-side without shipping a build is worth more than any crash tool. Crash reporting tells you what broke; a feature flag is what stops the bleeding.
Firebase Crashlytics
Crashlytics is the default for mobile crash reporting and the baseline every other tool is measured against. It is free, it is well engineered, the SDK is small, symbol upload is a Gradle or Xcode build phase rather than a bespoke CI script, and it covers iOS, Android, Flutter and Unity. Its velocity alerting — a signal when a new issue is affecting an unusual share of sessions — is what most teams actually route to on-call. The catch is that it is a Google product, so its data ends up inside the Firebase and Google Cloud ecosystem rather than beside your backend errors.
Pros
- Free at any volume, which removes the cost argument from the decision entirely
- Symbol upload integrates into the standard Gradle and Xcode build, the most reliable place for it
- First-class ANR reporting on Android, plus Flutter and Unity support in the same product
- Velocity alerts on new issues are genuinely good at catching a bad release early
Cons
- Google ecosystem lock-in: crash data lives in Firebase, not next to your backend errors
- Non-fatal error handling is thinner than dedicated error trackers offer
- Limited custom context and query flexibility compared with paid tools
- No web or server coverage, so cross-platform teams still buy a second product
Best for: Nearly every mobile team as a baseline, and the right permanent answer for teams whose crash data does not need to sit beside backend errors.
Pricing: Free as part of Firebase with no volume tier for crash reporting; cost appears only if you use paid Firebase or Google Cloud services around it.
Sentry
Sentry’s argument for mobile is that the crash and the failing API call it depends on belong in one place. It covers iOS, Android, React Native, Flutter and Unity, handles ANRs and app hangs, and attaches the same release, breadcrumb and user-context model your backend projects already use. For teams that own both ends, one triage surface for a mobile crash and the 500 that caused it is worth more than any single mobile feature.
Pros
- Mobile crashes and backend errors in one product with a shared release and issue model
- Covers React Native with Hermes, Flutter with obfuscated builds, and Unity, with both stacks correlated
- App hangs, ANRs and slow startup are modelled as first-class events, not just crashes
- Self-hostable, which is rare in mobile crash reporting
Cons
- Paid on event volume, so it is a real line item against a free baseline that already works
- The SDK is heavier than a crash-only reporter, particularly with performance and replay modules enabled
- More configuration to get right than Crashlytics, whose defaults are simply correct for most apps
Best for: Teams shipping a mobile app and the backend it talks to, who want one issue list and one release model across both.
Pricing: Per-event quotas with separate meters for errors, performance and replay, plus a free tier; self-hosting trades licence cost for operations.
BugSnag / SmartBear Insight Hub
BugSnag, now part of SmartBear Insight Hub, built its identity on stability scoring, which fits mobile better than any other category. Instead of asking how many crashes occurred, it asks what share of sessions or users were crash-free in this release compared with the last — the number a release manager actually needs when deciding whether to continue a staged rollout. Its mobile SDKs are mature across native and cross-platform runtimes, with careful handling of the constrained crash-time environment.
Pros
- Stability score per release turns continue-or-halt on a staged rollout into a numeric decision
- Long-standing, well-tested SDKs for iOS, Android and the cross-platform runtimes
- Strong breadcrumb and session model that survives the crash-time constraints
- Same product covers web and mobile for teams shipping both
Cons
- Direction now sits inside a large quality-tooling portfolio rather than with a mobile-first roadmap
- Priced against a free and competent default, so the value case must be made explicitly
- Enterprise sales motion is heavier than the self-serve tools here
Best for: Teams that gate staged rollouts on a stability metric and want the same model across web and mobile.
Pricing: Per-event tiers with enterprise contracts above self-serve plans; feature availability varies by tier.
Embrace
Embrace is the tool built specifically for the argument this article makes — that crashes are the smaller part of mobile reliability. It captures the full user session rather than just fatal events, so ANRs, hangs, slow startups, network failures and OOM inference are first-class rather than add-ons, and you can replay the sequence of events leading to a problem. Note the vendor state: Embrace has announced a definitive agreement to be acquired by Palo Alto Networks, so the independent-vendor framing is on a clock.
Pros
- Session-level capture makes non-crash failures — ANRs, hangs, OOM, slow startup — visible in a way crash-only tools cannot
- Built for mobile specifically rather than mobile as one SDK in an observability platform
- Strong at the performance side of mobile reliability, including startup and network behaviour
Cons
- Announced acquisition by Palo Alto Networks means roadmap and packaging are open questions for a long bet
- Session-level capture is a heavier SDK and a larger data footprint than crash reporting
- Priced for teams treating mobile reliability as a program, which is hard to justify for a small app
Best for: Large consumer mobile teams where ANRs, hangs and OOM terminations matter more than the crash count.
Pricing: Volume-based on sessions or users monitored rather than crash events, aimed at a mobile-platform budget.
Luciq
Luciq — the product formerly known as Instabug — comes at mobile reliability from the user-feedback side. Its distinguishing feature is in-app bug reporting: a user shakes the device, annotates a screenshot and submits, and the report arrives with device state, logs and session data already attached. That covers the class of problems crash reporting structurally cannot see, namely bugs where nothing crashed and the app was simply wrong.
Pros
- In-app reporting captures bugs that produce no crash and no exception at all
- Crash reporting, performance monitoring and user feedback share one SDK and one session context
- Reports arrive with device state and logs attached, removing the usual back-and-forth with support
Cons
- The rebrand from Instabug means older documentation and community answers use the previous name
- Feedback-led capture is only useful if you have enough users willing to report
- Crash reporting depth is not the differentiator here, and the free baseline already covers it
Best for: Consumer app teams who need user-reported bugs and crash data in the same place, especially where QA and support share the triage.
Pricing: Plan tiers based on monthly active users or sessions covering feedback, crash and performance together.
Raygun
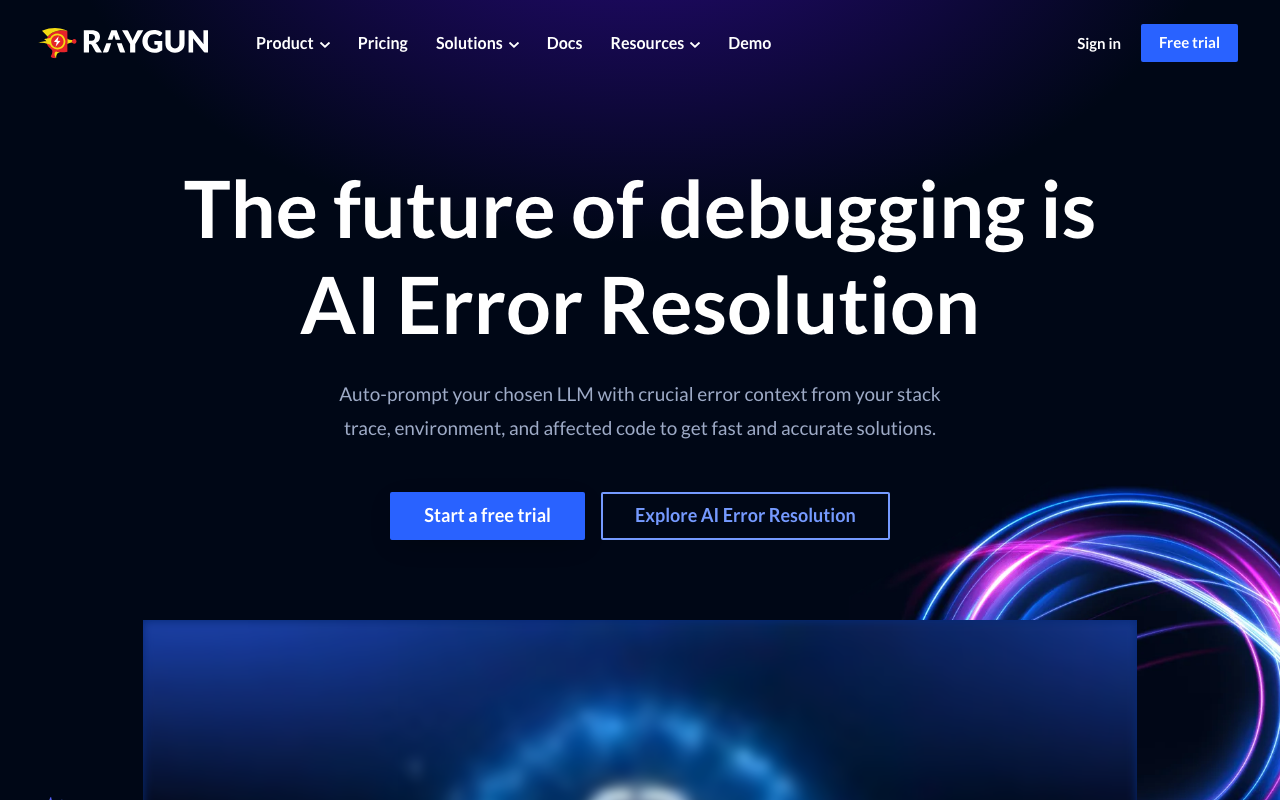
Raygun covers mobile crash reporting, real user monitoring and backend errors under one account, which suits a small team that would rather run one vendor than three. Its mobile support spans native iOS and Android plus the common cross-platform runtimes, and the same product holds the web frontend and server errors so a full user journey stays in one tool.
Pros
- Mobile, web and backend errors in one product and one contract
- Real user monitoring alongside crash reporting shows performance regressions the crash rate hides
- Straightforward symbol upload with a clear release model
Cons
- Mobile-specific depth trails the specialists on ANRs, hangs and OOM inference
- Smaller ecosystem and fewer integrations than the largest vendors
- Buying breadth means accepting less depth at every individual end
Best for: Small teams that ship a mobile app plus a web app and want one vendor across all of it.
Pricing: Volume-based across errors and RUM sessions as separate meters with retention by plan tier.
Rollbar
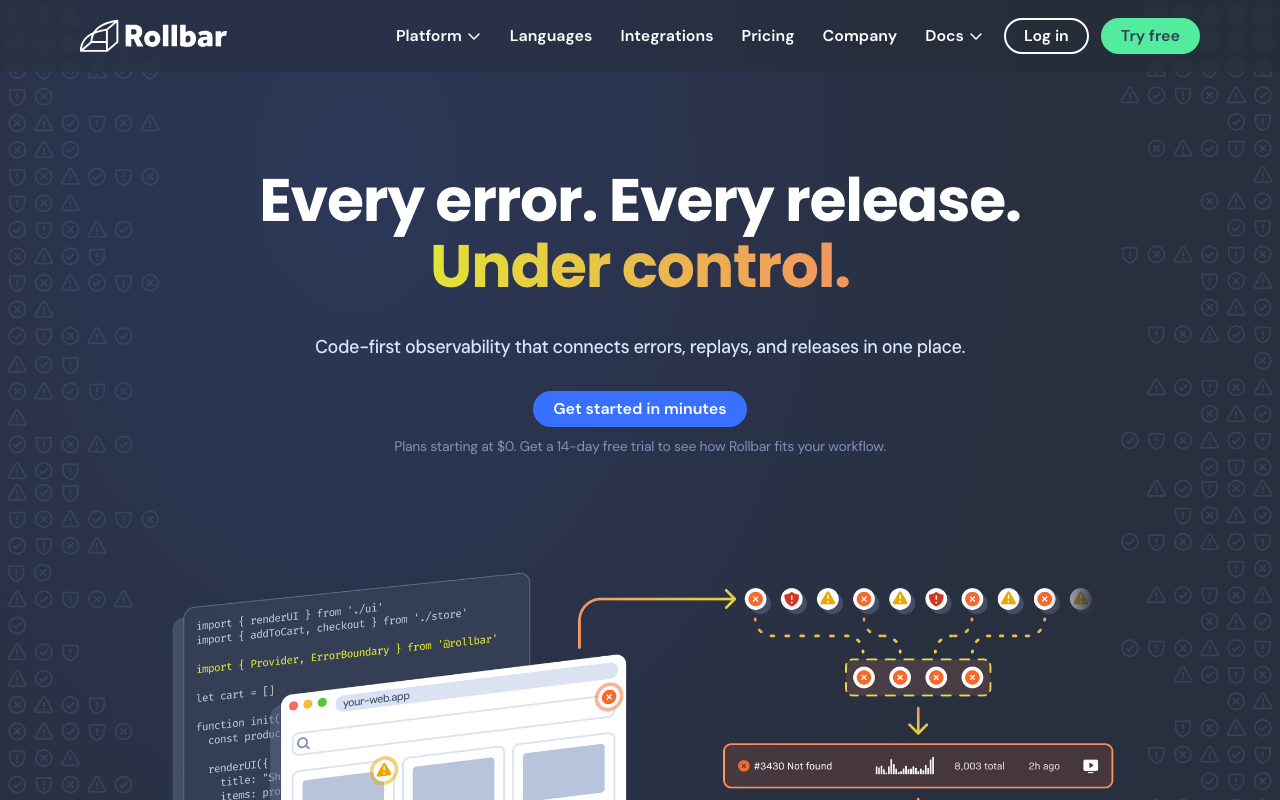
Rollbar’s strength is grouping control and its centre of gravity is server-side error tracking, so on mobile it is best understood as a way to keep one error tool across everything you ship rather than as a mobile specialist. If your backend already runs on Rollbar and your mobile crash volume is modest, sending mobile events there keeps triage in one place.
Pros
- Server-side grouping rules apply to mobile events too, which helps when one shared code path throws from many screens
- Keeps mobile and backend errors in one triage workflow and one bill
- Simple, predictable event-based model with no session metering
Cons
- Not a mobile specialist: ANR, hang and OOM coverage is not the strength
- Cross-platform runtime support is thinner than the mobile-first tools
- Competing against a free, competent default that handles native crashes better
Best for: Teams already standardised on Rollbar for backend errors who want mobile events in the same triage queue.
Pricing: Tiered on monthly ingested events across all platforms as a single meter.
Datadog

Datadog RUM for mobile puts crashes, app performance and user sessions in the same platform that already holds your backend traces, which produces the one thing no mobile-only tool can: a crash linked to the trace of the API call that caused it. For an organisation already committed to Datadog, that correlation is the argument, and the mobile SDK covers iOS, Android, React Native and Flutter with crash reporting, ANR detection and session tracking.
Pros
- A mobile crash links to the backend trace of the request that preceded it with no correlation work
- One platform and one on-call surface for mobile, web, backend and infrastructure
- Session replay for mobile is available in the same SDK for teams inside the platform
Cons
- Priced per RUM session, which on a high-traffic consumer app is a large number against a free default
- Mobile reliability depth trails specialists on OOM inference and hang analysis
- Adds another meter to a bill that is already hard to predict
Best for: Organisations already running Datadog who want mobile crashes joined to backend traces rather than in a separate tool.
Pricing: Per mobile RUM session with session replay metered separately, on top of existing platform spend.
New Relic
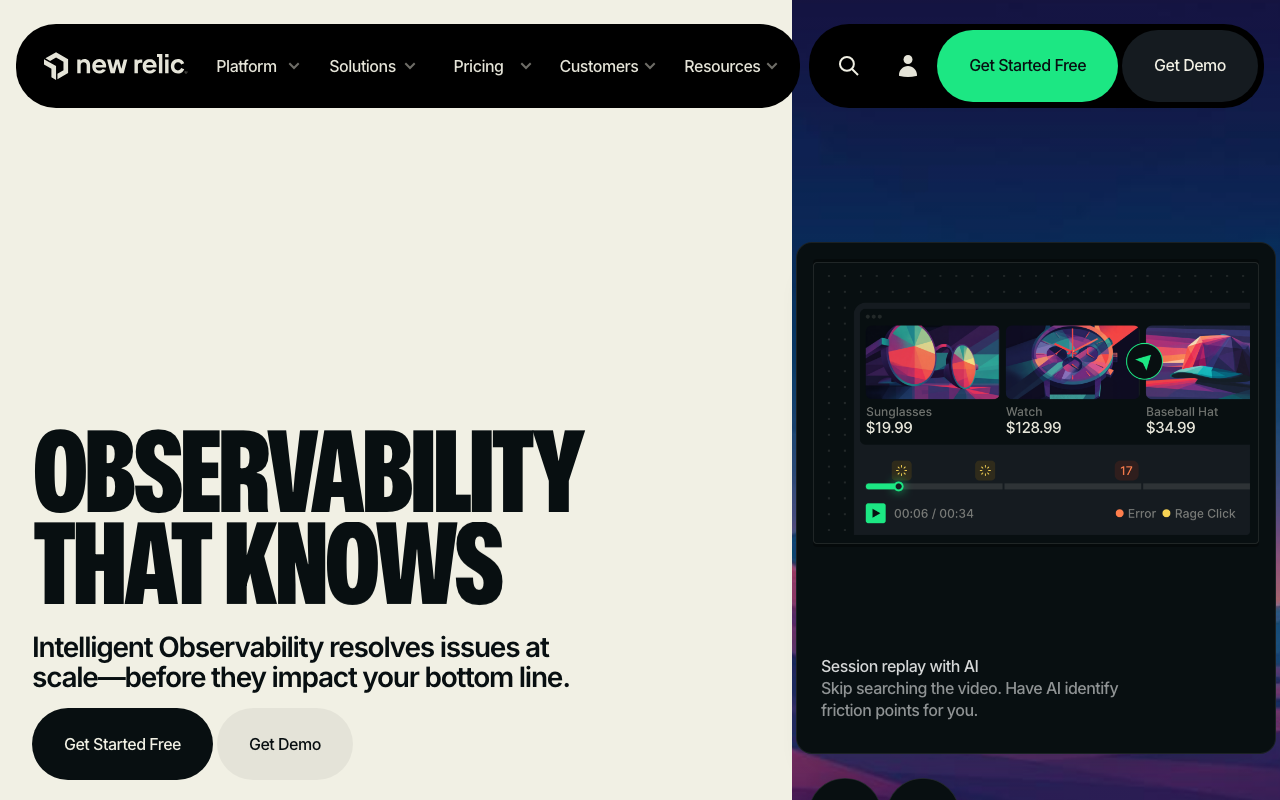
New Relic Mobile follows the same logic as Datadog’s offering — crashes inside an observability platform — with ingest-and-users pricing rather than per-session metering. It covers native iOS and Android plus React Native and Flutter, reports handled exceptions and HTTP errors alongside crashes, and puts mobile data in the same query language as everything else in the platform.
Pros
- Mobile crashes, network requests and backend traces queryable together in one language
- Ingest-plus-users pricing avoids per-session metering on a high-traffic app
- Free tier makes a serious evaluation cheap
Cons
- Mobile is one surface of a large platform rather than the product’s focus
- Per-user pricing above the free tier limits how widely you can share access
- Weaker than the specialists on ANRs, hangs and OOM inference
Best for: Teams already on New Relic who want mobile crash data in the same platform without per-session pricing.
Pricing: Metered on data ingested with per-user charges above a free allowance, rather than per session.
Apple’s Xcode Organizer crash reporting
Apple’s own crash reporting deserves a fair hearing because it is free, already installed, and requires no SDK at all. Crashes from App Store and TestFlight builds are collected by the OS, symbolicated by Apple using the dSYM from App Store Connect, and shown in Xcode’s Organizer grouped by issue, alongside energy, hang and disk write diagnostics. Because it lives below your app, it captures things an SDK cannot — including terminations where no in-process handler could have run.
The limits are equally real. Reports come only from users who opted into sharing diagnostics with developers, so coverage is partial and not under your control. There is no custom context: no user identifier, no breadcrumbs, no feature flag state, no non-fatal errors. There is no alerting, no assignment, no workflow, and no Android. It is a reference source, not an operational tool — but it is a genuinely useful one for verifying that your third-party tool is not missing a class of termination.
Pros
- Free, no SDK, no bundle size cost, and no data leaving Apple’s pipeline
- Symbolicated by Apple with the dSYM from App Store Connect, so it works even when your own upload broke
- Includes hang and termination diagnostics from below your process, where an in-app handler cannot reach
Cons
- Only users who opted into diagnostic sharing are represented, so coverage is partial and uncontrollable
- No custom context, no breadcrumbs, no non-fatal errors, no user identifiers
- No alerting or triage workflow, and iOS only
Best for: Every iOS team as a free cross-check on the third-party tool, and small apps whose crash volume does not justify anything more.
Pricing: Included with an Apple Developer Program membership at no additional cost.
How to choose
Start from the free baseline and make every paid tool earn its place.
Is your problem crashes, or reliability? If crash reports are what you need, Crashlytics plus Xcode Organizer covers it at no cost and you should be honest about what a paid tool adds. If your real complaints are freezes, ANRs and battery drain, you need session-level capture and the shortlist narrows to the tools that model non-crash failures properly.
Do mobile and backend errors need to sit together? If one team owns the app and the API and triages both, one product across both is worth paying for. If mobile is its own org with its own on-call, that correlation buys little.
What runtime do you ship? React Native with Hermes, Flutter with obfuscation, and Unity with IL2CPP each need explicit support. Verify with a deliberate crash in each layer before committing, not from the compatibility matrix.
| Tool | Focus | Non-crash coverage | Picks itself when |
|---|---|---|---|
| Firebase Crashlytics | Crash reporting | ANRs on Android | You want a competent free baseline |
| Xcode Organizer | Apple’s own diagnostics | Hangs, terminations | You ship iOS and want a free cross-check |
| Sentry | Errors across mobile and backend | Hangs, ANRs | One team owns the app and the API |
| BugSnag / Insight Hub | Release stability | Limited | Staged rollouts are gated on a number |
| Embrace | Mobile reliability | Deep | ANRs and OOM outrank crashes as a problem |
| Luciq | Feedback plus crash | Via user reports | Users report bugs that never crash |
| Raygun | Errors plus RUM, all platforms | Limited | One small team ships mobile and web |
| Rollbar | Error tracking | Limited | Backend already runs on Rollbar |
| Datadog | RUM module | Moderate | Datadog already holds the backend traces |
| New Relic | Platform module | Moderate | New Relic already holds the backend traces |
Whatever you pick, the two things that decide whether it works are outside the tool: make symbol upload a build-failing step, and ship a remote kill switch so a fix does not have to wait for App Store review. For the wider category see the error tracking hub.
Frequently asked questions
Why is my crash count lower than the number of user complaints?
Because reports upload on next launch. Users who uninstalled after the crash never send one, crash-on-launch bugs may never get far enough to upload, and users on poor connectivity report late or not at all. Treat crash counts as a lower bound and crash-free rate as a relative signal between releases.
Are ANRs and app hangs covered by crash reporting?
Not by default. The process does not die, so there is no crash handler involved — an ANR or watchdog termination is detected by watching the main thread or by reading platform-provided diagnostics. Check explicitly whether a tool models them as first-class events, because a crash-only tool will show a healthy release while users see a frozen app.
Do I need a paid tool if Crashlytics is free?
Only for a reason you can name. Crashlytics handles native crashes, ANRs and symbol upload well at no cost. Pay when you need mobile and backend errors in one triage queue, non-crash reliability signals like OOM and hang analysis, in-app user feedback, or a release stability metric to gate rollouts.
What breaks symbolication most often?
The symbol upload step in CI, silently. A new build variant nobody added to the upload script, a mapping file for a flavour that got skipped, native .so symbols never uploaded at all, or a dSYM that does not match the binary Apple processed. Make the upload fail the build, and check for unsymbolicated reports as part of your release checklist.
Related reading
- Best error tracking tools — the full category across languages, runtimes and platforms.
- Best error monitoring tools for JavaScript — source maps and the browser noise floor, which React Native shares.
- Best error tracking tools for Python — the backend counterpart when your app’s API is Python.
- Best RUM tools — real user monitoring, including the mobile session side.
- Best incident management tools — routing a bad release to on-call and running the rollback.
- Best status page tools — telling users about an outage when the fix cannot ship for days.